SPX Analysis by Deno Trading: Key Levels to Watch ForMy Take:
Looking at the 4-hour chart of the S&P 500 Index, it's clear that we're approaching a critical juncture. The price recently rallied up to the $5,620 - $5,630 resistance zone, which has been a significant barrier in the past. However, this level has proven to be tough for the bulls to break through, and we're now seeing signs of potential exhaustion.
Key Levels:
Resistance:
$5,620 - $5,630: This is the zone where the price is currently facing resistance. It’s a crucial area to watch because a failure to break above it could result in a pullback.
Support:
$5,480 - $5,440: If we see a rejection from the current resistance, I'm expecting the price to retrace towards this support zone. This area has acted as a strong floor in the past, and it's likely where buyers might step in again.
Trendline Support:
The upward trendline, originating from the lows earlier this year, is still intact. This trendline could provide additional support around the $5,280 level if the price breaks through the aforementioned support zone.
Expectations:
Pullback Potential:
Given the current price action, I wouldn’t be surprised to see a pullback from this resistance zone. The first area I'll be watching for potential support is the $5,480 - $5,440 zone. A break below this could bring us down to test the trendline around $5,280.
Continuation of the Uptrend:
If the bulls manage to push through the $5,620 - $5,630 resistance zone, we could see a continuation of the uptrend with a possible target towards $5,700 and beyond. But for now, I’m leaning towards the possibility of a short-term pullback before any further upside.
Final Thoughts:
Right now, I’m closely watching how the price reacts around this resistance zone. A pullback could offer a good buying opportunity, especially if it holds above the $5,480 - $5,440 support area. On the other hand, a strong breakout above $5,630 would signal that the bulls are in control and could push the market to new highs.
This is a video coverage of an analysis that I did yesterday. Stay Positive!
Spxanalysis

S&P500Analysis of the S&P 500
Weekly and daily time frame
The S&P 500 index is near the daily and weekly supply area, and long positions have higher risk.

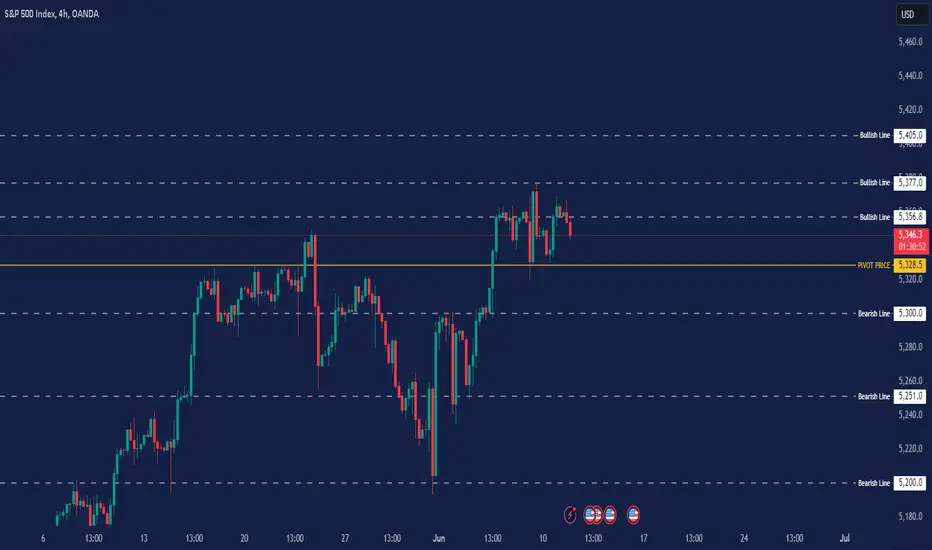
SPx500 FORECASTOverview:
- Current Price: 5,348.8, down by 0.10% (-5.3 points).
- Price Action: The index has been in a general uptrend, with some recent consolidation near the highs.
Key Observations:
1. Trend:
- The overall trend is bullish with higher highs and higher lows.
- There has been significant upward movement in late May, followed by some consolidation and minor pullbacks in early June.
2. Recent Price Movement:
- After reaching a high around 5356.8, the price has pulled back slightly and is currently consolidating just below this level.
- The consolidation near the highs indicates a potential continuation pattern, suggesting that the market might be gathering strength for another move higher.
3. Bearish and Bullish Levels:
- Resistance: The recent high around 5356.8 is acting as a resistance level. A breakout above this level could signal further bullish momentum.
- Support: The previous swing low around 5280.0 can be considered a key support level. If the price breaks below this level, it could indicate a potential trend reversal or a deeper correction.
4. Volume and Volatility:
- The chart does not show volume, but the recent price action suggests that volatility has been relatively low in the consolidation phase. Traders will likely watch for an increase in volume accompanying a breakout or breakdown to confirm the move.
Potential Scenarios:
1. Bullish Scenario:
- If the price breaks above the resistance at 5356.8 with strong momentum and volume, it could continue the uptrend, targeting new highs.
- In this case, the next psychological levels to watch would be around 5400.0 and 5450.0.
2. Bearish Scenario:
- If the price fails to break the resistance and falls below the recent consolidation low around 5280.0, it could signal the start of a correction.
- In this scenario, the next support levels to watch would be around 5220.0 and 5200.0.
3. Sideways Movement:
- The price could continue to consolidate between 5280.0 and 5356.8, indicating indecision in the market.
- Traders might wait for a decisive breakout or breakdown from this range to determine the next significant move.
Conclusion:
The S&P 500 index is currently in a bullish trend with a consolidation phase near recent highs. A breakout above 5356.8 could continue the uptrend, while a breakdown below 5280.0 might lead to a correction. Traders should watch for volume and momentum to confirm any potential moves.
Key Levels:
Bullish Lines: 5377, 5405
Pivot Point: 5328.5
Bearish Line: 5300, 5251
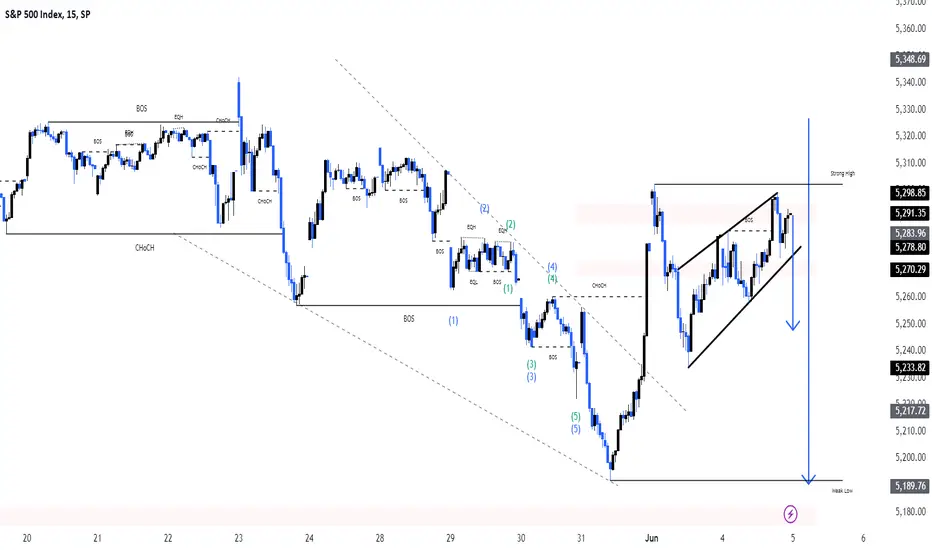
SPX500Pair : SPX500 Index
Description :
Break of Structure and Retracement
RSI - Divergence
Falling Wedge as an Corrective Pattern in Short Time Frame
Consolidation Phase
Completed " 12345 " Impulsive Waves
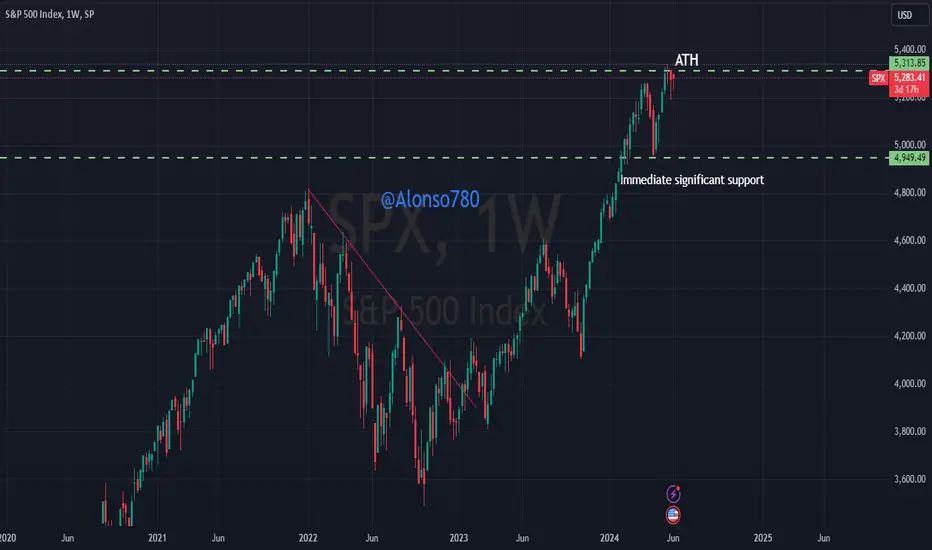
S&P 500 BearishUS Stock market is taking a break from the bullish aggressive push and soon it will be reflected in $S&P500 index.
Immediate area of demand as shown in the chart above
*********************************
Do your own research. Use a stop loss
SPX500 Will Go UP!SPX500 went down sharply
And the SPX is locally oversold
So as we are already seeing a
Bullish rebound from the
Horizontal support level of 5015
A further move up is to be expected !

SPX500Pair : SPX500 Index
Description :
Completed " 1234 " Impulsive Waves
Break of Structure
RSI - Divergence
Falling Wedge as an Corrective Pattern in Short Time Frame

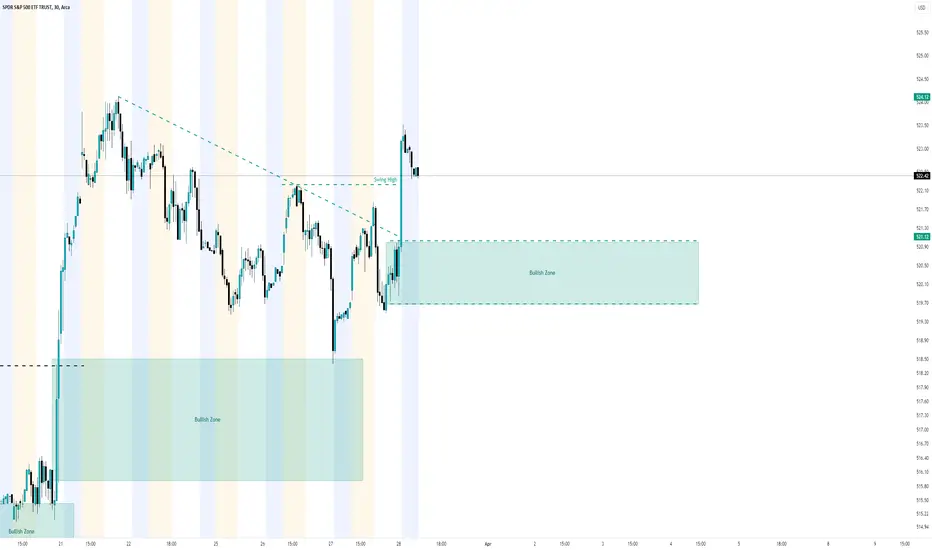
$SPY-28th March-Long IdeaSPY has broken out of its downtrend and has broken through the swing high, will be looking for longs if the market taps the bullish zone.
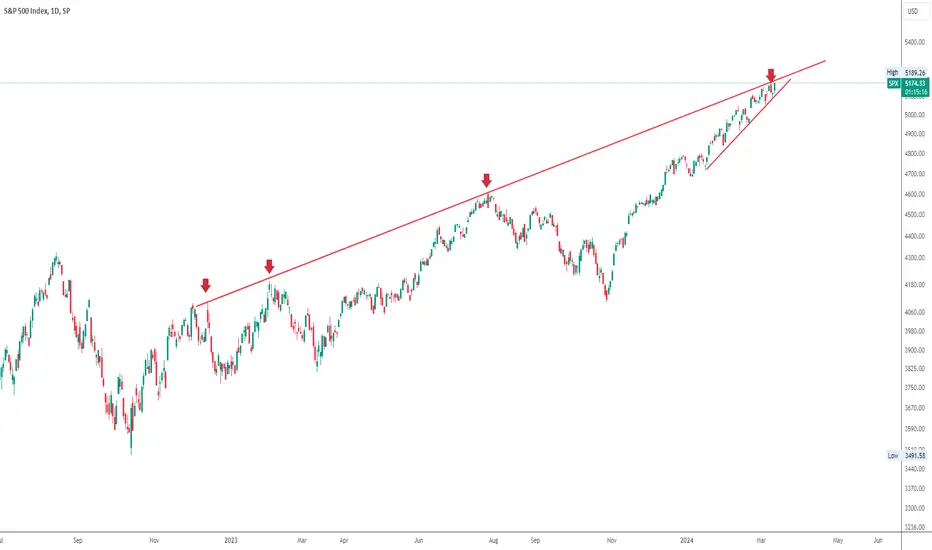
Important resistance for the S&P500 indexThe index has hit its dynamic resistance once again. As you can see, this resistance has been able to stop the growth of the index several times and cause the correction of the index.
Now you have to wait for the trigger line to break
SPX- Should visit 4800 supportSimilar to my analysis on PEPPERSTONE:NAS100 , I also anticipate a decline in the case of $CBOE:SPX.
The index attempted twice to remain above 5000 but failed, and it appears to be forming a double top in that area.
From a technical standpoint, the trend remains strongly bullish.
However, a drop below 4930-4950 would interrupt this aggressive uptrend and expose the 4800 support zone.

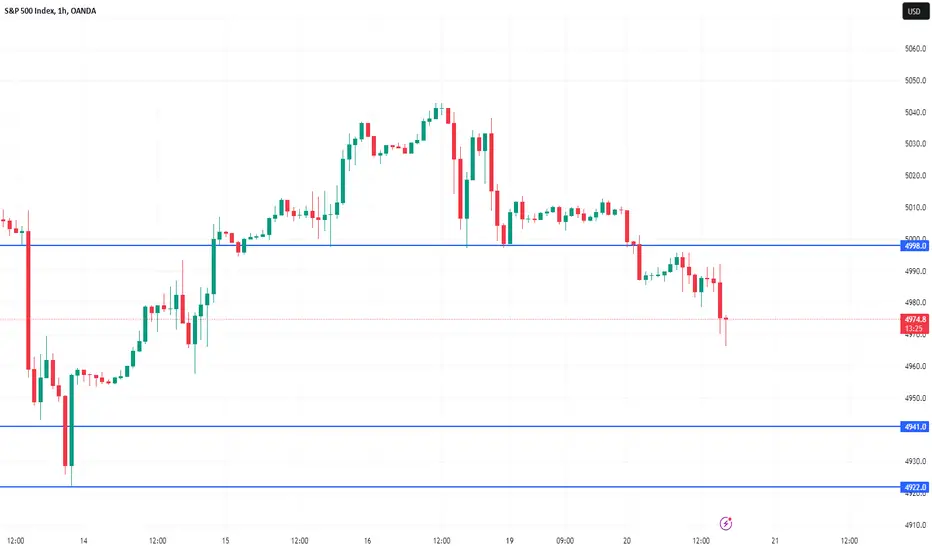
Liquidity sources are drying upOn Friday, the S&P 500 in the last part of the session began to fall with some force. And today, we have seen that it has fallen and opened below the support zone at 4.998
The question we have to ask ourselves is: What does this mean? Does it mean it will continue to fall? Has a roof formed?
Last Friday, the options contracts expired. This meant the disappearance of the gamma, and meant the disappearance of a source of liquidity, that is, the money coming from the dealers to cover the positions they had open.
That money has disappeared, therefore, we must consider that a source of liquidity is missing.
Until we see how the gamma is situated, at what levels it stabilizes and what the behavior of investors is in the options market, it is reasonable to think that we will witness temporary fragility at least during the first days of this week.
And what does the chart tell us?
This morning it has pierced the support in the 4.998 zone. This is a symptom of weakness, of short-term fragility.
What 2 options are there?
If it now rebounds and is not able to exceed the 5.000 level, it will most likely deploy a new downward leg.
And if it rebounds, and moves sideways above 5.000, it is most likely that the price will try to return to the high zone.
Now, 5.050 is a wall. It was already before the expiration of the options contracts, and it is even more so now. Therefore, maximum rise is in the 5.050 zone.
If it fails to break above 5.000, we have support between 4.941 and 4.922
As long as the S&P 500 remains above that level, I will maintain a bullish bias.
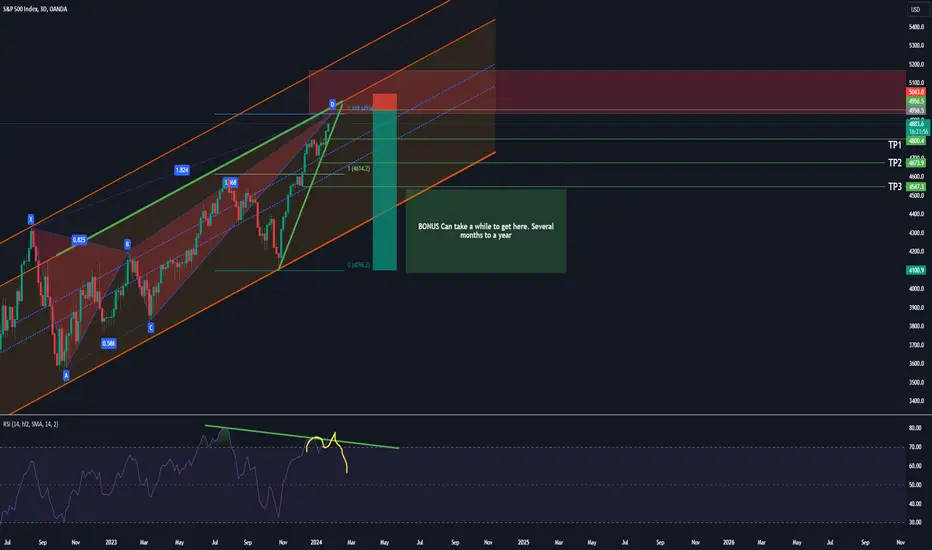
SPX Swing ShortChart is self-explanatory:
Confluences:
Deep Crab PRX
Top of the Parallel Channel
1.618 of the move from 4612 to 4100
Bear Div on RSI if We get a move down in coming weeks
#SPX SPX Jan 24th after the close updateSPX will be the first update from TheTradersRoom.
SPX has hit its desired target we have called yesterday - 4904.50-4909.50
So I call it a perfect hit. Today's reversal came on a heavy selling, also got a black reversal daily closing SPX candle, which if not broken 1c above should mark at least a temporary top.
If the price did find its top, then tomorrow's open should be a gap down below 4864 and my min target will be 4840-4835 SPX
We have a Panic cycle day on the 26th and Im looking for a first important low on Feb 1st
Happy to be back!

End of Bullish Supertrend? Journey from Support to SupportDear Esteemed Members,
The supertrend was bullish, but two sell signals concluded with a bearish price action.
The rejections happened around the resistance level from a previous top.
The price is now below the upper green support level.
I think the S&P 500 market will reach the next support level: around $4600.
So, I'd consider a short position. You can target the bottom support level of $4600, but keep a stop loss if the market reverses from the proximity of the violated support level.
You can observe a similar setup on my yesterday ES analytics, where I explained a bearish MACD, RSI, BBP, and MFI.
Kind regards,
Ely

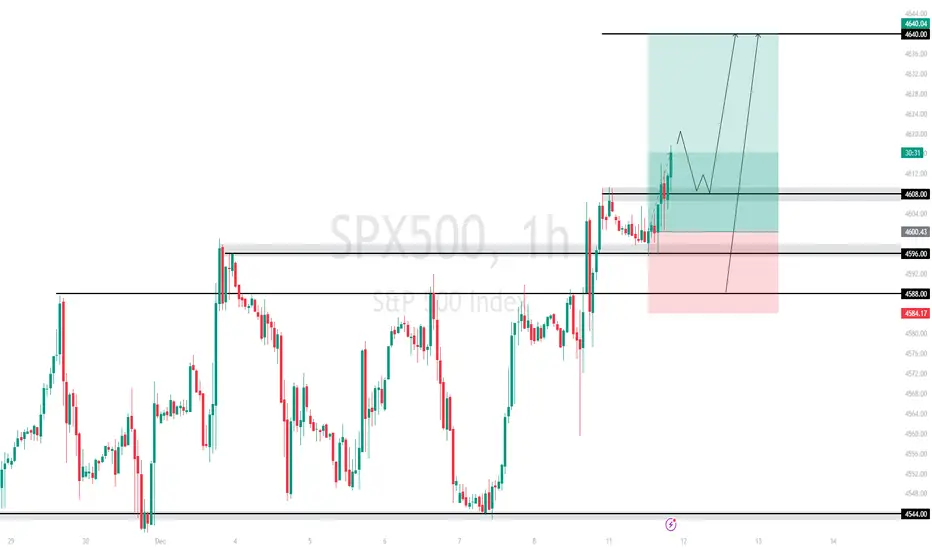
S&P500 TECHNICAL ANALYSISAs for S&P500 the index retested 4586.00 zone which presented some buying, as far as the long term trend for S&P 500 is bullish I will remain so and look to find buying opportunites only if the index trade above level 4588.00, but if the index break the level 4588.00 I will remain bullish but for me to take the trade I will want the index to trade above 4588.0 but for short positionsI want to see the 4544.00 level take out which for now it seems impossible but, nothing is impossible in trading, my t.p for long position will be @4640.00, which is more of a swing trade.
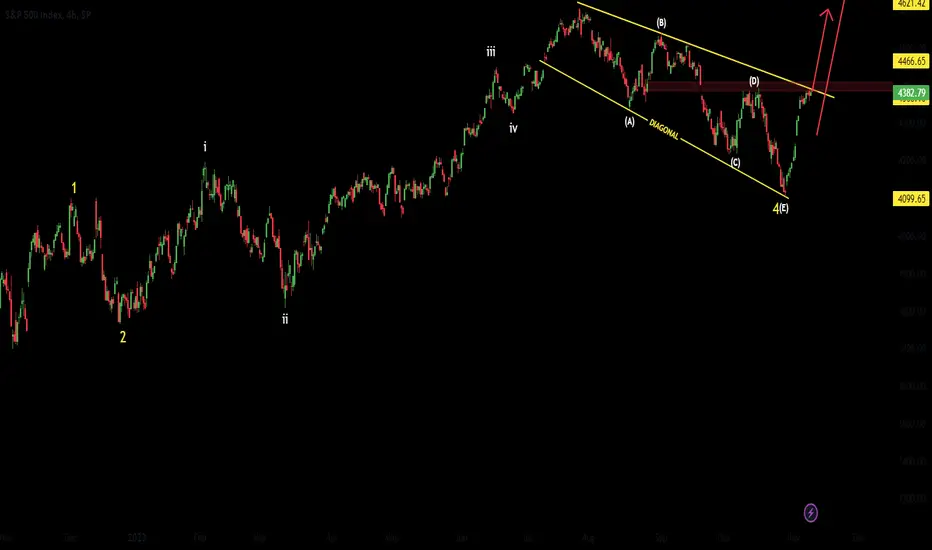
SPX500Pair : SPX500 Index
Description :
Exp FIAT as an Corrective Pattern in Short Time Frame and Rejection from the Lower Trend Line after it has Completed " abcde " Corrective Waves. Impulsive Wave " 1234 " Completed at Fibonacci Level - 50.00%
Entry Precaution :
Wait until it Breaks or Rejects UTL
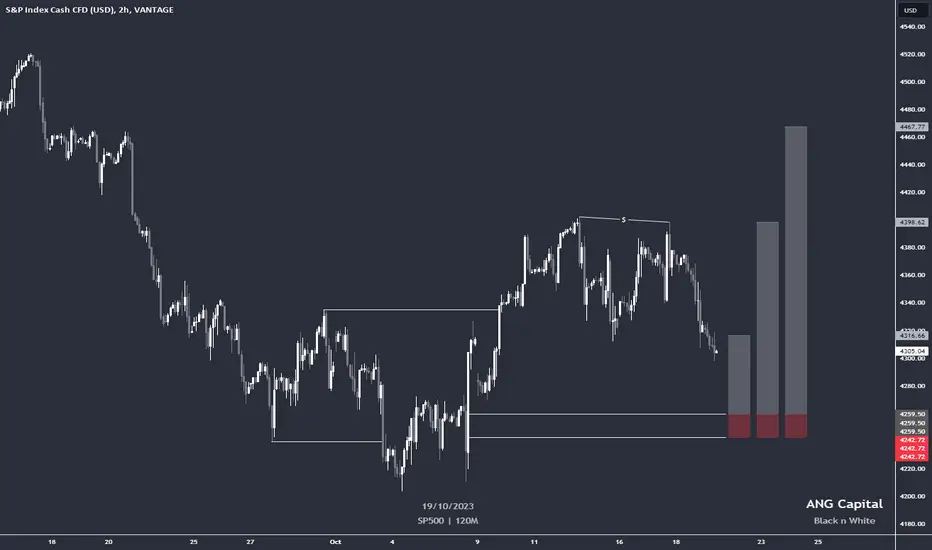
SPX Buy Idea 19/10/23Trade Details
Buy Limit
Entry: 4259.50
Take Profit 1: 4316.66 (4R)
Take Profit 2: 4398.62 (8R)
Take Profit 3: 4467.77 (13R)
Stop Loss: 4242.72 (-1R)
Key Notes
Order flow: Bullish
Trend: Bullish
Structure: Broken
Entry at Golden Zone
Disclaimer:
This is just a sample template and should not be used as financial advice. Always do your own research before making any trading decisions.
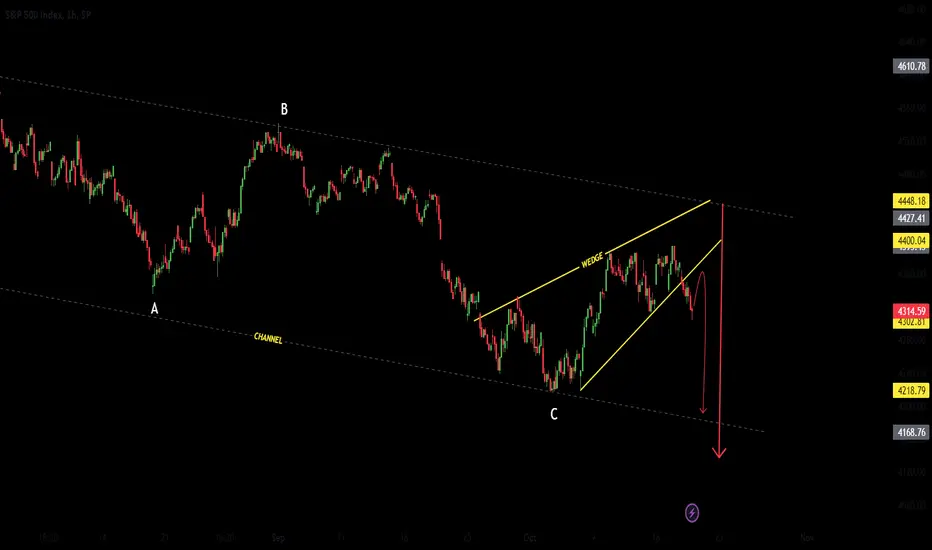
SPX500 19/10 MovePair : SPX500 Index
Description :
Bearish Channel Pattern as an Correction in Long Time Frame and Rejection from Lower Trend Line and Rising Wedge as an Corrective Pattern in Short Time Frame with the Breakout of the Lower Trend Line. Completed " ABC " Correction.
Entry Precautions :
Wait until it Complete its Retest and Rejects
$SPX: The S&P 500's Key Yellow Resistance TargetIn my previous update I discussed that SP:SPX has lost a key support level in the orange support zone. SP:SPX was sitting under resistance as investors waited for Friday jobs data. The strong jobs data led to a spike back up and SP:SPX has successfully regained support at this orange zone again. My current price target for SP:SPX is the yellow resistance trend line.

$SPX Approaches Resistance, Break or Rejection Tomorrow#SPX had some nice upside today, but the daily candle closed at resistance though. Tomorrow will be important for seeing whether SPX breaks above resistance or gets rejected back down.

SPX 500 - 04/10/23SPX 500
Lower highs now for the last two months and higher lows still bearish here till break the highs at the $4333 area, the target is the next low on the left at $4100

SPX Key Support Broken█ OVERVIEW
1M chart used here - the SP:SPX 1M close has broken down below the monthly trend line that has been used as support since September 2022.
Note the similar break down in December 2021.
█ TAKEAWAYS
Expecting support ranges from mid-late 2022 and early 2023 tested: 4100, 4000, 3700
Interest rate hikes would ensure these to be tested sooner rather than later
Keep an eye out for a bounce to retest that broken trend line around 4300. Major resistances exist at 4300, 4400 and 4600 respectively
Happy Trading.
ET

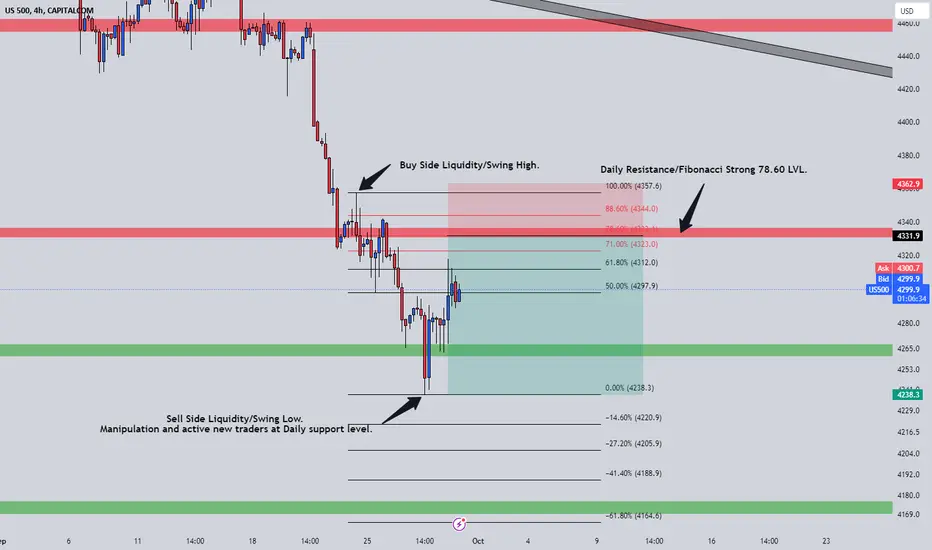
S&P 500 Analysis. Day trade Signal!!!Hello Everyone. I want share my idea about S&P 500 which will be signal for next week.
After Some pretty bearish momentum we got rejection from daily support. i think S&P will continue fall and i will try to catch that moment, for that i identify liquidity swings which gave me perfect entry area after used my Fibonacci levels, Fibonacci 78.60LVL and daily resistance is same place, trend what i see is still bearish, for that i decide to short it from That zone.
Here is my setup for my trading signal.
Open Short Position - 4332.1
Stop loss - 4358.00
Take Profit - First target at 4238.3 if it will reach then i will trail my stop loss at the Level.
Always Manage your own risk and make your own research!!!