SPXUSD (SNP500 / SPX) - Deep Bearish Pull-Back - Diagonal Wedge* If you like this free video and the idea itself, please remember to support me with a like or share, so I can produce more frequent contents such as this one. Thank you!
* Related ideas show how I was able to call the BIG drops in 2018.
Analysis Summary:
Scenario 1:
Leading Diagonal in Minor ABC (blue), part of a larger degree Ending Diagonal in the next Bull Market run, before the Market Crash.
In this scenario, a deep pull-back should take place until the 50-61.8% Fibonacci Retracements.
Fibonacci Extensions from Minors A&B (Minor C projection) are synchronizing with the Wedge Formation towards 2885.00 levels, but also with the joining Bearish Divergence.
Scenario 2:
SPX (SPXUSD) Alternate Count (turquoise) has been labeled in an Impulse which presents an Extension in Minor 3 (turquoise).
This scenario puts SPX (SPXUSD) in a Minor 4 (turquoise) correction, which should honor the 23.6% or 38.2% Fibonacci Retracements of Minor 3 (turquoise).
Decision:
Scenario 1 is the preferred outcome and this is because the rising wedge does not belong in Minor 3.
* Both scenarios imply a bearish sequence as the next structure.
SPXUSD (SPX) - SELL ORDERS
Aggressive Entry @ 2885.00 with SL @ 2965.00
Moderate Entry @ 2915.00 with SL @ 2965.00
Conservative Entry @ 2980.00 with SL @ 3050.00
TP @ 2800.00 / 2750.00 / 2600.00 / 2550.00
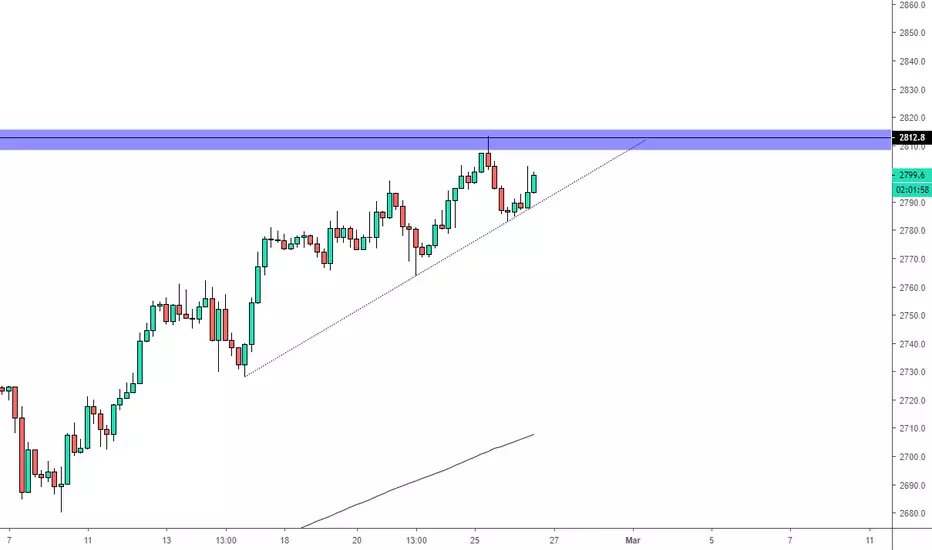
SPX - 4H Chart
* This idea is to be treated as simple Market commentary and not as an immediate investment advice.
Trade with care!
Many pips ahead!
Richard
SPXUSD

S&P 500 bullishRecent action suggests the bulls are still in control. I like buying dips here, ideally between the 2800 and 2790 levels
SPX - SHORT - Aggressive Entry - Excellent RORSPX - Short Trade
Type - Aggressive
Entry - Market Entry (approx. 2815.00)
SL @ 2863.00
TP @ 2750.00 / 2640.00 / 2600.00 / 2525.00
Many pips ahead!

SPX to a bear runThe break of this counter trend trade must bring us to the 200 ema in the next week, try to catch the blue zone for sell, but this counter trend line must be enough if the price dont go to 2800, lets see how this one play for a long term trade and minimum risk. Beautiful picture.
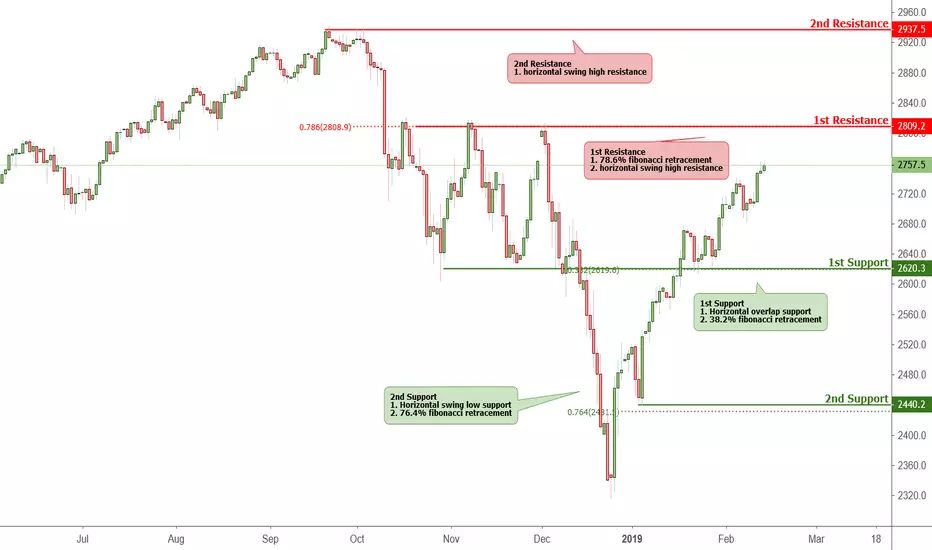
SPXUSD - Daily Key Elements Key levels to look out for, please refer to our 4 hour chart for a strategic view!
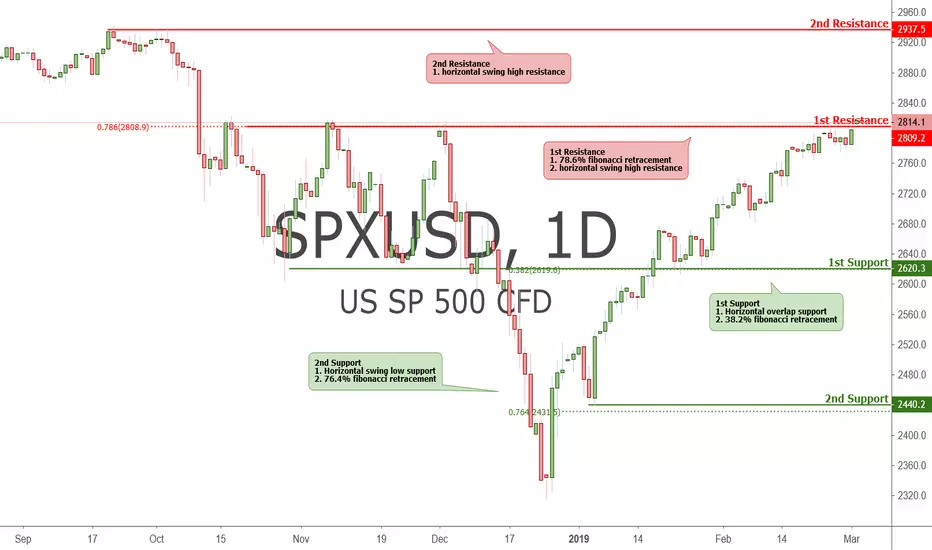
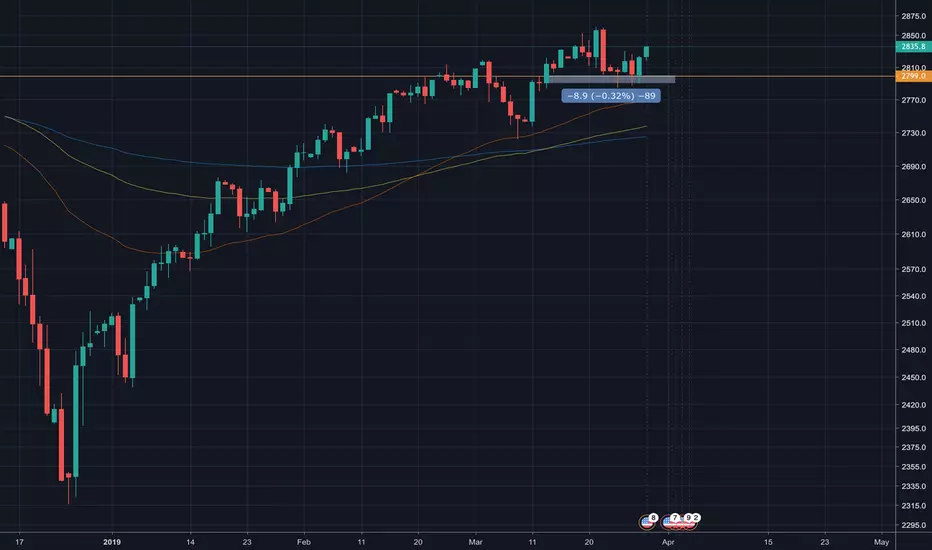
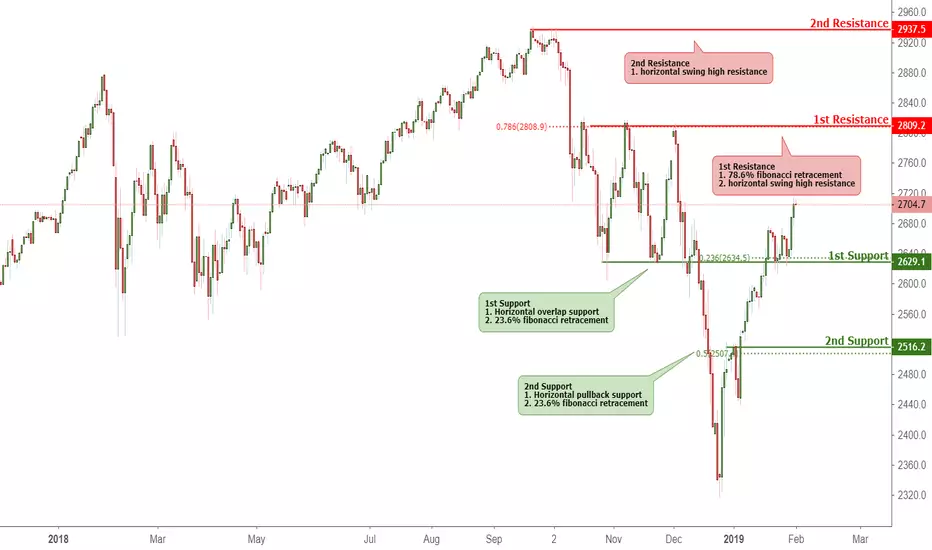
SPXUSD approaching resistance, potential drop! SPXUSD is approaching our first resistance at 2819.7 (78.6% fibonacci retracement, horizontal pullback resistance, 100% fibonacci extension) where a strong drop might occur below this level pushing price down our first support at 2704.2 (horizontal pullback support, 23.6% fiboancci retracement).
Stochastic (89,5,3) is also approaching resistance and seeing a bearish divergence where we might see a corresponding drop in price.

SPXUSD - Dailiy Key Elements Key levels to look out for, please refer to our h4 chart for a strategic view!

SPX to short??SPX looks being dragged by the oil Price, if oil continues going down, we will see an sell off in sp500


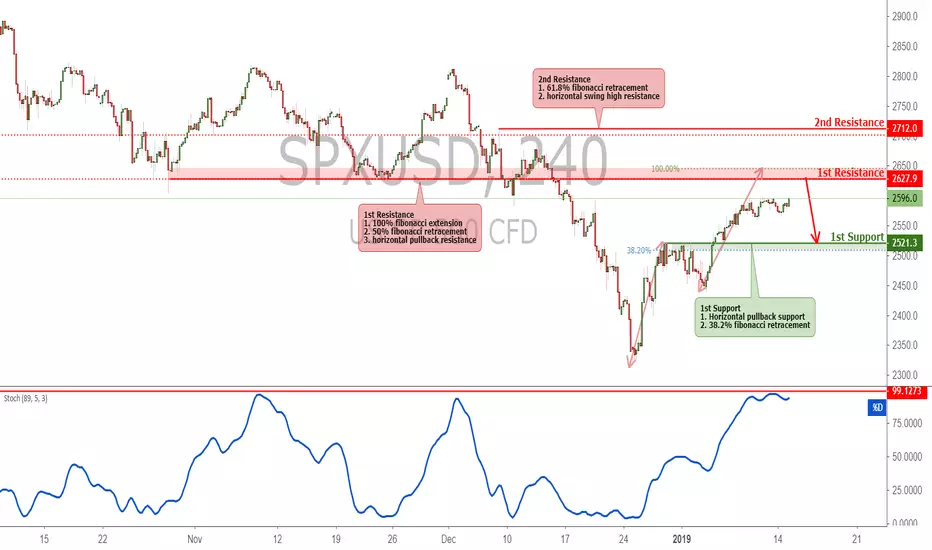
SPXUSD testing resistance, potential reversal!SPXUSD is testing our first resistance at 2627.9 (horizontal pullback resistance, 50% fibonacci retracement , 100% fibonacci extension ) where a strong drop might occur below this level pushing price down to our major support at 2521.30 (horizontal pullback support, 38.2% fiboancci retracement).
Stochastic (89,5,3) is also testing resistance where we might see a corresponding drop in price.

Update: Short either 2531 - 2611 or both until 2272I didn't show the 2531 level in my previous forecasts, but it could potentially be a very important level. TBC

SPXUSD approaching resistance, potential reversal!SPXUSD is approaching our first resistance at 2627.9 (horizontal pullback resistance, 50% fibonacci retracement, 100% fibonacci extension ) where a strong drop might occur below this level pushing price down to our major support at 2521.30 (horizontal pullback support, 38.2% fiboancci retracement).
Stochastic (89,5,3) is also approaching resistance where we might see a corresponding drop in price
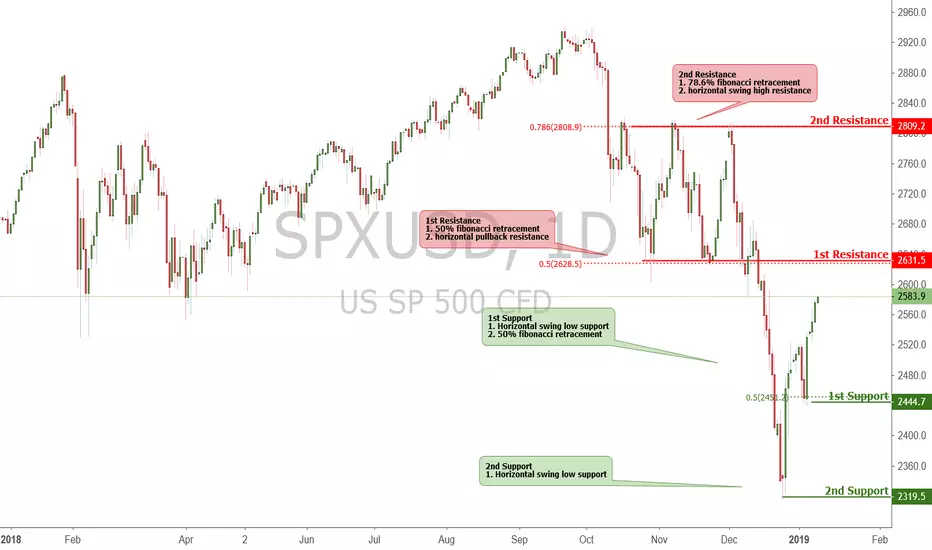
SPXUSD approaching resistance, potential drop! SPXUSD is approaching our first resistance at 2631 (hroizontal pullback resistance, 50% fibonacci retracement) where a strong drop might occur below this level pushing price down to our major support at 2521 (horizontal pullback support, 38.2% fibonacci retracement).
Stochastic (89,5,3) is also approaching resistance where we might see a corresponding drop in price.

SPXUSD - Daily Key Elements Key levels to look for when analysing SPXUSD, please refer to our 4 hour chart for a strategic view!
SPXUSD Approaching Resistance, Potential Reversal!SPXUSD is approaching our first resistance at 2571.4 (horizontal pullback resistance, 61.8% fibonacci extension , 38.2% fibonacci retracement ) where a strong drop might occur below this level pushing price down to our major support at 2474.2 (38.2% Fibonacci retracement, horizontal swing low support).
Stochastic (34,5,3) is also approaching resistance where we might see a corresponding drop in price.

Test: Check this graph 6 months later.Statistically, I'd expect some sudden sharp upside moves and many gap fills to happen by approximately 6 months. When the market can trick a maximum number of traders, then it will trick the maximum number of traders. The Big Short may resume right after, if this year happens to be THE year.


Target reached : Long for some retracements until invalidationThere are in my opinion quite a few reasons to go long (potential sharp countertrend rally and pullback) before the global downtrend resumes, but we're still never too certain. Let's see what happens in the coming days. Let's hope no black swans will kill the markets just after the holidays.

My current view on the SP500. Again, even the markets bounce back, money unloading and fresh shorts would cause havok. I do not currently believe in a bull market for next year.

Potential scenario: Short post-FOMC or pull-back 2620 then shortNo matter what, my opinion is that odds favor the shorts (swing) until invalidation. We shall see what next year gives.

There are so many targets, but as it goes, 2376 could be one We shall see which target prevails. Be nimble
