SPXU Gold Mine---Shh...SPXU GoldMine---Shh...
Daily Chart. Short-Term Trade Idea. Long Play on SPXU.
SPXU is an inverse ETF of S&P 500 and has been in a downward trend for almost 10 years (since 2009). Makes sense as the S&P has been in an upward trend since the great recession in the U.S. However, SPXU recently broke out two times this month with volume confirmation each time (large green bars).
Note: Red line represents 20 days Exponential Moving Average (EMA); Green Line 50 day; Blue Line 200 day.
Entry:
Wait for a pull back on the daily chart based on a FIB ratio (23.6%, 38.2%, 50%, 61.8%) or Green 50 day MA
Exit:
First Target $13.00 (200 MA) range (likely)
Second Target (Resistance): 15.50 range (TBD)
Third Target (Resistance): 17.50 range (TBD)
Hit the Like Button if you Dig. Good Luck!
**This is not financial advice. This trade is for educational purposes only. Always trade responsibly & don't lose more than you can afford.***
SPXUSD


SPXUSD. Market says: "Boooh!!"With only 16% of bulls left, SPXUSD, NSXUSD and US30 find themselves at November 2017 levels. The decline was expected however the speed of a flush was really impressive!
In this video we will try to see if the panic selling keeps on or bulls may finally have a relief.

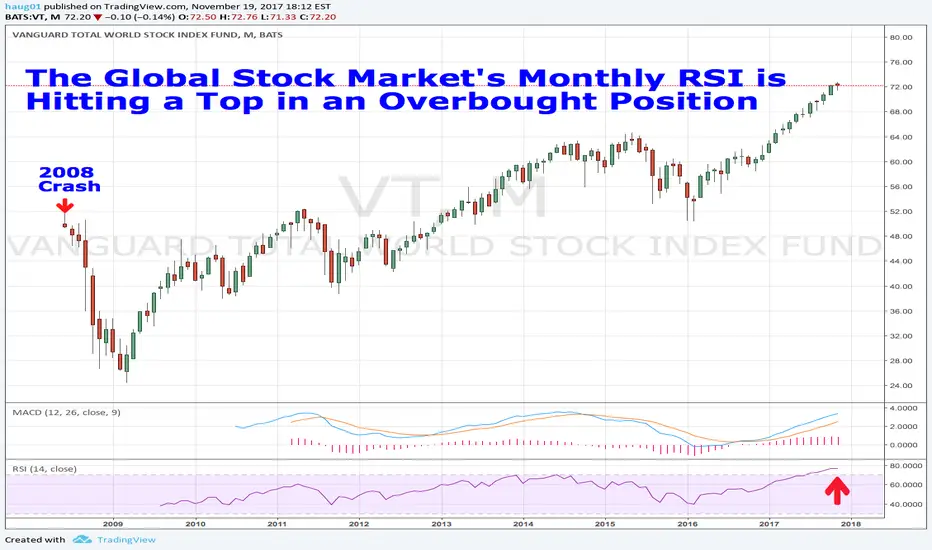
The Global Stock Market's Monthly RSI is Hitting a TopThe Global Stock Market's Monthly RSI is Hitting a Top in an Overbought Position. This is dominated by US equities.
There is no etf to short this index in my 401k. I am currently short one Dow future. Trying to short the US market has not been very rewarding so far. I will start shorting it more going forward. I watched my 401k fall a lot in 2008 and watched it recover over 9 years. I am currently all in cash in my 401k. I am long 2 corn futures and 2 soybean meal futures in my margin account.