3 Explosive Setups I'm looking at this week $TSLA, $BAC, and $BPThis week should be massive for these 3 stocks.
I'm waiting for a signal on the weekly and all of these stocks should run to price targets.
Spy!

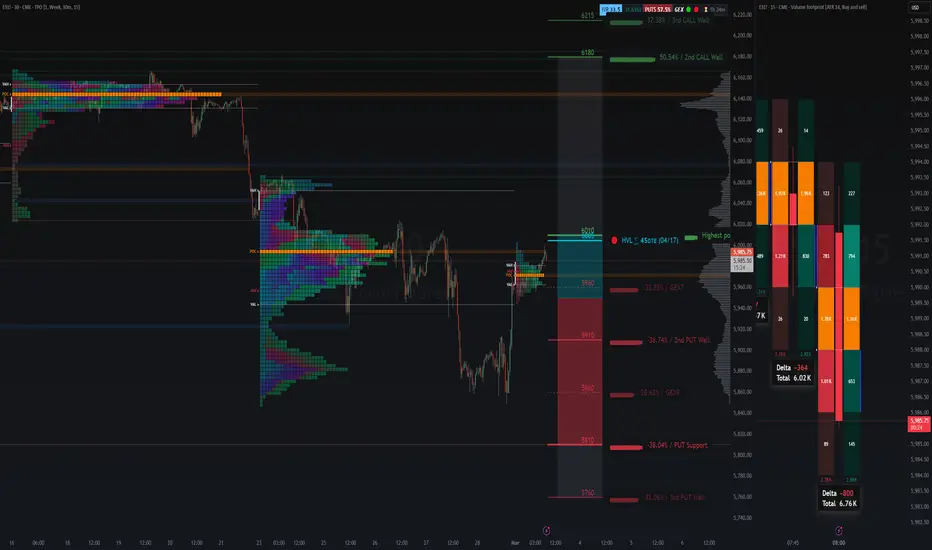
Weekly Melt Up Target Achieve during Globex /ES $SPY SSPX
If we cant break / trade and close above 5955-6000 GEX (Call Wall) during IB "initial balance" cash session players can go look for buyers at 5810 Put Support.
Keep your eyes on TVC:VIX !!
Weekly $SPY / $SPX Scenarios for March 3 – March 7, 2025🔮 Weekly AMEX:SPY / SP:SPX Scenarios for March 3 – March 7, 2025 🔮
🌍 Market-Moving News 🌍:
🇺🇸📊 Anticipated U.S. Jobs Report 📊: The Bureau of Labor Statistics will release the February employment report on Friday, March 7. Economists expect an increase of approximately 133,000 nonfarm payrolls, with the unemployment rate holding steady at 4%.
🇪🇺💶 ECB Interest Rate Decision 💶: The European Central Bank is scheduled to announce its monetary policy decision on Thursday, March 6. Markets anticipate a 0.25% rate cut, which would adjust the deposit facility rate to 2.5%.
🇨🇳📈 China's Economic Targets 📈: During the National People's Congress, China is expected to set its economic growth target at around 5% for the year. The government may introduce measures to boost consumption and support growth amid global economic uncertainties.
📊 Key Data Releases 📊:
📅 Monday, March 3:
🏭 ISM Manufacturing PMI (10:00 AM ET) 🏭: This index measures the health of the U.S. manufacturing sector. A reading above 50 indicates expansion, while below 50 signifies contraction.
📅 Wednesday, March 5:
🏢 ISM Services PMI (10:00 AM ET) 🏢: This index assesses the performance of the U.S. services sector, with readings above 50 indicating expansion.
Trading Economics
📅 Thursday, March 6:
📉 Initial Jobless Claims (8:30 AM ET) 📉: Weekly data indicating the number of individuals filing for unemployment benefits for the first time.
📦 Factory Orders (10:00 AM ET) 📦: This report details the dollar level of new orders for both durable and non-durable goods, providing insight into manufacturing demand.
📅 Friday, March 7:
👷♂️ Nonfarm Payrolls (8:30 AM ET) 👷♂️: A key indicator of employment trends, reflecting the number of jobs added or lost in the economy, excluding the farming sector.
📈 Unemployment Rate (8:30 AM ET) 📈: The percentage of the total workforce that is unemployed and actively seeking employment during the previous month.
💵 Average Hourly Earnings (8:30 AM ET) 💵: This metric indicates the month-over-month change in wages, providing insight into consumer income trends.
⚠️ Disclaimer: This information is for educational and informational purposes only and should not be construed as financial advice. Always consult with a professional financial advisor before making investment decisions.⚠️
📌 #trading #stockmarket #economy #news #trendtao #charting #technicalanalysis
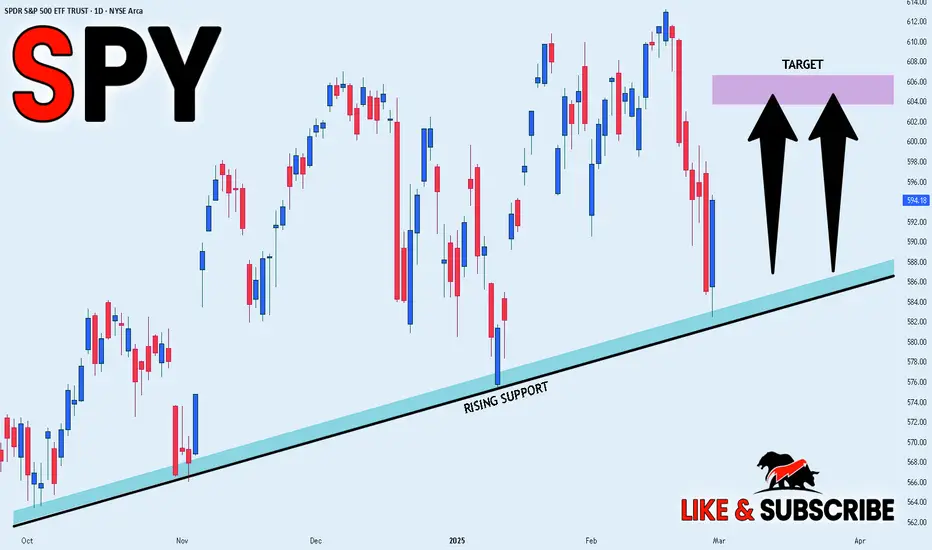
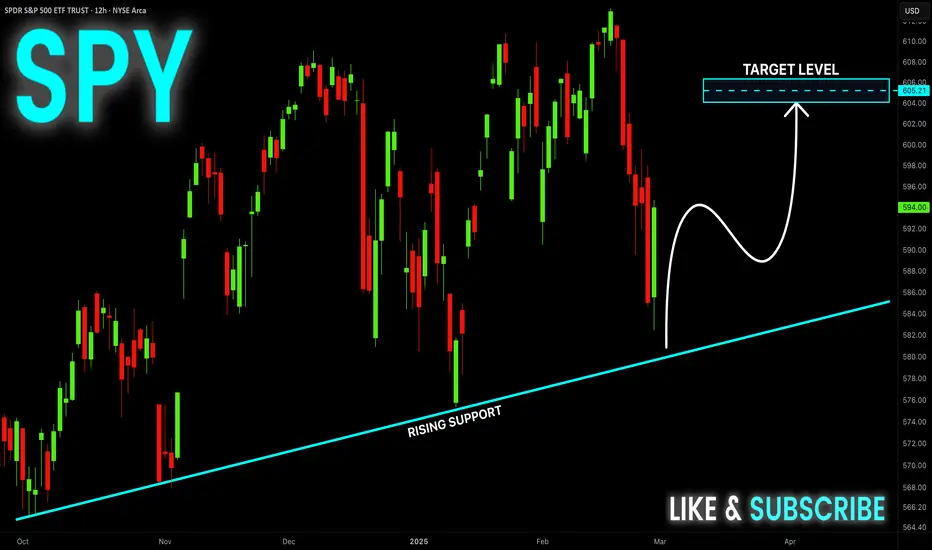
SPY GROWTH AHEAD|LONG|
✅SPY is trading along the rising support line
And as the pair is going up now
After the retest of the line
I am expecting the price to keep growing
To retest the supply levels above at 604.00$
LONG🚀
✅Like and subscribe to never miss a new idea!✅
Weekly plan: ESH2025NYSE:ES FUTURES 3/3/2025
6012>> 6056>>> 6083-93
Weekly pivot: 5970 , Now Trading @ 5957
5919>> 5878>>> 5828
CONTEXT: NYSE:ES closed Friday's session with massive spike to the upside. Now NYSE:ES is back inside the previous balance zone that extends to 214 points range with 6056 for half back, however we need to be cautious since daily chart still is One Time Framing Down (OTFD) which would end if NYSE:ES is able to recapture or trade above 5971, at that point we will need to redraw daily balance zone.
@everyone

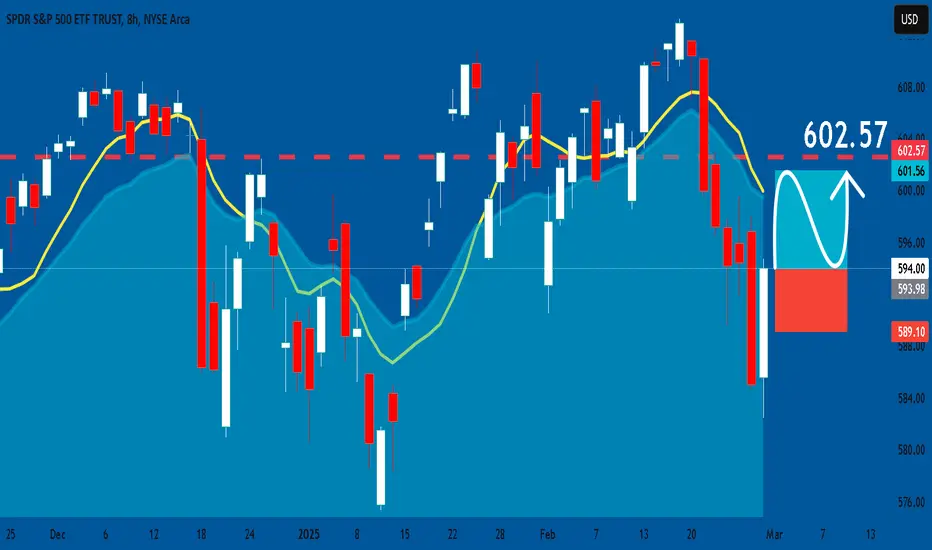
SPY: Long Signal with Entry/SL/TP
SPY
- Classic bullish pattern
- Our team expects retracement
SUGGESTED TRADE:
Swing Trade
Buy SPY
Entry - 594.00
Stop - 589.10
Take - 602.57
Our Risk - 1%
Start protection of your profits from lower levels
❤️ Please, support our work with like & comment! ❤️
SPY Will Go UP! Buy!
Hello,Traders!
SPY is trading in an
Uptrend along the rising
Support and we are already
Seeing a bullish rebound
So we are bullish biased
And we will be expecting
A further bullish move up
Buy!
Comment and subscribe to help us grow!
Check out other forecasts below too!
Stock Market Forecast | TSLA NVDA AAPL AMZN META GOOGL MSFTStock Market Forecast | QQQ, SPY, AMEX:XLV , AMEX:XLF
Mag 7 Forecast | NASDAQ:TSLA NASDAQ:NVDA AAPL AMZN META GOOGL MSFT

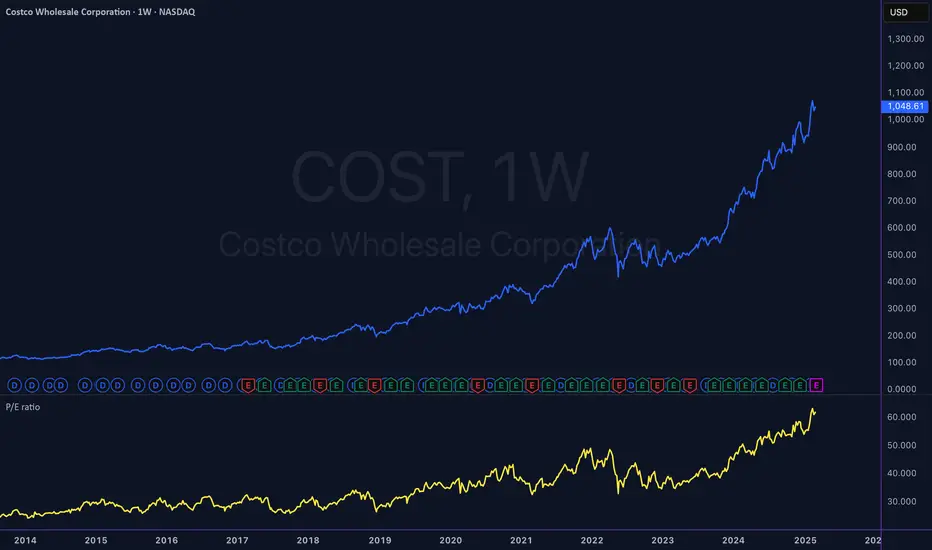
Selling Premium Going into Costco EarningsGiven Costco’s historical tendency for minimal post-earnings stock movement, along with inflated IV in the options market, selling premium via a bear call spread is a high-probability, risk- managed strategy to profit from an expected IV crush and minimal price movement following earnings.
Key Points Supporting the Thesis:
1. Historical Price Movement: Over the past 4 years, Costco’s stock has experienced an average post-earnings price movement of only 1.24%. The majority of moves have been within a modest range of -1% to +2%. This indicates that despite earnings announcements, the stock tends to remain within a predictable price range, minimizing the potential for significant directional price swings.
2. Implied Volatility and Overpricing of Options: Currently, the options market is pricing in a 4.6% move for Costco’s stock post-earnings. Given Costco’s historical price movement patterns, this is an overestimation of potential volatility. IV tends to collapse after earnings announcements.
3. Costco’s High Valuation: Costco is currently trading at a P/E ratio of 61, which is significantly higher than historical levels. This suggests that the stock is already expensive relative to its
earnings potential, making it less likely to experience a massive upward movement after earnings. The high valuation also means that even strong earnings may not drive significant upside, further increasing the likelihood of a muted post-earnings reaction.
4. Earnings Catalysts and Market Behavior: Costco’s earnings reports historically have had limited impact on the stock’s price due to the company’s stable revenue and earnings growth.
Investors have already priced in much of the growth potential, leading to minimal surprise reactions to earnings releases. The combination of low historical price movement and high IV makes this a prime environment for selling premium, as the likelihood of large moves is low, while option prices remain high.
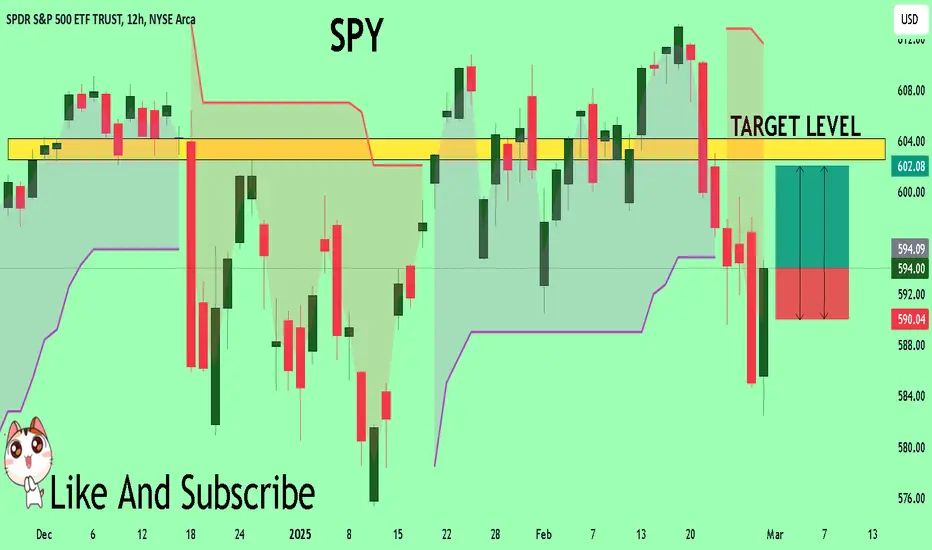
SPY Trading Opportunity! BUY!
My dear friends,
Please, find my technical outlook for SPY below:
The price is coiling around a solid key level - 594.00
Bias - Bullish
Technical Indicators: Pivot Points Low anticipates a potential price reversal.
Super trend shows a clear buy, giving a perfect indicators' convergence.
Goal - 602.54
Safe Stop Loss - 590.04
About Used Indicators:
The pivot point itself is simply the average of the high, low and closing prices from the previous trading day.
———————————
WISH YOU ALL LUCK
Trump Pump. Trump Dump. Trading Family,
We had our Trump pump. Now, we are seeing a Trump dump. Tariffs and other geopolitical events are causing market uncertainty. Let's take a look at our charts to find out how much more pain we are in for. And, a positive sign. Smaller cap altcoins and many memecoins appear to be holding strong!
✌️ Stew

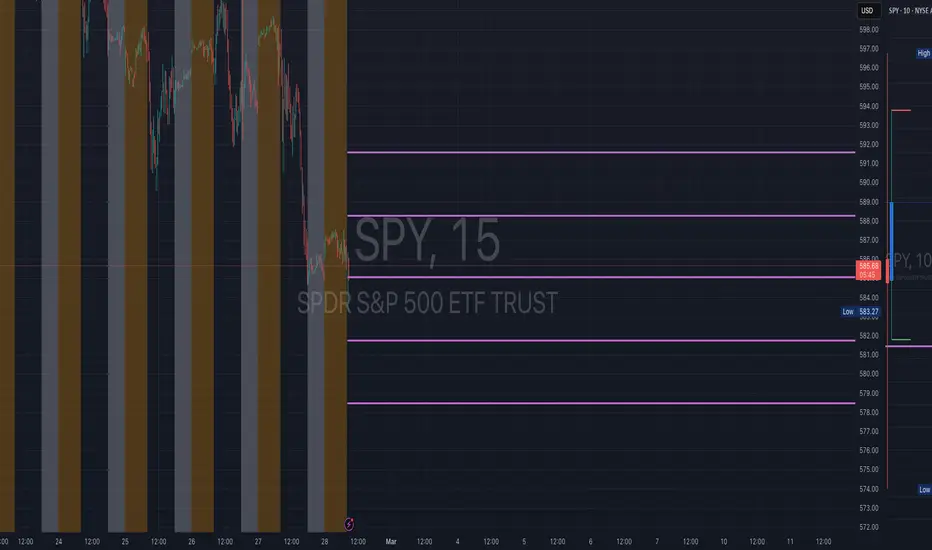
SPY - support & resistant areas for today Feb 28, 2025Here are the key support and resistance levels for SPY today, indicating potential reversal or consolidation points. A bounce off these levels may signal long (buy) or short (sell) positions.
These levels are calculated using mathematical models relevant for today's trading session. They may change in the future.
If you find this helpful and want daily insights at 9:30 AM, please boost this post and follow me. Your engagement supports continued updates. Thank you!
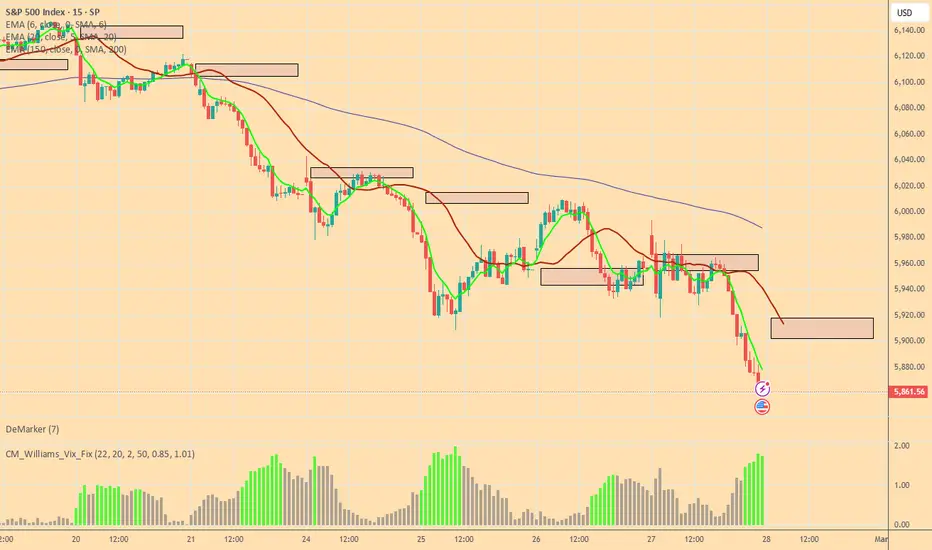
Bulls and Bears zone for 02-28-2025We had six down days in a row which we have not seen in a while. S&P is probably testing January Lows.
Level to watch: 5888 --- 5886
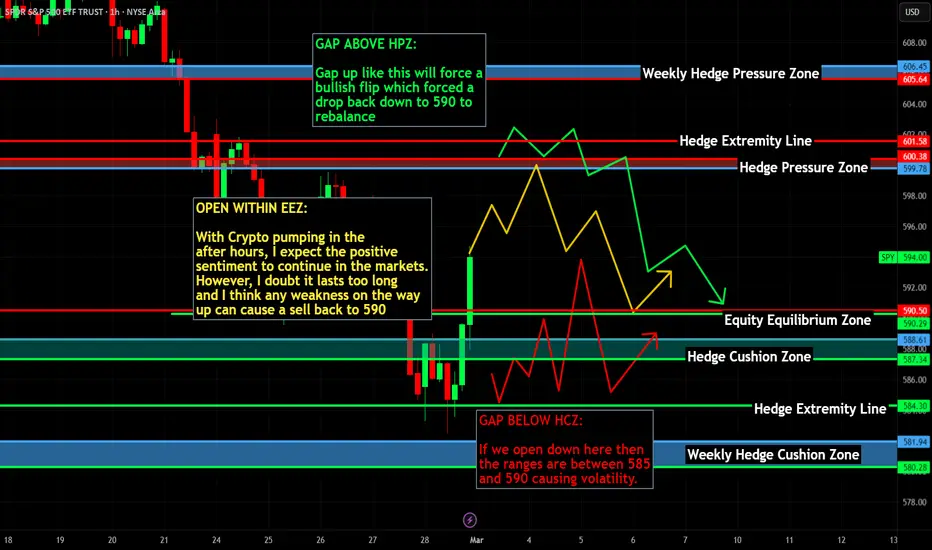
SPY/QQQ Plan your Trade For 2-28 : Gap Up - LowerToday's pattern suggests the markets will open with a slight GAP UP (higher), then transition into a downward price trend throughout the rest of the day.
After yesterday's deep selling, I suspect there may be a bit more of an uptrend in early trading.
The 584-585 level on the SPY was hit. That was my original projected downside target for the Feb 21-24 breakdown in price.
We've also seen Bitcoin collapse a little over 25%.
I believe this deep selling in Bitcoin prompted a "sell-everything" type of breakdown in the SPY/QQQ and other assets (gold/silver).
Once this move subsides/bases, I believe we'll see 2-3 days of basing/bottoming, then a reasonably strong reversion rally in the SPY/QQQ as the sell-everything fear settles.
This would be a good time to look for initial "anchor" positions in certain assets related to a moderate recovery rally between now and March 11-14 - maybe a bit later.
Overall, we are moving solidly into my expanding megaphone pattern and should continue to see increased price volatility.
The next phase of the market trends is a moderate recovery rally. Then, as we approach the March 21-24 breakdown phase, we will see more selling.
Get ready for a base/bottom setup. Then, we'll see the price move into a recovery phase, and the SPY may target 600 to 604 before topping again.
Get some.
#trading #research #investing #tradingalgos #tradingsignals #cycles #fibonacci #elliotwave #modelingsystems #stocks #bitcoin #btcusd #cryptos #spy #es #nq #gold

Nightly $SPY / $SPX Scenarios for 2.28.2025 🔮 🔮
🌍 Market-Moving News 🌍:
🇺🇸📈 PCE Inflation Data Release 📈: The Federal Reserve's preferred inflation measure, the Personal Consumption Expenditures (PCE) Price Index, is set to be released. Economists predict a 0.3% rise in January and a 2.5% year-over-year growth. This data will provide insights into inflation trends and potential monetary policy adjustments.
🇺🇸🛒 Consumer Spending Trends 🛒: Personal income and spending data for January will be released, offering a glimpse into consumer behavior amid ongoing economic uncertainties. Analysts anticipate a 0.4% increase in personal income and a 0.1% rise in personal spending.
📊 Key Data Releases 📊:
📅 Friday, Feb 28:
💰 Personal Income and Outlays (8:30 AM ET) 💰: Reports on personal income, consumer spending, and the PCE Price Index for January.
🏠 Pending Home Sales Index (10:00 AM ET) 🏠: Measures housing contract activity, providing insights into the real estate market's health.
📌 #trading #stockmarket #tomorrow #news #trendtao #charting #technicalanalysis

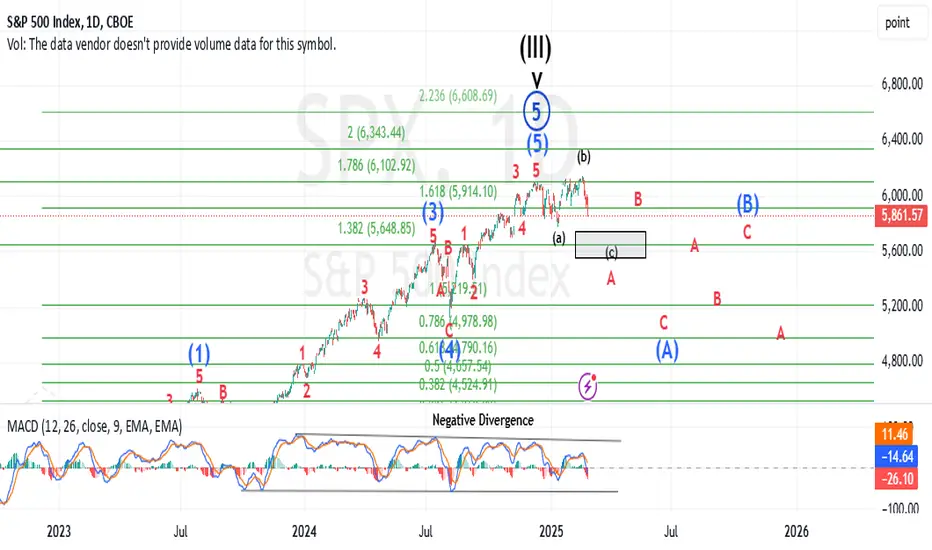
Getting CloserLately the market has been confusing. It appears traders are not clear minded on the economy, the recently voted in administration's policies, and that uncertainty is definitely showing up in the price action.
Be that as it may be, this is an update on the SPX cash index I posted last week as more of the price action fills in. I'll try to update this weekly.
Best to all,
Chris