WIPRO 1D Time frame📊 Wipro Daily Snapshot
Current Price: ₹256.50
Change: Up 2.97% from the previous close
Volume: 804,499 shares traded, significantly higher than the 50-day average of 369,496
MarketWatch
🔎 Key Levels
Resistance: ₹253.70 (short-term)
Support: ₹239.55 (short-term)
52-Week High: ₹324.55 (January 23, 2025)
52-Week Low: ₹239.55 (recent support level)
📈 Technical Indicators
RSI (14): Approximately 75 — indicates overbought conditions
MACD: Positive — suggests upward momentum
Moving Averages: Trading above 5-day (₹255.97), 50-day (₹248.47), and 200-day (₹247.12) SMAs — bullish trend
Stochastic Oscillator: Indicates overbought conditions
ADX: Approximately 17.49 — suggests a weak trend strength
Top Stock Research
📌 Market Sentiment
Catalysts: Positive market sentiment, with Wipro outperforming key competitors like HCL Technologies and Tata Consultancy Services in recent sessions
MarketWatch
Sector Performance: IT sector showing strength, with Wipro leading gains among peers
📅 Outlook
Bullish Scenario: Sustained trading above ₹253.70 could lead to a push toward ₹277.65 (long-term resistance)
Bearish Scenario: A drop below ₹239.55 may test support around ₹234.20 (mid-term support)
Spy!

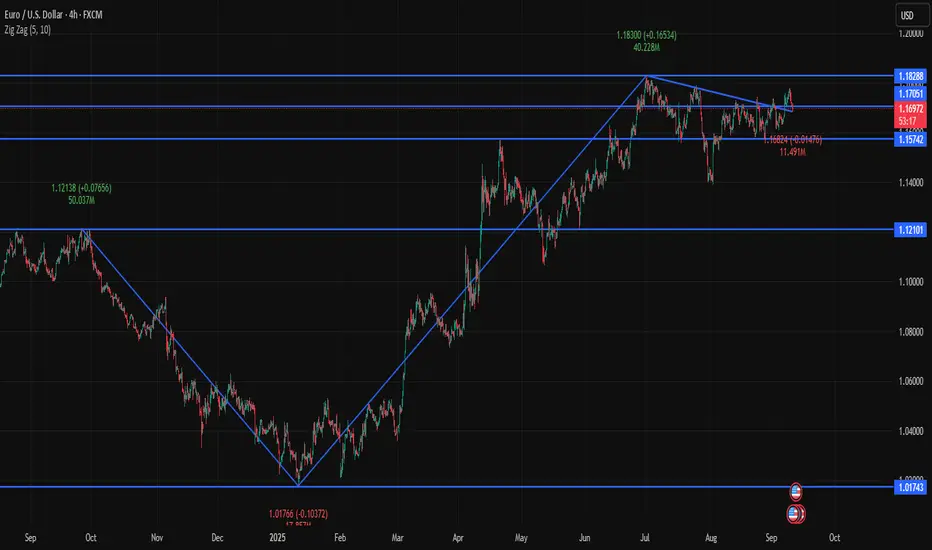
EURUSD 4Hour Time frame📊 EUR/USD Snapshot
Current Price: ~1.1706
Recent Range: ~1.1685 – 1.1739
Intraday Change: Slightly negative (~-0.03%)
🔎 Key Levels (4H Focus)
Pivot Point: ~1.1702
Resistance:
R1: ~1.1712
R2: ~1.1729
R3: ~1.1739
Support:
S1: ~1.1685
S2: ~1.1675
S3: ~1.1658
📉 Technical Indicators
RSI: Neutral (~50) → no overbought/oversold condition.
MACD: Slightly positive → mild bullish momentum.
Moving Averages: Price is holding above the 20-period SMA (~1.1710), which acts as short-term support.
📌 4-Hour Outlook
Bullish Scenario: If EUR/USD stays above 1.1700–1.1710, it may push toward 1.1780 and higher levels like 1.1825–1.1850.
Bearish Scenario: If it drops below 1.1700, short-term weakness could test 1.1685 → 1.1675.
Bias: Moderately bullish, but momentum depends on breaking above 1.1780.
✅ Conclusion: On the 4-hour chart, EUR/USD is holding a cautious bullish tone, supported by short-term moving averages. The key battleground is around 1.1700 support and 1.1780 resistance — whichever side breaks first will guide the next move.
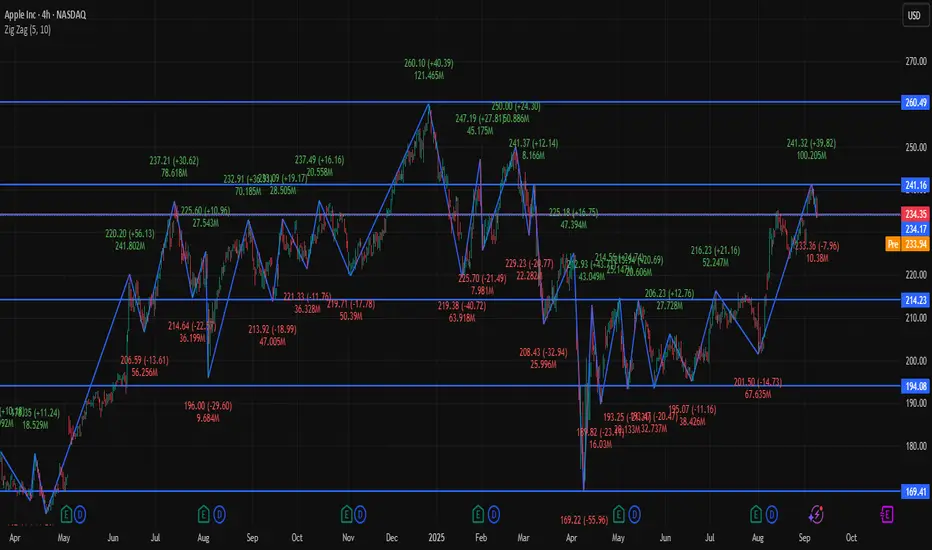
AAPL 4Hour Time frame📊 Apple (AAPL) Snapshot
Current Price: ~$234.35
Day Range: $233.01 – $238.66
Open Price: ~$236.73
Market Cap: ~$3.0 Trillion
P/E Ratio: ~30.3
EPS: ~6.59
🔎 Pivot Levels (Daily Basis → useful for 4H)
Pivot Point: ~$234.6
Resistance:
R1: ~$235.9
R2: ~$238.0
R3: ~$239.2
Support:
S1: ~$232.5
S2: ~$231.3
S3: ~$229.1
📉 Technical Indicators (4-Hour Insight)
RSI: ~40 → weak, leaning bearish.
MACD: Negative → bearish momentum.
Moving Averages: Short-term averages show Sell, long-term still supportive (Buy).
📌 4-Hour Frame Outlook
Momentum: Neutral-to-bearish; price is consolidating around the pivot zone ($234–235).
Bullish Scenario: If AAPL breaks above $238, short-term upside could open toward $239+.
Bearish Scenario: If price slips below $232, risk increases for a move toward $230.
✅ Conclusion: On the 4-hour chart, Apple is in a neutral to bearish phase, with weak momentum. Bulls need a breakout above $238 to take control, while bears may dominate if it breaks under $232.
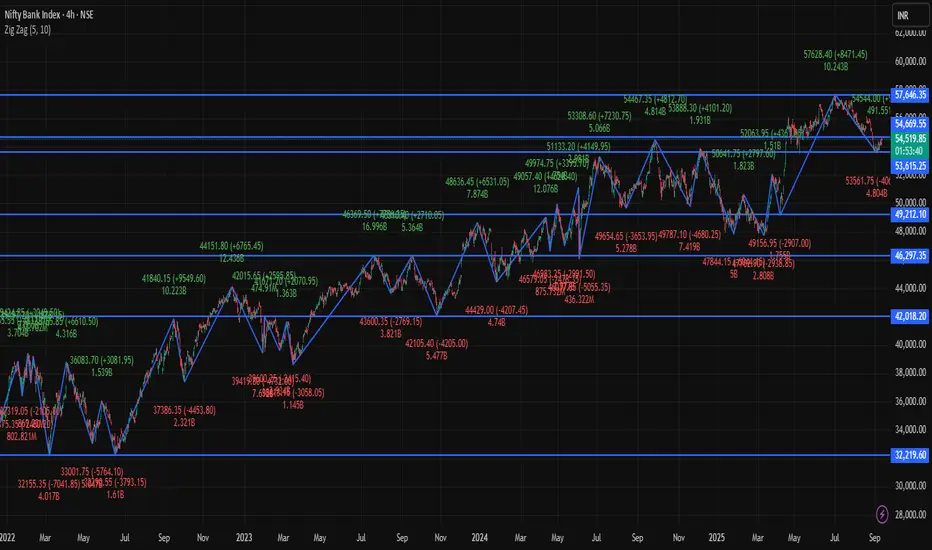
BANKNIFTY 4Hour Time frame Bank Nifty Snapshot (10 Sept 2025 – 4-Hour Chart)
Current Level: Around 54,550 – 54,650
Intraday Change: Up about +330 to +440 points (~+0.7%)
Trend: Bullish, price holding near highs
Key Pivot Levels (Daily Basis – useful on 4H)
Pivot Point: 54,352
Resistance Levels:
R1: 54,487
R2: 54,623
R3: 54,759
Support Levels:
S1: 54,215
S2: 54,080
S3: 53,944
Technical View (4-Hour Frame)
Momentum: Price is trading above R2 (54,623) → shows strong bullish bias.
Indicators: RSI near 65–70 (bullish), MACD positive, moving averages aligned upward.
Bias:
Sustaining above 54,623 → next upside toward 54,759 and beyond.
If it falls back below Pivot (54,352) → downside risk toward 54,215 or 54,080.
✅ Conclusion: On the 4-hour timeframe, Bank Nifty is bullish, trading above major resistance zones. If strength holds, higher levels are possible, but profit-booking can trigger quick pullbacks toward support.
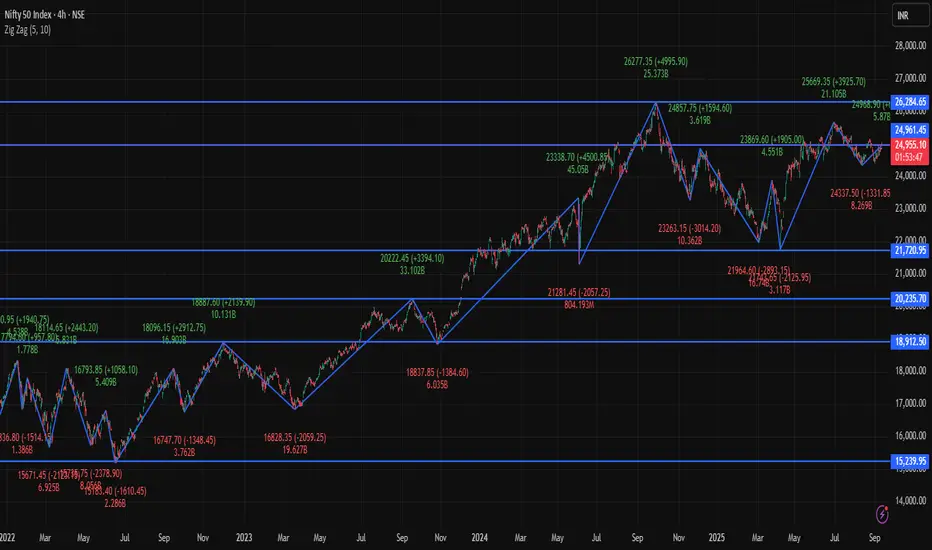
NIFTY 4Hour Time frameNifty Snapshot (10 Sept 2025 – 4-Hour Chart)
Current Level: Around 24,990 – 25,000
Intraday Change: Up about +120 to +130 points (~+0.5%)
Trend: Bullish, with price sustaining near highs
Key Pivot Levels (Daily basis, useful for 4-Hour chart)
Pivot Point: 24,858
Resistance Levels:
R1: 24,902
R2: 24,936
R3: 24,980
Support Levels:
S1: 24,824
S2: 24,780
S3: 24,747
Technical View (4-Hour Frame)
Momentum: Nifty is trading above R3 (24,980), showing strong bullish momentum.
Indicators: RSI is in bullish territory (~65–70), MACD remains positive, and moving averages favor upside.
Bias:
Sustaining above 25,000 can lead to further upside, possibly extending gains.
If Nifty slips back below 24,980, it may retest R2 (24,936) or R1 (24,902).
✅ Conclusion: On the 4-hour timeframe, Nifty remains bullish, currently holding above its resistance zone. This suggests strong intraday and short-term strength, though some consolidation is possible around the 25,000 mark.
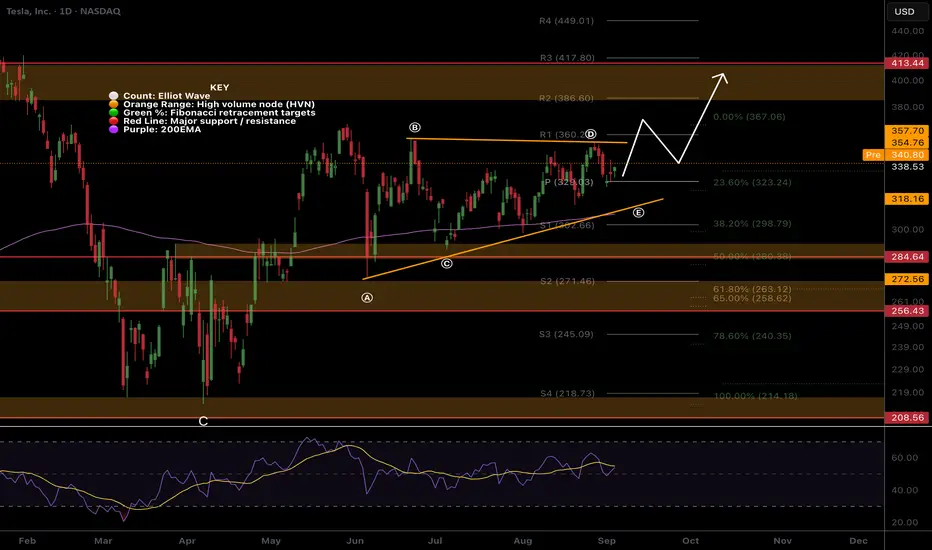
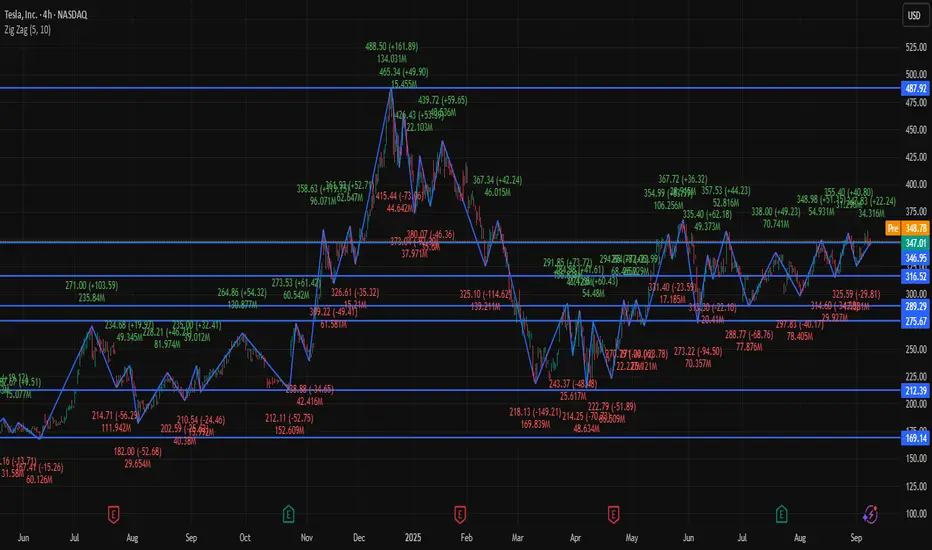
TSLA 4Hour Time frame 📊 Tesla (TSLA) Snapshot
Current Price: ~$346.97
Recent Range: ~$325 – $358
Intraday Change: Small gain (~+0.2%)
🔎 Key Levels (4H Focus)
Resistance: ~$347 – $351 (immediate ceiling)
Support: ~$325 – $330 (key downside buffer)
📉 Technical Indicators
RSI (14): ~57 → neutral with slight bullish bias
MACD: Positive → upward momentum
Moving Averages: Price trading above 20, 50, 200-period moving averages → bullish trend
Stochastics: Neutral → no overbought/oversold condition
📌 4-Hour Outlook
Bullish Scenario: Break above $347–348 could push price toward $358+.
Bearish Scenario: Drop below $330–332 could test support around $325.
Overall Bias: Moderately bullish; momentum positive but needs to clear resistance for acceleration.
✅ Conclusion: On the 4-hour chart, TSLA is in a moderate bullish phase, trading above key moving averages. The key battle zone is $347–351 for resistance, and $325–330 provides support in case of a pullback.
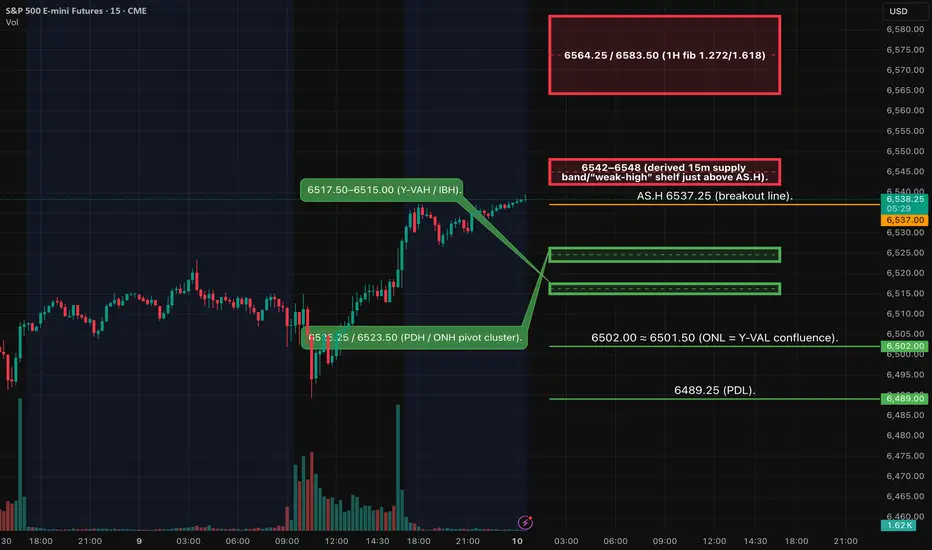
ES1! — Analyses (Sep 10) - Key Zones SeyupsHTF remains bullish into a labeled weak‑high cluster. Tomorrow’s path likely pivots around 6523–6527 (ONH/PDH cluster). Two A++ plays only after event‑led volatility prints structure:
Two possibilities:
Continuation LONG on acceptance > 6537 → 6564/6583.
Fade SHORT on sweep into 6542–6548 + 5m and 15m bearish confirmation → 6526/6510/6502.
SMT check with NQ is required.
Continuation LONG (A++) — “Acceptance > 6537”
Sweep → 5m MSS up → 5m close above 6537 → retest 6531–6533 (derived 5m OB/FVG at prior close shelf) for entry.
Entry: 6532 ±1.
SL: 6524 (structure; back inside PDH/ONH cluster).
• TP1: 6564.25 (1H 1.272) → ~+32.3 pts ≈ 4.0R.
• TP2: 6583.50 (1H 1.618) → ~+51.5 pts ≈ 6.4R.
• TP3: 6668+ (4H fib region) — runner; trail by 15m/30m closes.
Management: Scale ½ at TP1; move to BE only after a 5m close through TP1 or new structure; time‑stop 45–60 min if no progress in a kill zone.
Fade SHORT (A++) — “Sweep 6542–6548”
This is counter‑HTF; require 5m MSS down + 15m bearish close before entry (your rule).
Entry: 6545 ±2 after confirmations.
SL: 6552 (above sweep high/5m OB).
• TP1: 6526.25 (PDH/ONH) → ~19 pts ≈ 2.7R.
• TP2: 6510 (derived 15m demand near VWAP band) → ~35 pts ≈ 5.0R.
• TP3: 6502 (ONL=VAL) → ~43 pts ≈ 6.1R.
• TP4: 6489.25 (PDL) → ~56 pts ≈ 8.0R.
Management: Scale ½ at TP1; move to BE only after a 5m close < 6526 and fresh LTF structure; trail above last 5m swing/VWAP.
Fundamentals (tomorrow — Eastern Time)
• 08:30 — PPI (Aug). BLS schedule confirms Sep 10 @ 08:30.
• 10:30 — EIA Weekly Petroleum Status (energy vol shock risk). Standard release Wednesdays 10:30; PDF posts after 1:00 pm.
• 13:00 — UST 10‑yr (reopening). Treasury’s tentative auction schedule shows Wed Sep 10; competitive close customarily 1:00 pm ET.
• Heads‑up (Thu): 08:30 — CPI (Aug) next day.
• FOMC next week: Sep 16–17.
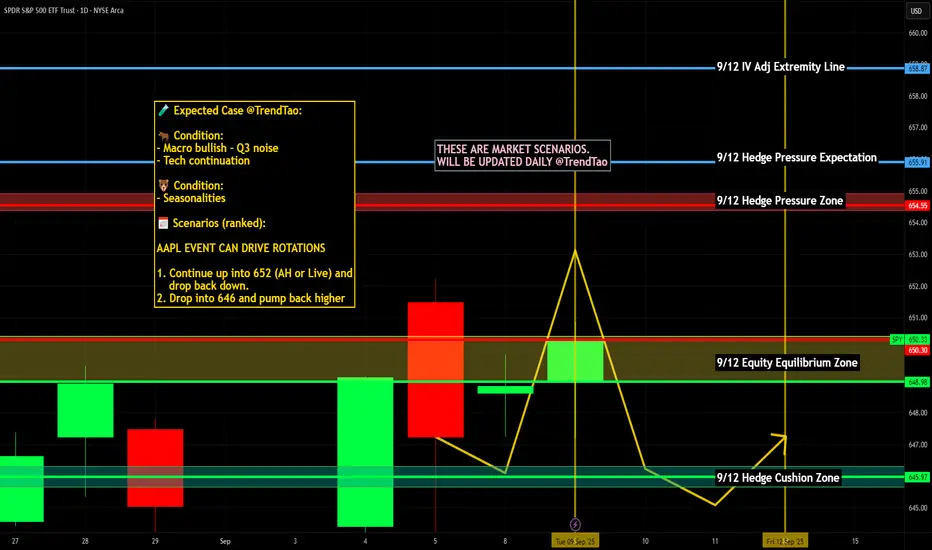
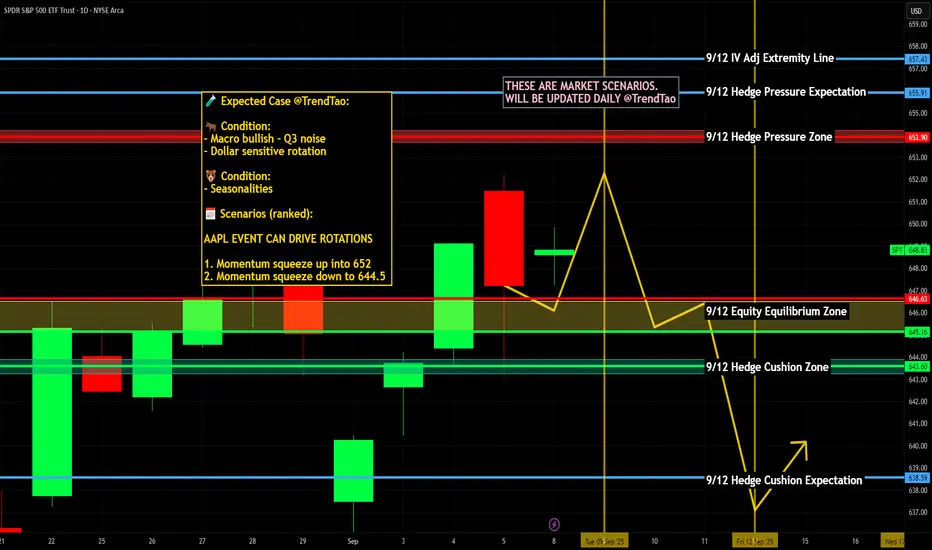
$SPY / $SPX Scenarios — Wednesday, Sept 10, 2025🔮 AMEX:SPY / SP:SPX Scenarios — Wednesday, Sept 10, 2025 🔮
🌍 Market-Moving Headlines
🚩 PPI Hits: August Producer Price Index at 8:30 AM — critical input for inflation trend into CPI (Thu).
📈 Yields in focus: Bond market watching supply + inflation mix; $TLT/ TVC:TNX extra sensitive.
💬 Fed chatter: Post-Apple event, markets shift back to Fed data dependency into next week’s FOMC.
📊 Key Data & Events (ET)
⏰ 🚩 8:30 AM — Producer Price Index (PPI, Aug)
⏰ 7:00 AM — MBA Mortgage Applications (weekly)
⏰ 10:30 AM — EIA Petroleum Status Report
⚠️ Disclaimer: Educational/informational only — not financial advice.
📌 #trading #stockmarket #SPY #SPX #PPI #inflation #Fed #bonds #energy #economy
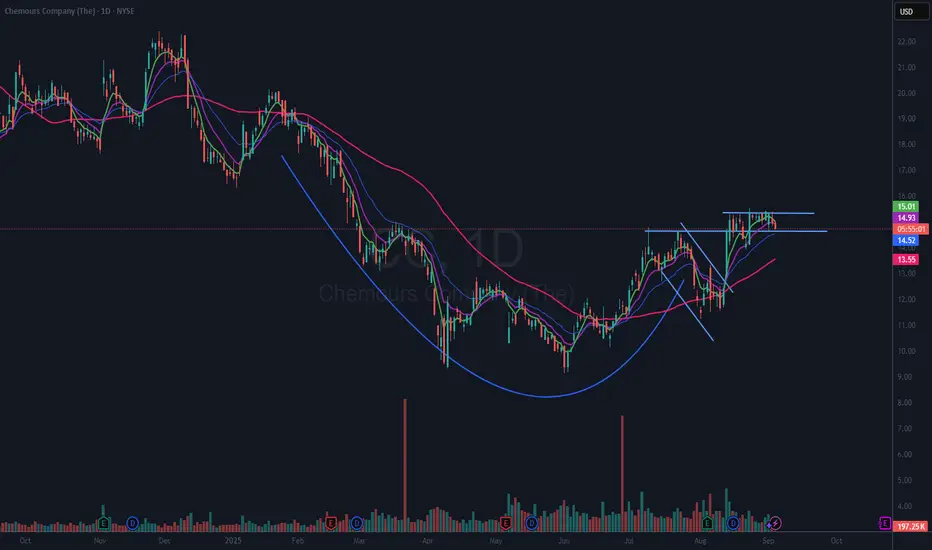
$CC Cup with Handle Base?NYSE:CC appears to have built a Cup with a Handle Base and is now forming an additional flat base. I have set an alert at the upper horizontal line to trigger a new breakout. TBD.
On a fundamental basis, they reported better-than-expected earnings on August 5th, with an earnings surprise of 26% and earnings growth of 53%.
If you like this idea, please make it your own by following YOUR trading plan. Remember, it is your money at risk.
From EarningsWhispers
Chemours Beat Consensus Estimates
Tuesday, August 5, 2025 at 4:56 PM ET
Chemours (CC) reported earnings of $0.58 per share on revenue of $1.62 billion for the second quarter ended June 2025. The consensus earnings estimate was $0.46 per share on revenue of $1.57 billion. The company beat consensus estimates by 26.09% while revenue grew 5.01% on a year-over-year basis.
The company said it expects 2025 revenue of $5.90 billion to $6.00 billion. The current consensus revenue estimate is $5.86 billion for the year ending December 31, 2025.
The Chemours Company is a global leader in Titanium Technologies, Thermal & Specialized Solutions, Advanced Performance Materials, and Chemical Solutions providing its customers with solutions in a wide range of industries with market-defining products, application expertise and chemistry-based innovations.
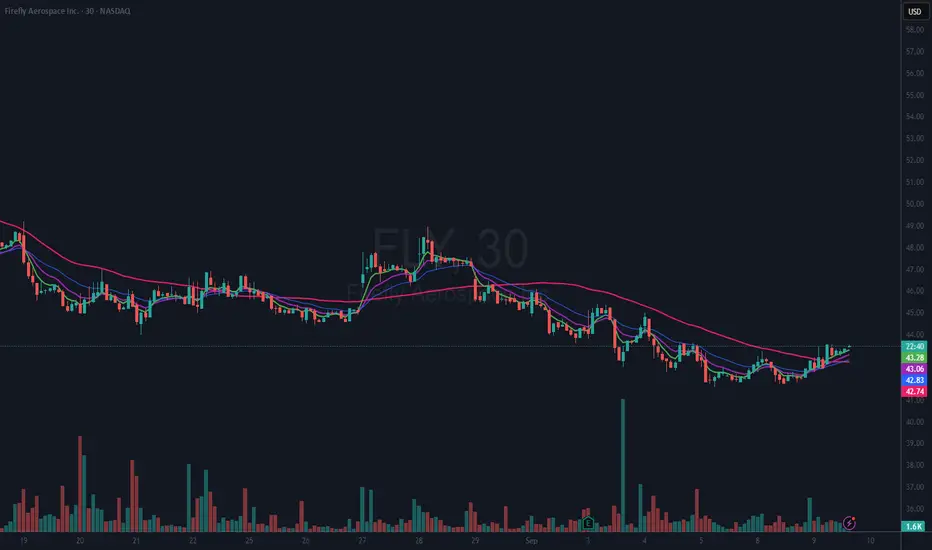
$FLY Basing Opportunity?Overview
A recent initial public offering (IPO), NASDAQ:FLY , may be of interest for those looking to update their watchlist. The company operates in the Space and Defense sector, which adds to its appeal.
Technical Analysis
The 30-minute chart for NASDAQ:FLY appears to show a shorter-term basing pattern. This technical setup suggests the potential for future upward movement, making the stock worth monitoring closely.
Investment Position
I currently hold a long position in $FLY. My stop-loss is set just below the lowest low, allowing for risk management while remaining positioned for possible gains.
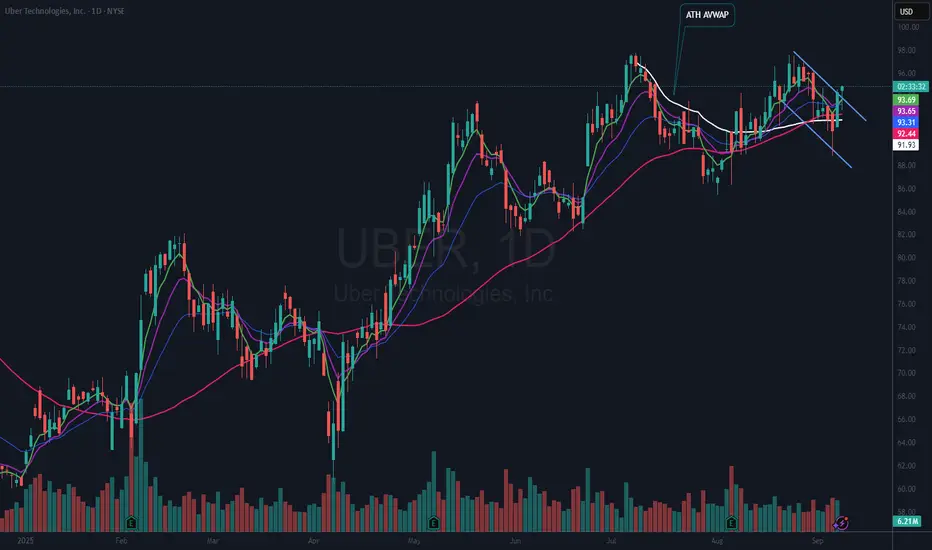
$UBER Technical Analysis: Bullish Momentum ObservedOverview
NYSE:UBER appears to be demonstrating significant bullish activity, as evidenced by a strong follow-through day. The price action is currently breaking above what seems to be a Bull Flag pattern, which is typically considered a continuation signal in technical analysis.
Technical Indicators
• Price is trading above all major moving averages, which supports the bullish outlook.
• NYSE:UBER is also above the All Time High AVWAP (Anchored Volume Weighted Average Price), indicating strong momentum.
Alternative Patterns
While the primary observation is a breakout from a Bull Flag, there is also a possibility that the current rally could be developing from a double top formation. However, confirmation of this pattern would only be possible after further price action is observed.
Positioning and Risk Management
Given the bullish chart setup, a half-size position has been initiated. The stop-loss is set to trigger on a close below the 50-day moving average (red), providing a disciplined approach to risk management.
Trading Reminder
As always, if this idea resonates with you, consider adapting it to your own trading plan. Remember, trading decisions should be guided by your personal strategy and risk tolerance, as your money is at stake.
$SPY / $SPX Scenarios — Tuesday, Sept 9, 2025🔮 AMEX:SPY / SP:SPX Scenarios — Tuesday, Sept 9, 2025 🔮
🌍 Market-Moving Headlines
🚩 Small Biz Pulse: NFIB report before the open — insight into hiring & inflation expectations.
🍏 Apple Mega-Cap Event: 1 PM ET — expected iPhone 17 lineup, Apple Watch, AirPods updates. Mega-cap headline risk for NASDAQ:AAPL and $XLK.
📉 Tape Watch: Traders positioning ahead of 🚩 PPI (Wed) and 🚩 CPI (Thu).
📊 Key Data & Events (ET)
⏰ 🚩 6:00 AM — NFIB Small Business Optimism (Aug)
⏰ 10:00 AM — Wholesale Inventories (Jul, rev.)
⏰ 🍏 1:00 PM — Apple Product Launch Event
⚠️ Disclaimer: Educational/informational only — not financial advice.
📌 #trading #stockmarket #SPY #SPX #AAPL #AppleEvent #NFIB #inflation #tech #MegaCap
3000 Percent Gain on This Stock!OCTO had a massive mump today on the back of BMNR & Tom Lee getting involved.
This company went from zero to basically hero....caution buying this hype.
OPEN saw a negative bearish reversal from the highs. Likely giving a near term top.
Lulu went from red to green - daily bottoming tail.
Our markets continue to show casino tendencies.

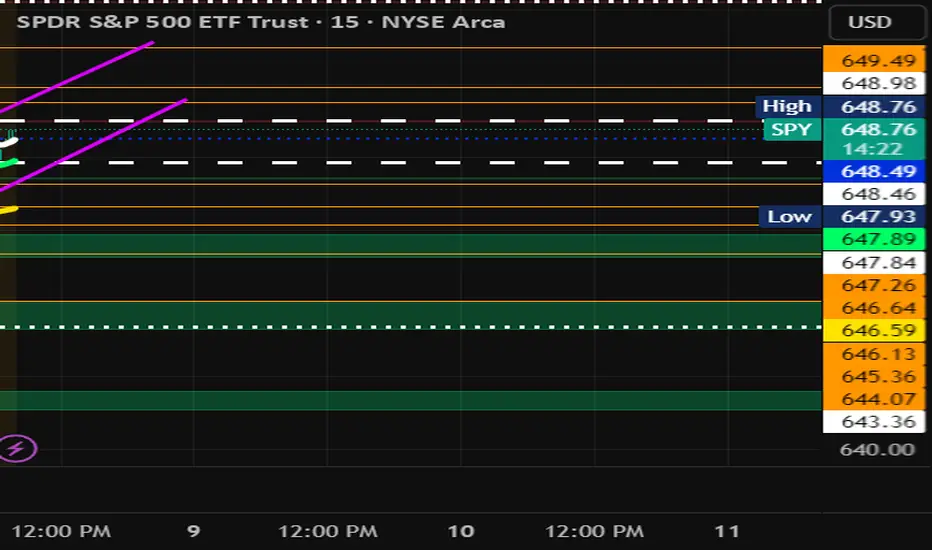
SPY Play 9/8/25Look for break of PMH and hold for CALLS and Break of PML for PUTS. It is also in a channel which provides more confirmation if it breaks either side. It appear to be forming a Bear Flag on the 15 min. So be cautious and wait first 15-30 mins. If PUTS look for SPY to come down to 646.17 if it breaks and hold that with volume SPY maybe headed to 643 territory. But in all things do your due diligence and be patient. Let the trade prove to you which direction. the range as of now is 647.84-648.98 - no trade between this range. If it decides to do calls look for 649.49-9 as first TP and if it go pass that look to recapture PDH. Let's Go. #YouGotOptions
“Discipline in trading is doing what your plan says even when your emotions scream otherwise. Consistency beats impulse every time.”
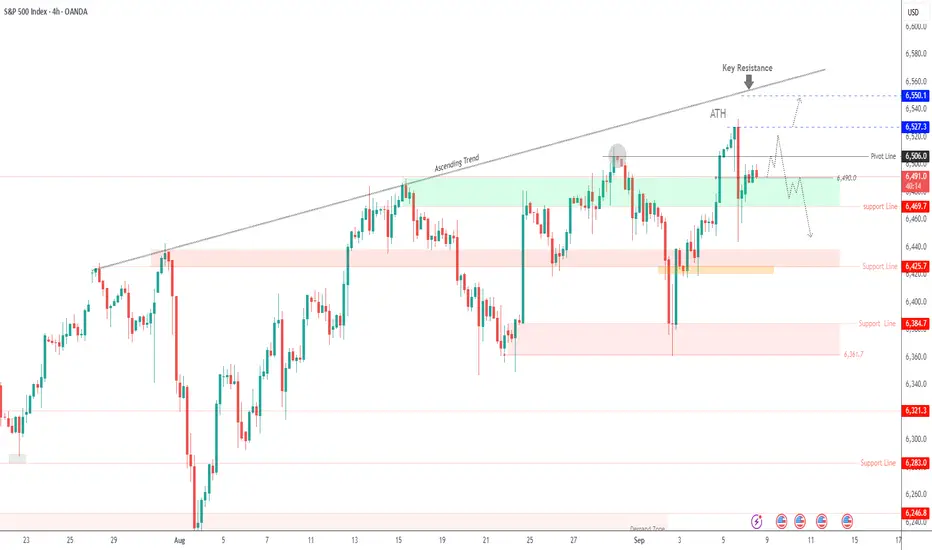
SPX500 Awaits Breakout – Key Levels 6,506 & 6,486SPX500 – Overview
The S&P 500 is holding above the 6,490 pivot, with short-term momentum favoring a retest of 6,506.
Technical Outlook:
📈 Bullish scenario: While above 6,490, price is expected to test 6,506. A confirmed breakout above this level would extend upside toward 6,527 → 6,550.
📉 Bearish scenario: A confirmed 1H close below 6,486 would open the way to 6,469, with further downside toward 6,425 if that level breaks.
Key Levels:
Pivot: 6,490
Resistance: 6,506 – 6,527 – 6,550
Support: 6,469 – 6,453 – 6,425
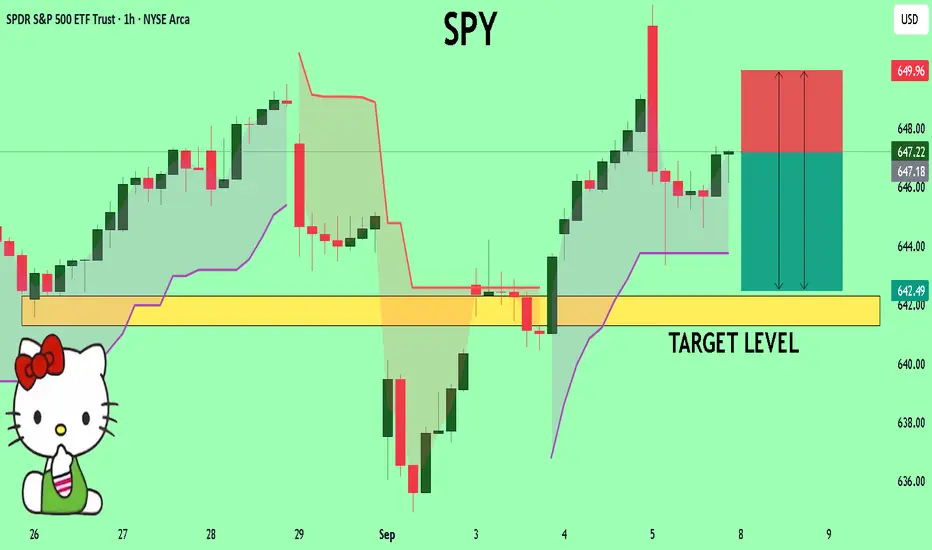
SPY A Fall Expected! SELL!
My dear friends,
Please, find my technical outlook for SPY below:
The instrument tests an important psychological level 647.22
Bias - Bearish
Technical Indicators: Supper Trend gives a precise Bearish signal, while Pivot Point HL predicts price changes and potential reversals in the market.
Target - 642.31
Recommended Stop Loss - 649.96
About Used Indicators:
Super-trend indicator is more useful in trending markets where there are clear uptrends and downtrends in price.
Disclosure: I am part of Trade Nation's Influencer program and receive a monthly fee for using their TradingView charts in my analysis.
———————————
WISH YOU ALL LUCK
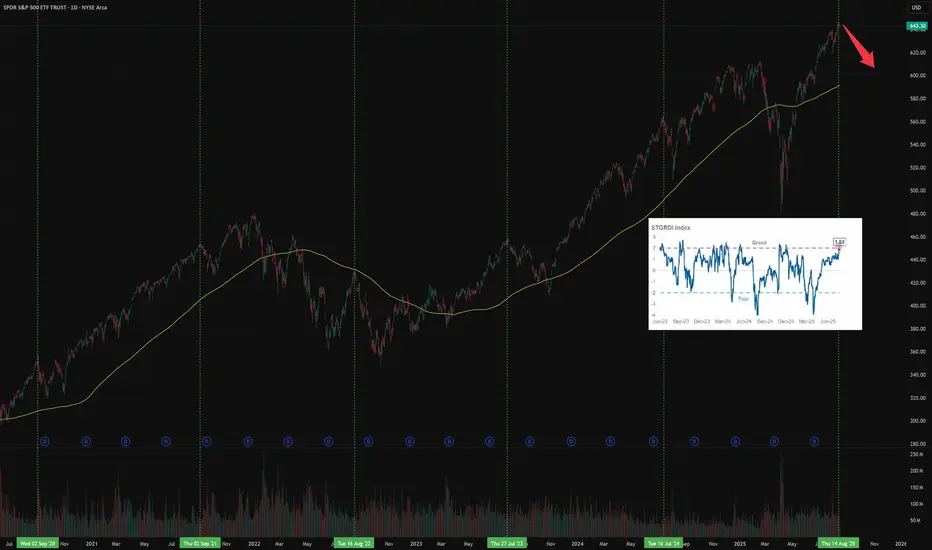
Stock Market is in Risk OnSubscribe and don't miss next ideas
The US market, as well as some assets, is in a risk-on mode.
Most assets have their own seasonality.
The chart above shows one of them:
In recent years, in the period July-September, a correction began on the US market.
A number of macro indicators also speak in favor of a correction and that it is overdue.
Risk appetite according to Morgan Stanley research has reached a historical maximum
Although seasonality does not guarantee a correction right here and now, but at least it gives reason to think about reducing long positions
Will Bears Follow Through after Terrible Job Numbers?QQQ CME_MINI:NQ1! CME_MINI:ES1! stock market Forecast
Nvidia Stock NASDAQ:NVDA Forecast
Apple Stock AAPL Forecast
Microsoft Stock MSFT Forecast
Google Stock GOOGL Forecast
Amazon Stock AMZN Forecast
Meta Forecast Technical Analysis
Tesla Stock NASDAQ:TSLA Forecast
Magnificent 7 stocks forecast

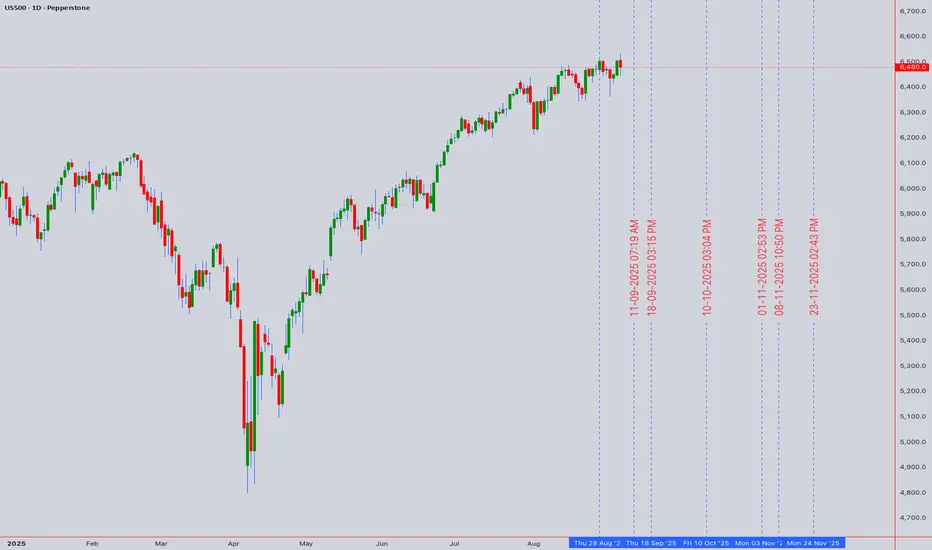
S&P 500 At Critical Juncture - 6,500 Breakout or Major RejectionUS500 Technical Analysis: 🎯 At Critical Juncture - 6,500 Breakout or Major Rejection? ⚖️
Asset: US500 (S&P 500 CFD)
Analysis Date: September 5, 2025
Current Closing Price: 6,480.0 (as of 12:59 AM UTC+4)
Timeframes Analyzed: 1H, 4H, D, W
Executive Summary & Market Outlook 🧐
The US500 is knocking on the door of a historic milestone, trading within striking distance of the 6,500 level. 🚪 This represents a massive psychological and technical barrier. The index is in a strong bullish trend but is displaying classic signs of short-term exhaustion and overextension. The price action here is critical: a decisive breakout could unleash a new wave of buying towards 6,600+, while a rejection could trigger the most significant pullback in weeks. This analysis provides a clear roadmap for intraday traders 🎯 and swing traders 📈 navigating this pivotal moment.
Multi-Timeframe Technical Analysis 🔍
1. Trend Analysis (Daily & 4-Hour Chart):
Primary Trend: 🟢 Bullish. Price is well above all major Daily Moving Averages, which are sloping upwards in bullish alignment.
Short-Term Trend: 🟡 Bullish but Fragile. The rally has been relentless, leaving the price extended and vulnerable to a sharp, news-driven correction.
2. Key Chart Patterns & Theories:
Ascending Wedge / Bull Flag? 🤔: The recent consolidation near the highs could be interpreted as a small bull flag (pausing before breakout) or the end of an ascending wedge (bearish reversal). The next major candle will likely resolve this.
Elliott Wave Theory 🌊: The rally from the last major low is a clear five-wave impulse. We are likely in the final stages of Wave 5. This suggests the completion of a cycle and warns that a larger corrective phase (Wave 4 or A-B-C) is the next probable move. A typical retracement target is the 38.2% Fibonacci level of the entire Wave 3 move.
Ichimoku Cloud (H4/D1) ☁️: Price is trading far above the Cloud on daily charts, confirming the strong bullish trend. However, this also signals a significant over-extension from mean support, increasing mean reversion risk.
Gann Theory ⏳: The 6,500 level is a key psychological and mathematical resistance. A decisive break and close above it could open the path to the next Gann angle target.
3. Critical Support & Resistance Levels:
Resistance (R1): 6,500 - 6,520 (Key Psychological & Technical Ceiling) 🚨
Resistance (R2): 6,600 (Projected Target)
Current Closing Price: ~6,480
Support (S1): 6,400 - 6,420 (Immediate Support & Prior Breakout Zone) ✅
Support (S2) : 6,300 - 6,320 (Major Support - 38.2% Fib & 21-day EMA) 🛡️
Support (S3): 6,200 (50-day EMA & 50% Fib Retracement)
4. Indicator Consensus:
RSI (14-period on 4H/D): Reading is between 68 and 72, signaling overbought conditions. 📛 This warns of weakening momentum and increased downside vulnerability. A bearish divergence on the 4H chart would be a strong short-term sell signal.
Bollinger Bands (4H) 📏: Price is hugging the upper band, a sign of strong momentum. A move back to the middle band (~6,400) would be a healthy and expected development.
Moving Averages: The bullish alignment (EMA8 > EMA21 > EMA50) is perfect. The EMA 21 on the 4H chart acts as dynamic support and is a key level for the bullish thesis.
Volume & VWAP : Volume has been inconsistent on the most recent push higher, a potential bearish divergence 📉 suggesting a lack of strong conviction from large players at these exact levels.
Trading Strategy & Forecast 🎯
A. Intraday Trading Strategy (5M - 1H Charts):
Bearish Scenario (Rejection Play) ⬇️: Given overbought conditions, this is a high-probability setup. Watch for bearish reversal candlestick patterns (e.g., Bearish Engulfing, Evening Star 🌟, Doji) at or near the 6,500 resistance.
Entry: On confirmation of rejection (e.g., a break below a 1H support low).
Stop Loss : Tight, above 6,520.
Target: 6,420 (TP1), 6,400 (TP2).
Bullish Scenario (Breakout Play) ⬆️: If buyers break through with force, wait for a pullback to the breakout level for a better entry.
Entry: On a re-test of 6,500 as new support.
Stop Loss: Below 6,480.
Target: 6,550 (TP1), 6,600 (TP2).
B. Swing Trading Strategy (4H - D Charts):
Strategy: PATIENCE IS KEY. The risk/reward for new long entries at this resistance is poor. 🚫
Ideal Long Zones: A pullback to 6,320 would be an optimal entry to add long positions for the next leg up in the primary bull trend. A shallower pullback to 6,400 could also offer an opportunity. ✅
Bearish Risk: A daily close below 6,300 would signal a deeper correction is underway, potentially targeting the 6,200 support zone.
Risk Management & Conclusion ⚠️
Key Risk Events: High-impact US data (CPI, PPI, NFP) and Fed commentary are paramount. 🔥 The market is highly sensitive to any hint of a shift in monetary policy.
Geopolitical events can also trigger flight-to-safety flows.
Position Sizing: Due to the potential for explosive volatility at this key level, conservative position sizing is non-negotiable. Risk no more than 1% of capital per trade.
Conclusion: The US500 is at a critical inflection point. ⚖️ The bullish trend is intact, but price is exhausted. This is a low-risk-taking zone. Swing traders should be patient for a better entry. Intraday traders can play the range between 6,400 and 6,500 until a decisive break occurs. The most probable outcome is a pullback to recharge before the next major directional move. 📊
Overall Bias: 🟢 Bullish above 6,320 | 🟡 Neutral/Bearish between 6,480-6,500
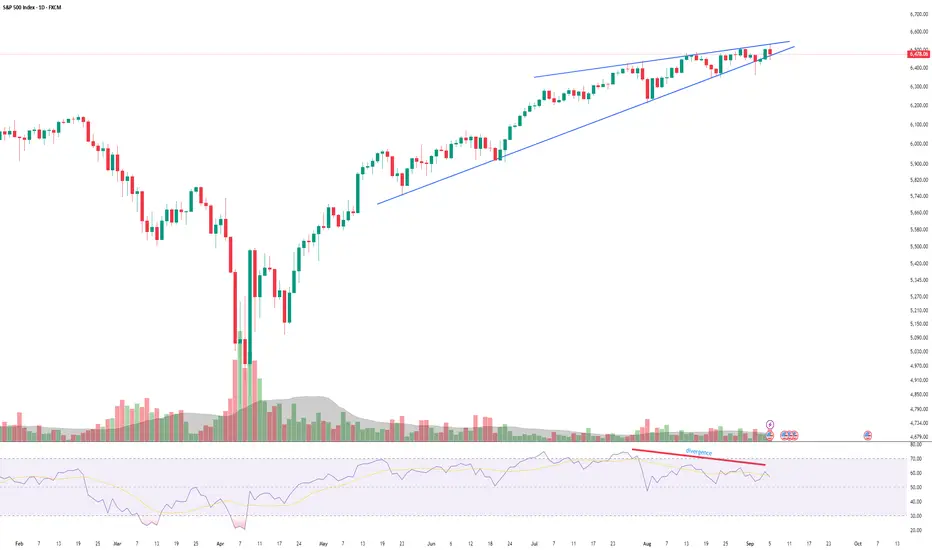
SPX at verge of breaking down?SP:SPX is treading dangerously in a bearish wedge formation with multiple bearish divergences in RSI.
A breakdown from here could send it around 6200 zone. And that might just be beginning of the fall everyone is waiting for, on account of excessive debt and inflation situation.
TESLA 5TH SEP 2025 PRICE ACTION Price action for Tesla is here. I have clearly explained my plan on how to trade tesla considering every factor in market.
NOTE: OPTION WILL BURN YOUR CAPITAL

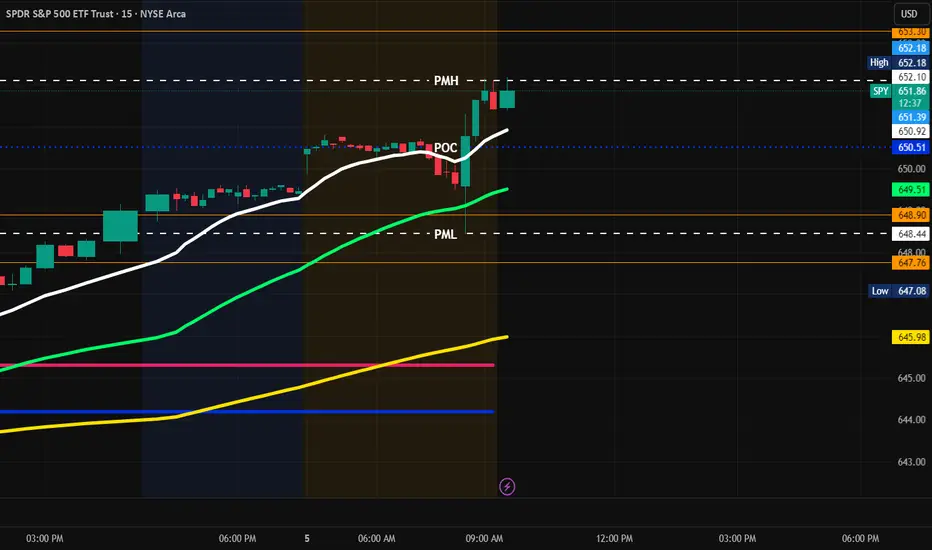
SPY Play 9/5/25After weak job report, Stock surge. SPY is in up. Be patient and allow the market to confirm it is still going higher. Don't guess - react. POI is at 650.51. You can wait until pullback to that and see if it holds for entry or use PMH. The range is 648.44-652.10. But if you wait the first 15 mins
PMH 652.10 Break-Retest and Hold = CALLS
PML 648.44 Break -Retest - Hold = PUTS
PDH 649.09
PDL 643.74
TP1 653.30
TP1 647.76
#YouGotOptions
"Discipline is the bridge between vision and victory. God gives the vision, but it's your daily obedience that builds the bridge."
TSLA Creeping up from original triangle, but still in a larger tNASDAQ:TSLA continues to take the stairs of worry up to my trading signal target from the original triangle analysis, $386, but the pattern has morphed into what appears to be a barrier triangle now as price struggles at $360 with a series of higher lows.
RSI is comfortable at the EQ with room to grow while price remains above the daily pivot.
Analysis is invalidated below wave (C) $284
Safe trading