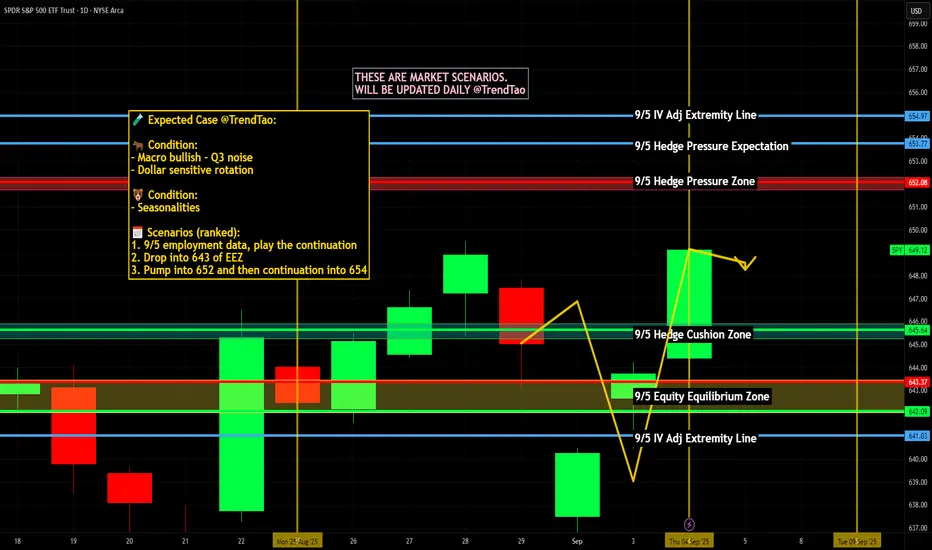
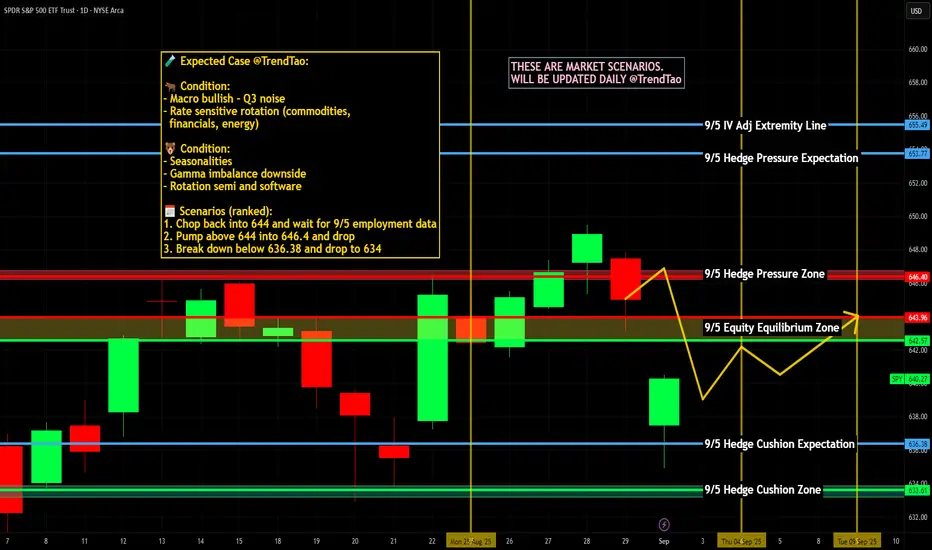
$SPY / $SPX Scenarios — Friday, Sept 5, 2025🔮 AMEX:SPY / SP:SPX Scenarios — Friday, Sept 5, 2025 🔮
🌍 Market-Moving Headlines
🚩 Jobs Friday = make or break. Nonfarm Payrolls, unemployment, and wages will lock in Fed expectations into September.
📉 Positioning light ahead of NFP — futures choppy as traders square books.
💬 Consumer sentiment wraps the week — expectations on inflation and spending will color the tape.
📊 Key Data & Events (ET)
⏰ 🚩 8:30 AM — Nonfarm Payrolls (Aug)
⏰ 🚩 8:30 AM — Unemployment Rate (Aug)
⏰ 🚩 8:30 AM — Average Hourly Earnings (Aug)
⏰ 10:00 AM — Wholesale Trade (Jul)
⏰ 10:00 AM — UMich Consumer Sentiment (Final, Aug)
⚠️ Disclaimer: Educational/informational only — not financial advice.
📌 #trading #stockmarket #SPY #SPX #NFP #jobs #labor #Fed #economy #bonds #Dollar
Spy!
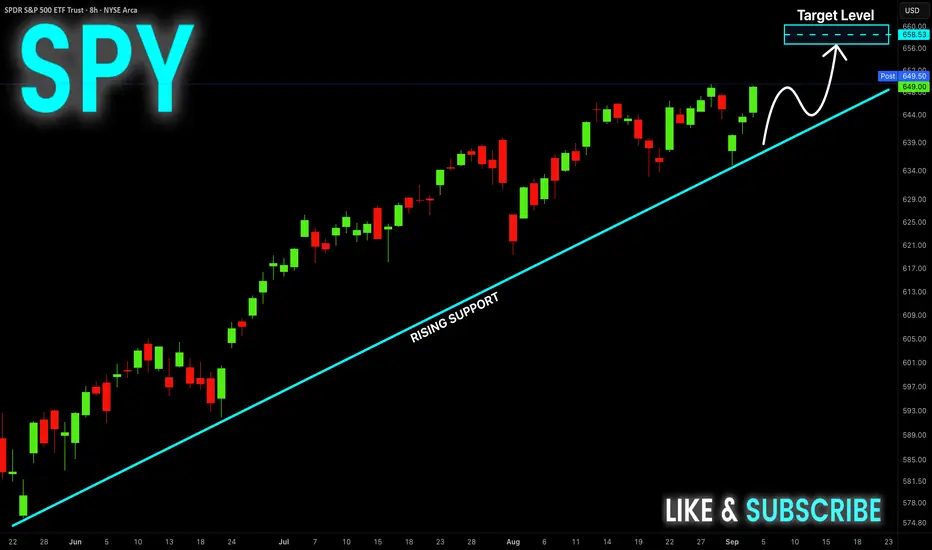
SPY Will Keep Growing! Buy!
Hello,Traders!
SPY is trading along the
Rising support line and
The index made a rebound
From the rising support
So we are bullish biased
And we will be expecting
A further bullish move up
Buy!
Comment and subscribe to help us grow!
Check out other forecasts below too!
Disclosure: I am part of Trade Nation's Influencer program and receive a monthly fee for using their TradingView charts in my analysis.
Stock Opportunity: LULULEMON & AVGO EARNINGSNASDAQ:LULU just reported earnings of $2.53B vs $2.54B est
They did beat on the EPS side $3.10 vs $2.85
Lululemon is now the second cheapest its ever been in its history on a PE basis. Behind the GFC crisis in 2008.
They have slashed their guidance and profit forecasts...which seem to be the final shakeout.
Lulu filled a massive weekly technical gap going back to Covid.
NASDAQ:AVGO reported earnings: Rev $15.95B vs $15.83B
EPS $1.69 vs $1.54
This institutional semiconductor stock is crushing Vol and staying flat-ish in afterhours.
We took a position in Lulu.

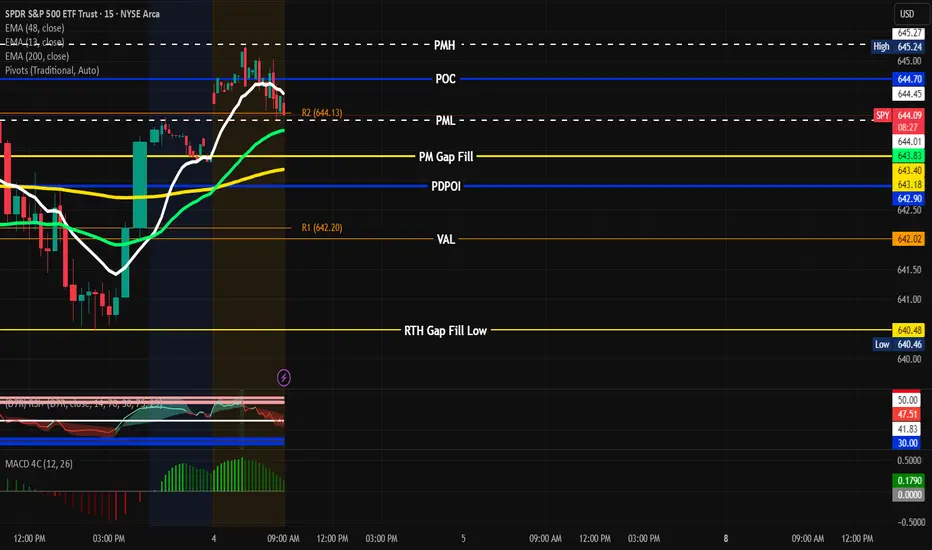
SPY setup 9/4/25PMH 645.27
PML 644.01
POI 645.24
PM Gap Fill 643.40
Range is between 6.43.17-645.27 Look for SPY to go back and retest PMH before coming back down to 644.70. If it breaks through look for it to go to PML 644.01 or Fill the Gap at 643.40. Wait for clear signs before hopping in. If it breaks, retest and hold PML look for PUTs to 642.90-642.20 T/P 1. If it breaks PMH and pullback and hold look to enter for CALL 646.10 T/P 1. You can also use the 9/13 EMA as entry. Use S/L and manage risk properly. Let’s Goooo! “Discipline is the tithe you pay, The reward is financial freedom.” - #You Got Options
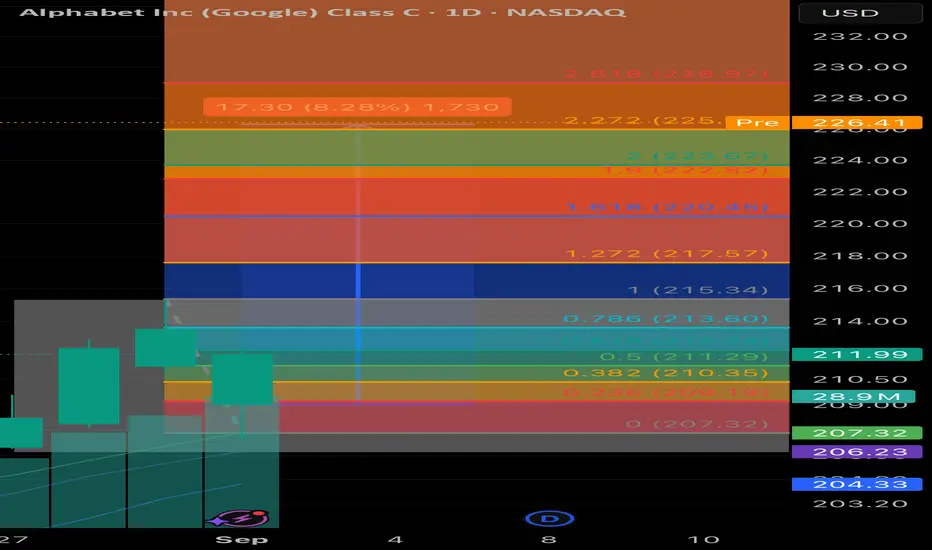
$GOOG $226 Premarket! 2.61 Golden Pocket Above for Puts Well what do we have here? We have Taz taking a peak at the GOOGLE pop 👀 would you just look at it? If you put the fib right at the last high and low, you get a nice Golden Pocket Target Above at $228.97 …
Now let’s be clear here. Congrats to the Bulls in my Room that saw that Alert from the Bot and Hopped in with the Big Boys.
For now, it’s time to go with tie short side imo. If we can get a tap of that 2.61 pocket above, I’ll swing something to the downside for next week. Targets would include a Gap fill. If not, then I will be patient and possibly not even enter. I would rather optimal entry. Then forced entry. Have a good one yall.
$SPY / $SPX Scenarios — Wednesday, Sept 3, 2025🔮 AMEX:SPY / SP:SPX Scenarios — Wednesday, Sept 3, 2025 🔮
🌍 Market-Moving Headlines
🏦 Traders bracing for a labor + Fed double header — ADP jobs and the Beige Book will steer rate-cut odds into Friday’s NFP.
📉 Stocks drifted Tuesday post-JOLTS miss — markets looking for confirmation of labor cooling.
💻 Tech earnings rotation continues — volatility in AMEX:XLK spilling into broader tape.
📊 Key Data & Events (ET)
⏰ 7:00 AM — MBA Mortgage Applications
⏰ 🚩 8:15 AM — ADP Employment Report (Aug)
⏰ 10:00 AM — ISM Services PMI (Aug)
⏰ 🚩 2:00 PM — Fed Beige Book
⚠️ Disclaimer: Educational/informational only — not financial advice.
📌 #trading #stockmarket #SPY #SPX #ADP #BeigeBook #Fed #labor #ISM #bonds #economy
Explaining Fibonacci Retracement/Extension levelsThis video is designed to help teach you why I use the Fibonacci Defense levels as components of price action and how I use Fibonacci retracement/extension levels (related to previous market trends).
Remember, the three components of price action are TIME, PRICE, & ENERGY.
If you don't understand how price is structured before attempting to use Fibonacci concepts, it's almost like trying to throw darts blindfolded.
You must break down the previous trends in order to try to understand what is happening with current price trends (expansion/contraction/phases).
Watch this video and I hope it helps all of you understand what the markets are doing and how to use Fibonacci Retracement/Extension levels more efficiently.
All types of technical analysis are validation tools - not guarantees. The only thing we get out of technical analysis is a way to validate or invalidate our expectations. A or B. Nothing else.
Get some.
#trading #research #investing #tradingalgos #tradingsignals #cycles #fibonacci #elliotwave #modelingsystems #stocks #bitcoin #btcusd #cryptos #spy #gold #nq #investing #trading #spytrading #spymarket #tradingmarket #stockmarket #silver

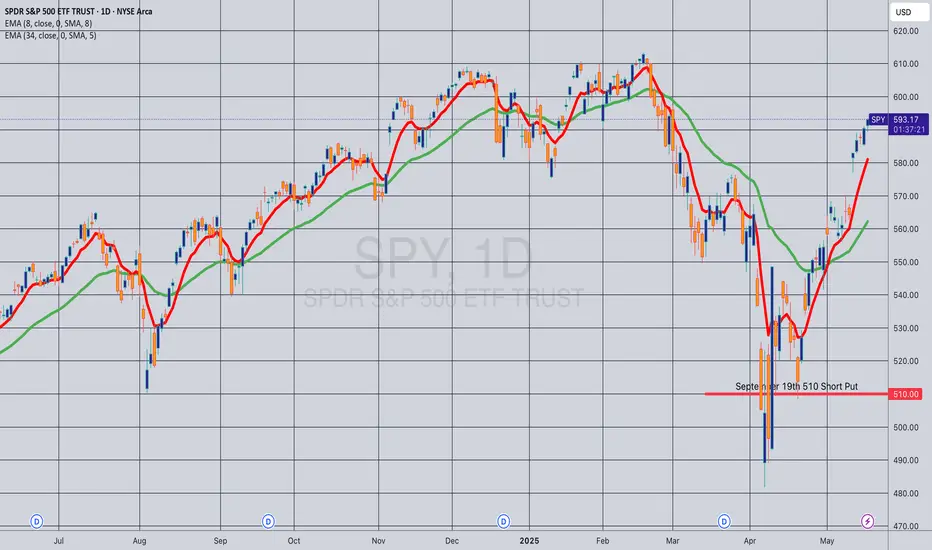
Opening (IRA): SPY September 19th 510 Short Put... for a 5.21 credit.
Comments: Laddering out, targeting the <16 delta strike paying around 1% of the strike price in credit.
Still looking to add in shorter intervals at strikes better than what I have on, but we've been in a grind-up ... .
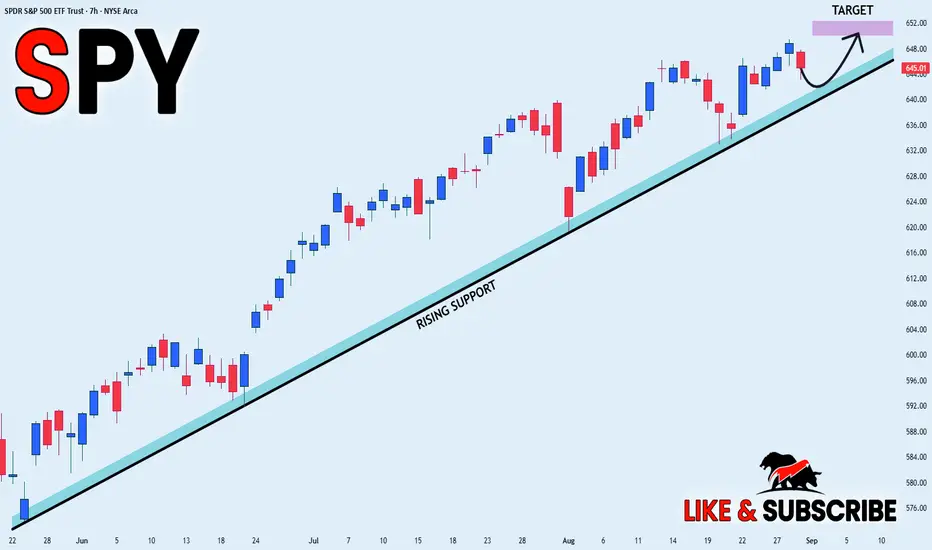
SPY LONG FROM RISING SUPPORT|
✅SPY is trading in an uptrend
Along the rising support line
Which makes me bullish biased
And the index is about to retest the rising support
Thus, a rebound and a move up is expected
With the target of retesting the level above at 650$
LONG🚀
✅Like and subscribe to never miss a new idea!✅
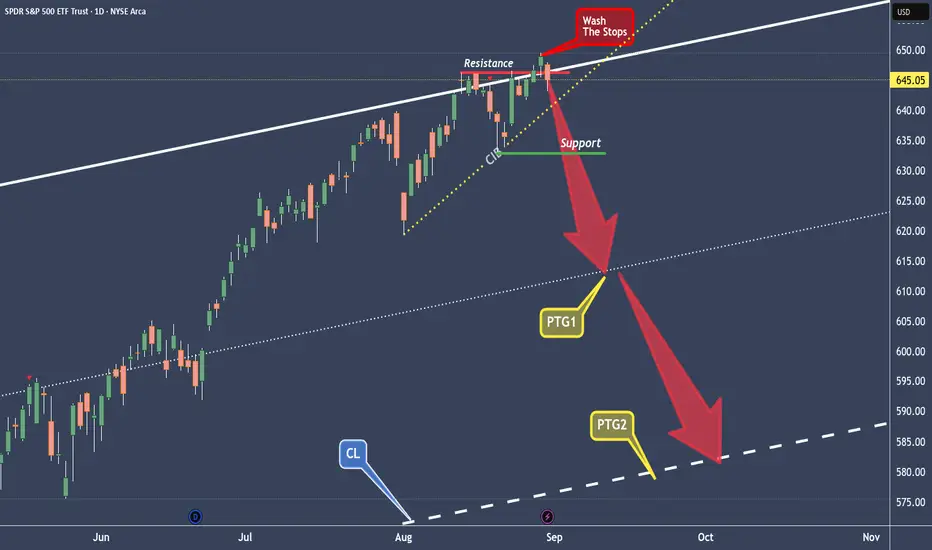
SPY washed away the Stops, and now rinse supportAt the U-MLH the air is very, very thin now.
SPY is experience this and it looks like this market shows it's hand.
It's the second time where the breakout failed.
A classical Double-Top.
Today SPY will open back into the Fork, which is a very bad sign for climbing markets. And if SPY can't close outside the Fork today, it would be a clear short to me.
So, after the Wash of the Stops at the Top, what follows is the "Rinse" of the support level and then way down to the PTG1, the 1/4 line, and further to the PTG2 at the Center-Line.
S&P 500 (ES1!): Short Term Sells For Longer Term Buys TargetsWelcome back to the Weekly Forex Forecast for the week of Sept 1 - 5th.
In this video, we will analyze the following FX market: S&P 500 (ES1!)
The S&P500 has been strong, but gave a bearish close on Friday. Looking at the Daily, it is easy to see price is retracing lower, perhaps to the +FVG, which is a great place to look for longs once contacted.
Short term sells are permissible, but be mindful the HTFs are bullish.
Enjoy!
May profits be upon you.
Leave any questions or comments in the comment section.
I appreciate any feedback from my viewers!
Like and/or subscribe if you want more accurate analysis.
Thank you so much!
Disclaimer:
I do not provide personal investment advice and I am not a qualified licensed investment advisor.
All information found here, including any ideas, opinions, views, predictions, forecasts, commentaries, suggestions, expressed or implied herein, are for informational, entertainment or educational purposes only and should not be construed as personal investment advice. While the information provided is believed to be accurate, it may include errors or inaccuracies.
I will not and cannot be held liable for any actions you take as a result of anything you read here.
Conduct your own due diligence, or consult a licensed financial advisor or broker before making any and all investment decisions. Any investments, trades, speculations, or decisions made on the basis of any information found on this channel, expressed or implied herein, are committed at your own risk, financial or otherwise.

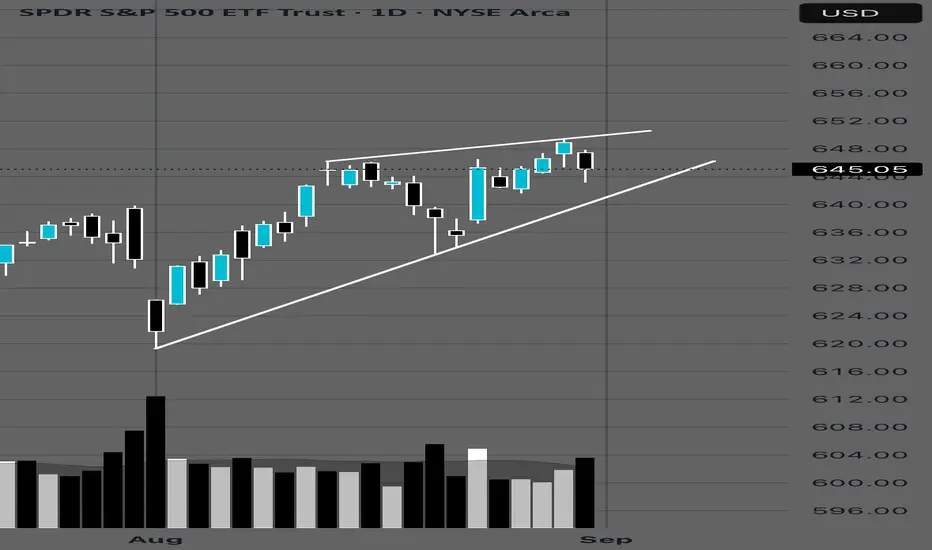
BEARS LOVE THIS!!! $SPY Break below this daily trend-line is not looking good for the bulls and everything for the bears 🐻. Price closing below would confirm the break of this daily trend. Rising wedge formed at all time highs 👀 is not a good sign.
Best of luck to everyone out there.
Not financial advice
🙂🫡
Is September For the Bears?QQQ CME_MINI:NQ1! CME_MINI:ES1! stock market Forecast
Nvidia Stock NASDAQ:NVDA Forecast
Apple Stock NASDAQ:AAPL Forecast
Microsoft Stock MSFT Forecast
Google Stock GOOGL Forecast
Amazon Stock AMZN Forecast
Meta Forecast Technical Analysis
Tesla Stock TSLA Forecast
Magnificent 7 stocks forecast

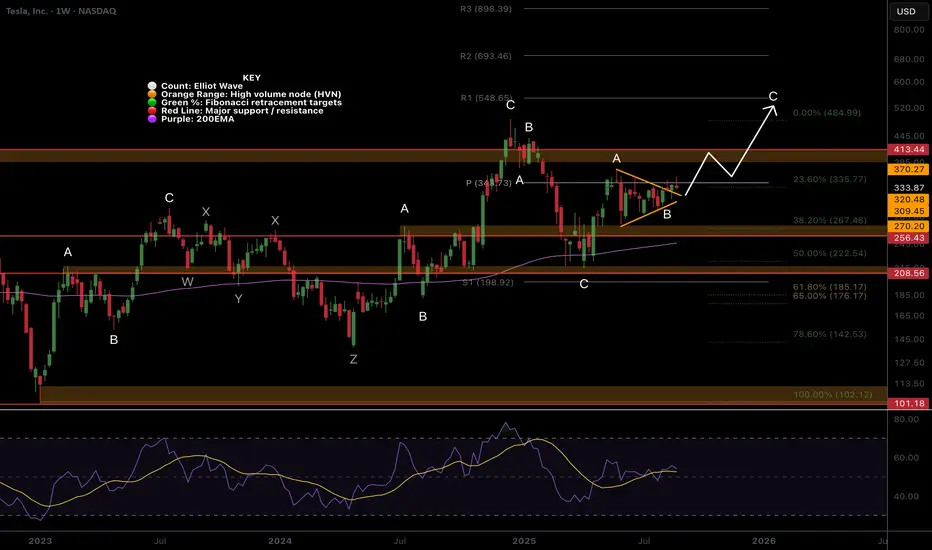
TESLA Bullish Wave C still underway...NASDAQ:TSLA is a tough count, the entire macro chart looks like a complex correction (wave 4?) with many series of 3 wave structures.
A triangle in wave B of the current wave appears complete, leading to a terminal thrust up with a target of the High Volume Node resistance at $410 followed by a poke above the swing high touching the R1 pivot at $548.
RSI remains at the EQ.
Analysis is invalidated below the wave B triangle.
Safe trading
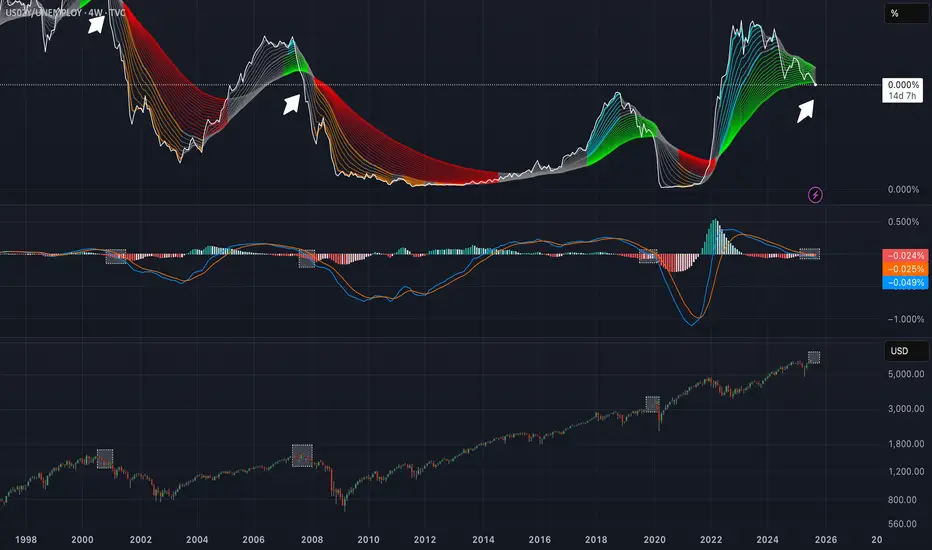
Credit crunch about to explodeI strongly believe we are about to experience a recession in the coming months. Open some spy shorts posisitions for late 2026.
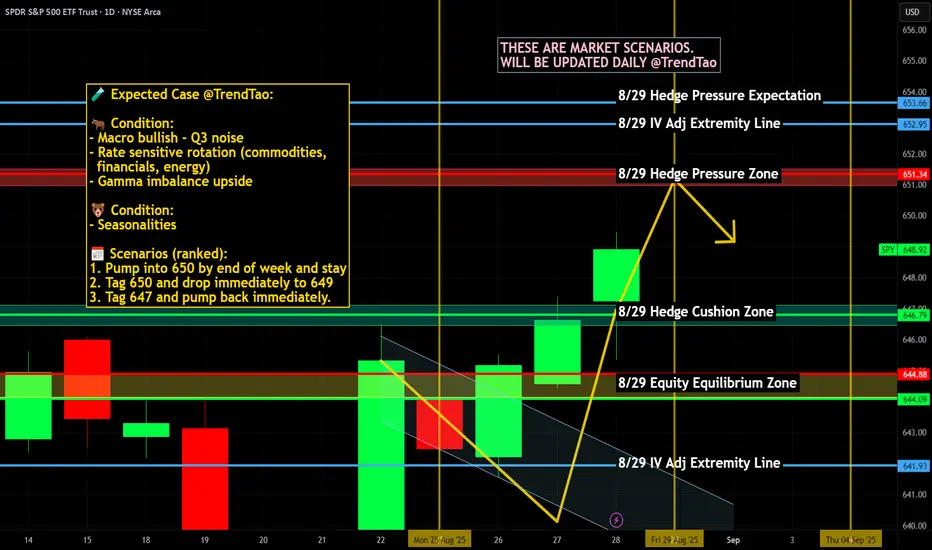
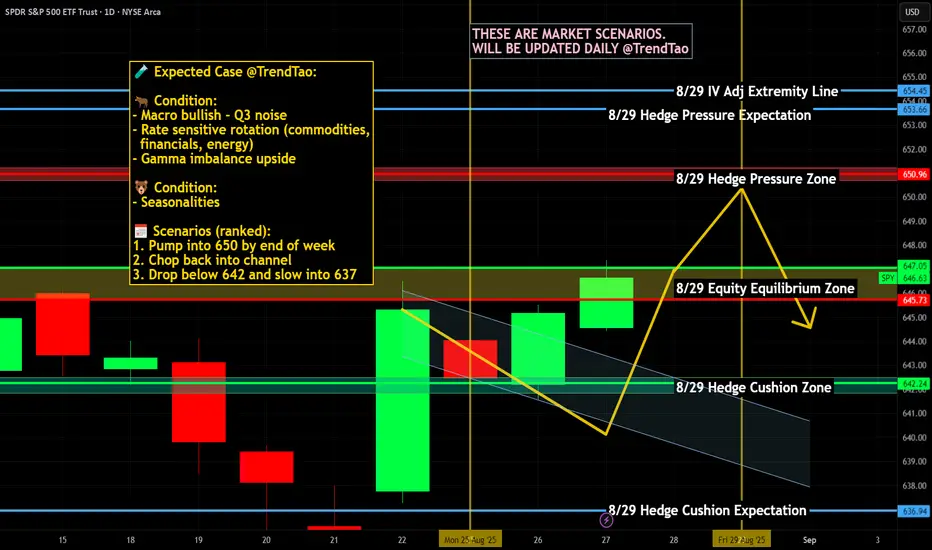
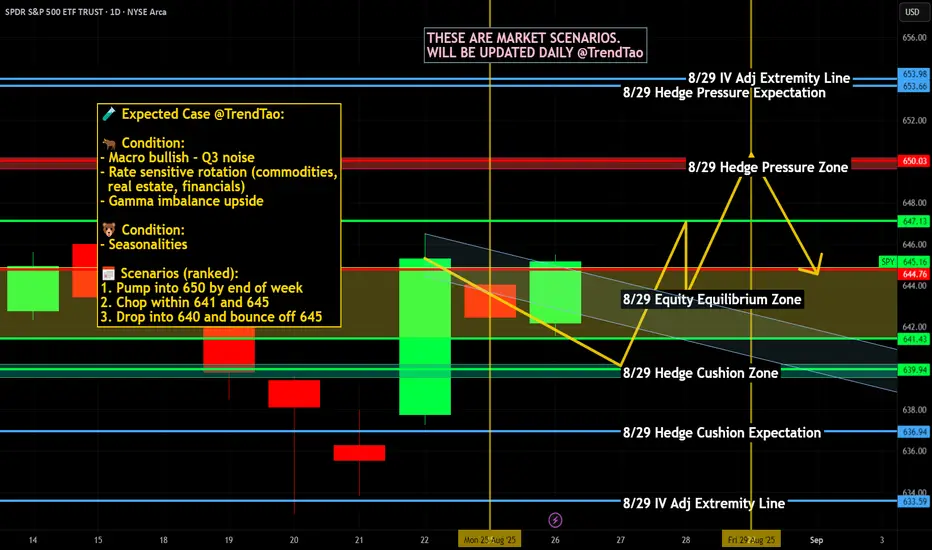
$SPY / $SPX Scenarios — Friday, Aug 29, 2025🔮 AMEX:SPY / SP:SPX Scenarios — Friday, Aug 29, 2025 🔮
🌍 Market-Moving Headlines
🔥 Fed’s favorite inflation gauge hits: PCE arrives just as markets digest Powell’s Jackson Hole tone.
💵 Consumer under the microscope: Spending & income data reveal demand strength heading into fall.
🏭 Regional PMI wrap: Chicago PMI closes out August with a manufacturing pulse check.
📊 Key Data & Events (ET)
⏰ 8:30 AM — PCE Price Index (Jul)
⏰ 8:30 AM — Personal Income & Outlays (Jul)
⏰ 9:45 AM — Chicago PMI (Aug)
⏰ 10:00 AM — UMich Consumer Sentiment (Final, Aug)
⚠️ Disclaimer: Educational/informational only — not financial advice.
📌 #trading #stockmarket #SPY #SPX #PCE #inflation #Fed #bonds #economy #PMI #consumerconfidence
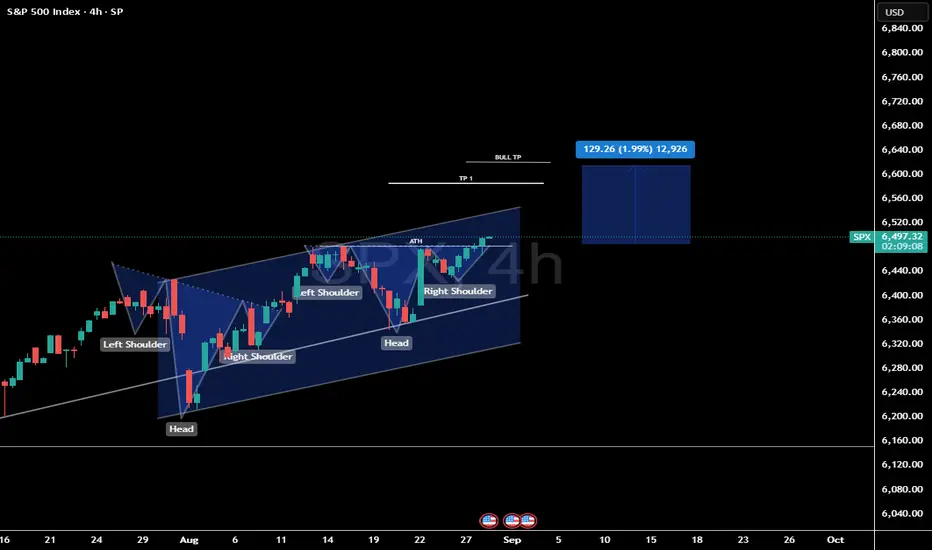
SPX is in a clear breakout trend! SP:SPX has triggered 2 larger bullish patterns.
Both patterns result in higher price.
Despite the weakness in NVDA the markets have shrugged off the decline.
We are trading into new all time highs so price discovery mode is in a effect.
When you have no resistance pivots or volume to trade against at new all time highs you really have to be careful if you're shorting the market.
Volume trends. extension moves, ATR, deviations should all be included in your analysis to define upside target zones.
We continue to remain net long the markets with key shorts in place.
TESLA 28 AUG 2025 PRICE ACTIONPrice action for Tesla is here. I have clearly explained my plan on how to trade tesla considering every factor in market.
NOTE: OPTION WILL BURN YOUR CAPITAL

$SPY / $SPX Scenarios — Thursday, Aug 28, 2025🔮 AMEX:SPY / SP:SPX Scenarios — Thursday, Aug 28, 2025 🔮
🌍 Market-Moving Headlines
🏔️ Jackson Hole aftershocks: Markets still digest Powell’s stance; cut odds for September in focus.
📉 GDP revision risk: Growth momentum under the microscope with Q2 update.
🛠️ Labor market cooling? Jobless claims set the tone into Friday’s PCE.
📊 Key Data & Events (ET)
⏰ 8:30 AM — Initial Jobless Claims (weekly).
⏰ 8:30 AM — GDP (Q2, 2nd Estimate).
⏰ 11:00 AM — Kansas City Fed Manufacturing Index (Aug).
⚠️ Disclaimer: Educational/informational only — not financial advice.
📌 #trading #stockmarket #SPY #SPX #Fed #GDP #joblessclaims #JacksonHole #bonds #economy
NVDA LIVE 27 AUG 2025This is my analysis for NVDA . i am not touching it all. I have discussed my reasons as per data. If you have any doubts, feel free to DM me
NOTE: AVOIDING NVDA

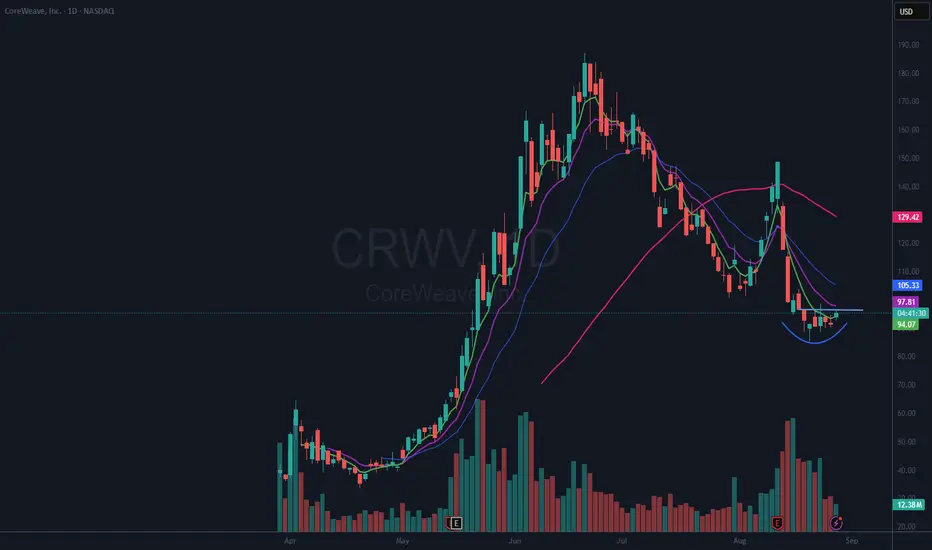
$CRWV Round Bottom Reversal?NASDAQ:CRWV is a hot IPO running from a low of $33.52 to a high of $187 back to a low of $85.26 and now trading, as of this post, at $94.67. I bought a small position on Aug 21st on what I thought at the time was a follow through from the low on Aug 20th. My entry price was $94.58, and I have not gotten stopped out as the price has not dropped below $85.26, the most recent low.
It looks to me to be forming a rounded bottom reversal. I have drawn in what I think seems to be an important price level at 96.60. “If” it can get up and over that I plan to add to my position. And my stop remains the same, a breach of the most recent low.
This one is clearly not out of the woods and is a high-risk trade as it is below important moving averages. On the other hand, the risk is well defined. If you like this idea, please make it your own by following your trading plan. Remember, it is your money at risk.
From Earnings Whispers:
CoreWeave Missed Expectations
Tuesday, August 12, 2025 at 4:07 PM ET
CoreWeave (CRWV) reported a loss of $0.25 per share on revenue of $1.21 billion for the second quarter ended June 2025. The consensus estimate was a loss of $0.20 per share on revenue of $1.08 billion. The Earnings Whisper number was a loss of $0.17 per share. The company missed expectations by 47.06%.
The company said during its conference call it expects third quarter revenue of $1.26 billion to $1.30 billion and 2025 revenue of $5.15 billion to $5.35 billion. The company's previous guidance was 2025 revenue of $4.90 billion to $5.10 billion. The current consensus revenue estimate is $1.23 billion for the quarter ending September 30, 2025 and revenue of $5.01 billion for the year ending December 31, 2025.
CoreWeave, the AI Hyperscaler™, delivers a cloud platform of cutting-edge software powering the next wave of AI.
$SPY / $SPX Scenarios — Wednesday, Aug 27, 2025🔮 AMEX:SPY / SP:SPX Scenarios — Wednesday, Aug 27, 2025 🔮
🌍 Market-Moving Headlines
🇺🇸➡️🇮🇳 U.S. slaps 50% tariffs on Indian goods (textiles, gems, leather, machinery) starting today — inflation & trade ripple risk.
💻 Earnings spotlight: Nvidia, CrowdStrike, Snowflake, Alibaba reporting this week → tech volatility in focus.
📊 Key Data & Events (ET)
⏰ All Day — U.S. Treasury Auctions (10-year note, 5-year note + FRN).
⏰ 11:45 AM — Richmond Fed Pres. Tom Barkin speaks.
⚠️ Disclaimer: Educational/informational only — not financial advice.
📌 #trading #stockmarket #SPY #SPX #Fed #tariffs #India #Treasury #earnings #tech #Nvidia
SPY/QQQ Plan Your Trade Update For 8-26This new video should help you understand the dynamics playing out related to SPY/QQQ, BTCUSD and GOLD/SILVER.
Get some.
#trading #research #investing #tradingalgos #tradingsignals #cycles #fibonacci #elliotwave #modelingsystems #stocks #bitcoin #btcusd #cryptos #spy #gold #nq #investing #trading #spytrading #spymarket #tradingmarket #stockmarket #silver
