SPY/QQQ Plan Your Trade For 6-11: Bottom-Base Rally Counter TrndToday's counter-trend Bottom-Base Rally pattern suggests the markets may attempt to find a peak and roll over into a downtrend.
The normal Bottom-Base Rally pattern is similar to the start of a moderate price base/bottom, then moving into a moderate rally phase.
In counter-trend mode this pattern would be inverted - forming a Top and then moving into a downward price trend.
I've been warning of the potential of a rollover top type of pattern in the SPY over the past few weeks - but it never really setup/confirmed.
I'll be curious to see if this counter-trend pattern, today, sets up some type of big top formation in the SPY/QQQ. It might be related to news as well.
Gold and Silver have a Gap-Stall-Revert-FLUSH pattern. This is always an interesting pattern because is suggests price is going to attempt to either gap and trend or stall and revert. My guess is we are looking at more trending in metals today.
Platinum is RIPPING higher (PL1!). Because of this, I believe Silver and Gold will attempt to follow Platinum and move to the upside today.
BTCUSD is stalling a bit. We'll see if we get any big price move in Bitcoin today. After the big rally over the past few days, it will be interesting to see if BTCUSD reverts downward or continues higher.
Overall, today's patterns suggest the markets are seeking direction. Get ready for an exciting day in the markets.
Get some.
#trading #research #investing #tradingalgos #tradingsignals #cycles #fibonacci #elliotwave #modelingsystems #stocks #bitcoin #btcusd #cryptos #spy #gold #nq #investing #trading #spytrading #spymarket #tradingmarket #stockmarket #silver
SPDR S&P 500 ETF (SPY)

SHORT ON SPY (SPX/USD)SPY has failed to create higher highs and given us a head and shoulders pattern.
I will be selling spy to the next level of demand looking to catch 50-60 points.
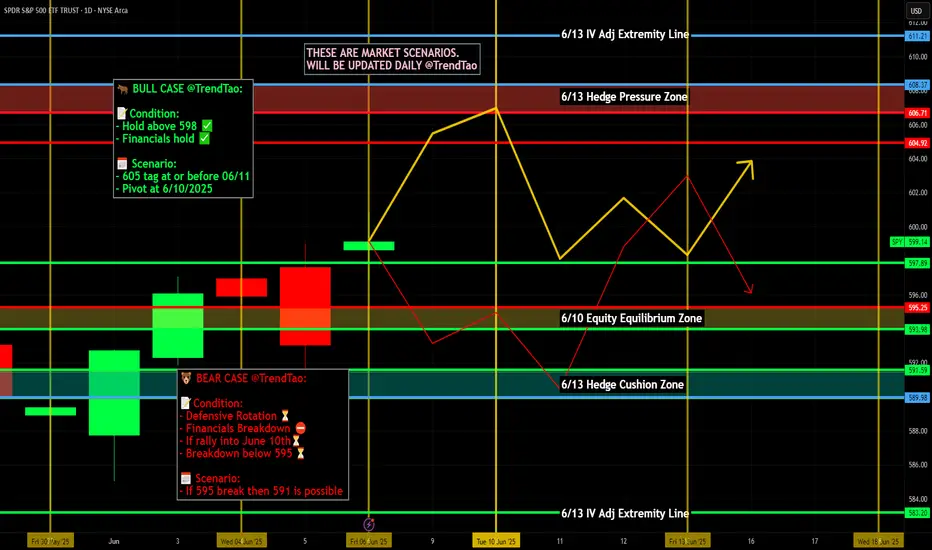
Nightly $SPY / $SPX Scenarios for June 11, 2025🔮 Nightly AMEX:SPY / SP:SPX Scenarios for June 11, 2025 🔮
🌍 Market-Moving News 🌍
🤝 Cautious Optimism on U.S.–China Trade Progress
Markets responded positively to fresh developments in ongoing U.S.–China trade talks, with S&P 500 and Nasdaq closing ~0.6% higher — the third straight day of gains — on hopes of easing trade barriers
📉 Treasury Yields Climb as Auction Approaches
Bond investors grew cautious ahead of a key Treasury debt auction and incoming U.S. inflation data. The 10-year yield stayed elevated, weighing modestly on equities .
💹 Global Markets Showing Resilience
Asian and European markets tracked U.S. gains midweek, driven by trade-talk optimism, despite lingering concerns over slower global growth and debt levels .
📊 Key Data Releases 📊
📅 Wednesday, June 11:
(No major U.S. releases — focus remains on market reactions to trade talks and Treasury auctions.)
⚠️ Disclaimer:
This information is for educational and informational purposes only and should not be construed as financial advice. Always consult a licensed financial advisor before making investment decisions.
📌 #trading #stockmarket #economy #news #trendtao #charting #technicalanalysis


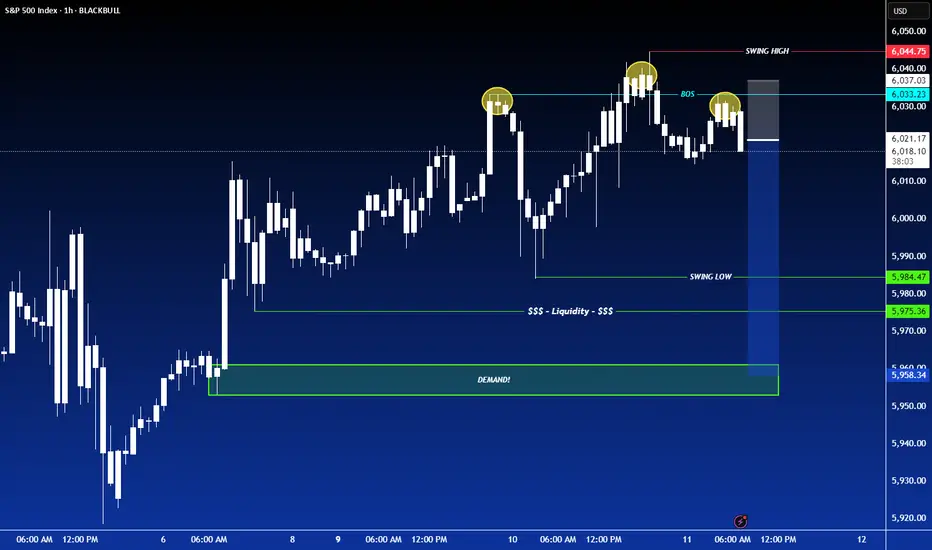
06/10/25 Trade Journal, and ES_F Market analysisEOD accountability report: +2575
Sleep: 9 hours
Overall health: Good
What was my initial plan?
I was neutral going into market open, I expected market to pullback a bit if we had lost 6016 but it never truly got lost.
remained neutral and just watched my levels of 6028 and 6045.
**Daily Trade recap based on VX Algo System from (9:30am to 2pm)**
— 9:30 AM Market Structure flipped bearish on VX Algo X3!
— 10:00 AM VXAlgo YM X3 Sell Signal
— 10:58 AM VXAlgo ES X1 Sell Signal
— 11:32 AM VXAlgo ES X3 Sell Signal (triple sell x3) B+ set up
— 12:00 PM Market Structure flipped bearish on VX Algo X3!
1:03 PM VXAlgo ES X1 Sell Signal
— 1:20 PM VXAlgo ES X1 Sell Signal
Next day plan--> Above 6000 = Bullish, Under 5990 = Bearish
Video Recaps -->https://tradingview.sweetlogin.com/u/WallSt007/#published-charts

SPY/QQQ Plan Your Trade For 6-10 : POP PatternToday's POP pattern suggests a potential big price move will take place. Given the overnight activity on the ES (rallying higher then rolling over), I suggest today's price move may attempt to retest these overnight highs, then repeat the breakdown phase into the close.
The markets continue to try to melt upward. This trend will continue until the markets decide to break downward.
After the deep low created by the tariff news, the markets continue to try to rally to new highs. It is very likely that Q2 earnings data may push the SPY to new ATH levels before we see any big rotation in price.
The markets have a tendency to move just above recent highs, then stall and revert downward as a pullback. This move may be no different.
The continued stalling of price trying to move higher recently suggests the markets are running into moderate resistance and I believe traders are actively pulling capital away from this rally.
The trend is still BULLISH. Stay cautious of this upward move as a breakdown could happen at any time.
Gold and Silver are moving into an impressive rally phase. Silver and Platinum have moved considerably higher over the past 10+ days. I believe Gold is lagging and will make a big move higher over the next 5 to 10+ days.
Silver is targeting $41-44+. Gold should target $3400 to $3500+ near the same time.
Bitcoin made a huge rally yesterday - reaching my 110,500 upper resistance level. Now, we see if Bitcoin has the momentum to carry higher or if it will fail and rollover into a downtrend.
It seems we are right as a MAKE or BREAK level in the markets. I'm still a believer of MELT UP until it fails.
I continue to watch for technical failure - but I've not seen it happen yet.
Get some.
#trading #research #investing #tradingalgos #tradingsignals #cycles #fibonacci #elliotwave #modelingsystems #stocks #bitcoin #btcusd #cryptos #spy #gold #nq #investing #trading #spytrading #spymarket #tradingmarket #stockmarket #silver

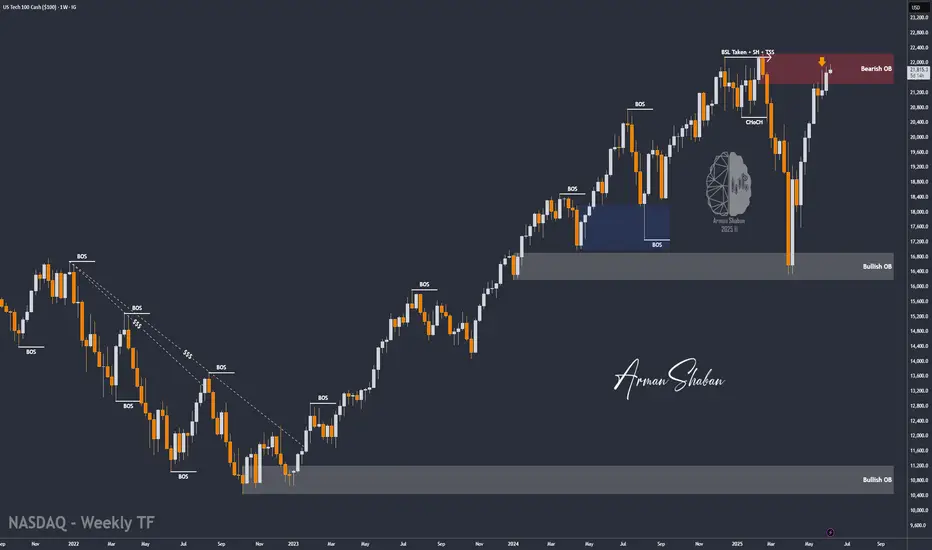
Nasdaq at Supply Zone – Rejection or Breakout? (READ THE CAPTIONBy examining the #Nasdaq chart on the weekly timeframe, we can see that the price is still trading within the supply zone around 21,850. We are still waiting for a strong rejection from this level, which could lead to a short-term price correction in this index.
The potential downside targets are:
21,000, 20,700, 20,200, and 19,150.
The key supply range lies between 21,400 and 22,200.
Additionally, there is a possibility of a liquidity grab or stop-hunt above 22,200 before any real drop begins.
This analysis will be considered invalid if price closes above 22,400 in the next three weeks.
On the fundamental side, there are several macro factors to watch:
Interest Rate Expectations:
Although inflation in the U.S. has cooled compared to last year, the Fed remains cautious. If upcoming CPI or PPI prints show unexpected resilience, the likelihood of rate cuts this year could diminish, pressuring tech-heavy indices like Nasdaq.
Tech Sector Valuations:
Valuations in major tech names — such as NVIDIA, Apple, and Microsoft — have reached historically high multiples. This makes Nasdaq particularly vulnerable to correction, especially if earnings disappoint or growth expectations soften.
Geopolitical Risks:
Ongoing tensions between the U.S. and China over trade and technology, as well as potential instability in the Middle East, could contribute to a risk-off sentiment — further supporting the case for a short-term pullback.
Earnings Season Ahead:
Q2 earnings season is around the corner. Any signs of slowing revenue growth or reduced forward guidance from major tech firms could act as a catalyst for the expected correction.
Please support me with your likes and comments to motivate me to share more analysis with you and share your opinion about the possible trend of this chart with me !
Best Regards , Arman Shaban
06/09/25 Trade Journal, and Where is the Stock Market going tomoEOD accountability report: +1800
Sleep: 9 hours
Overall health: Good
What was my initial plan?
Bearish going into the market since we had bearish structure, but missed the short at the start of the market. So just waited for gamma levels to hit orr 1 min MOB to be lost before shorting.
Daily Trade recap based on VX Algo System from (9:30am to 2pm)
— 9:30 AM Market Structure flipped bearish on VX Algo X3!
— 10:20 AM VXAlgo YM X1 Buy Signal,
— 11:00 AM Market Structure flipped bullish on VX Algo X3!
— 1:17 PM VXAlgo NQ X1 Sell Signal (triple sell signal by 1:20)
Next day plan--> Above 6000 = Bullish, Under 5990 = Bearish
Video Recaps -->https://tradingview.sweetlogin.com/u/WallSt007/#published-charts

Nightly $SPY / $SPX Scenarios for June 10, 2025🔮 Nightly AMEX:SPY / SP:SPX Scenarios for June 10, 2025 🔮
🌍 Market-Moving News 🌍
📱 Apple Disappoints at WWDC Keynote
Apple ( NASDAQ:AAPL ) faced criticism after a lackluster WWDC keynote. Major AI and Siri upgrades were delayed, prompting a 1–1.5% drop in Apple shares—the weakest move during today's presentation
🎮 GameStop to Report Q1, Crypto Pivot in Focus
GameStop ( NYSE:GME ) is scheduled to announce Q1 earnings after market close. Investors will be watching for updates on its $500M Bitcoin allocation and potential crypto-related strategies
📈 Small-Business Optimism Rises
The NFIB Small Business Optimism Index for May came in at 95.9—above the 94.9 consensus—showing modest improvement in sentiment among small firms
📊 Key Data Releases & Events 📊
📅 Tuesday, June 10:
6:00 AM ET – NFIB Small Business Optimism (May):
A reading above expectations could boost risk market sentiment by showing stronger Main Street confidence.
⚠️ Disclaimer:
This is for educational/informational purposes only and does not constitute financial advice. Please consult a licensed professional before making investment decisions.
📌 #trading #stockmarket #economy #news #trendtao #charting #technicalanalysis
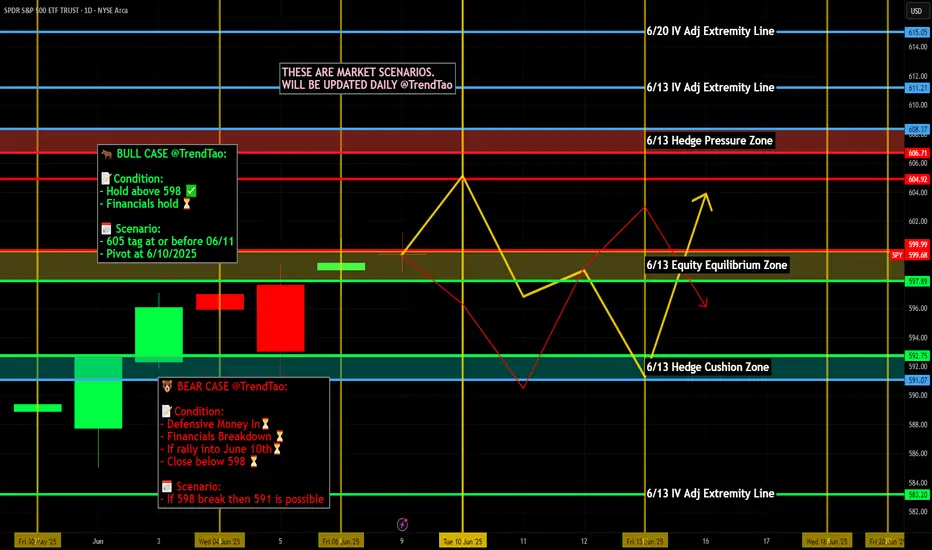
Are The Markets Running Out Of Steam? SPY just cant seemed to hold above the 600 psychological level.
Are big players unloading into this positive market strength?
Are we due for a larger pullback?
There's a lot of mixed price action and we just cant seem to make a true breakout.
Some names are underperforming and other names are outperforming.
We remain tactically bullish while trimming keys positions into strength.
Being nimble in this market us key as were seeing large intra day swings.
Short term there is some risk of lower price so we have hedged in some individual names while still remaining bullish.

Oex 4 hourly chart so you can see in detail The chart posted should be view as a guide to what is a Crossroad in all indexes Today best of trades wavetimer!

The Trump & Musk Friends Again - Tesla RippingAnalysts attribute the recovery to cooling tensions between Elon Musk and President Donald Trump, which had previously weighed on investor sentiment.
Additionally, Tesla's upcoming robo-taxi launch on June 12 is generating excitement, with some analysts predicting it could be a major revenue driver. However, concerns remain about Tesla's valuation, as it trades at a price-to-earnings ratio of 192, significantly higher than traditional automakers.

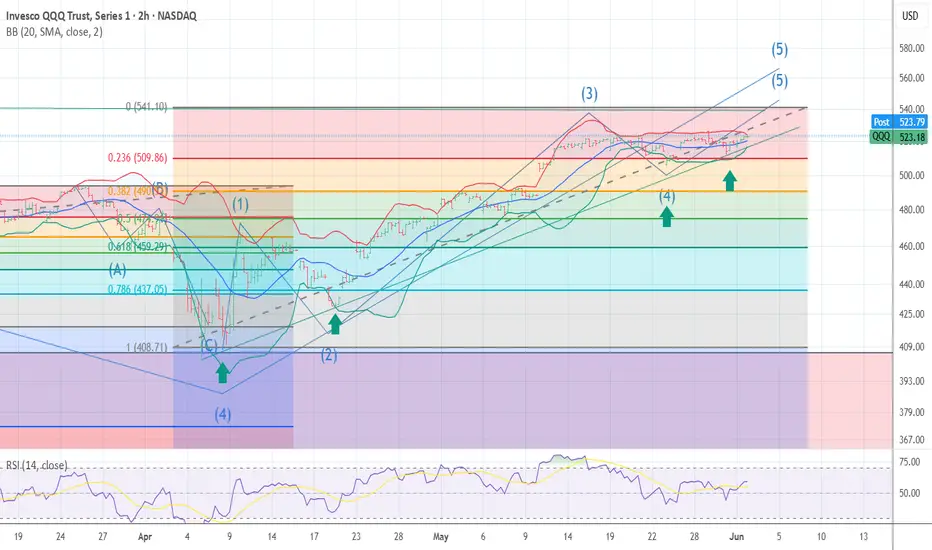
QQQ NOTICE TREND LINE SUPPORT I have now started to position for the transition in the markets I have moved out of all calls again for the 4 time in 4 days each of the trades made $$ . but today is day 39 TD of the rally . And I am looking for a TOP in day 40 TD I have now moved to 40 today then 75% MOC in spy and qqq 5550 555 560 QQQ puts 2026 time zone and 650 in spy . The trendline has held rather nice to help make some nice $$ and we if bullish should now be in early wave 3 of 5 of 5 of 5 .So why buy puts NOW simple answer is It could still be wave c up for wave B or wave D. and That today is day TD39 I have posted a possible Major top due on td 40 and The spiral hold up into june 6th to 9th .I know my risks and am willing to start taking the same stand and positions as I did 11/29 12/6 and feb 18th based on the wave structure and PUT /CALL model . I am willing to This is not for all traders . But I am turning down in NYSI and the NYMO is showing buying is running out but bullish call buying is nearing the two last TOPS . I have 25 % cash and will wait for two things One put call drops to 60 on 5 day or 10 day at 65 second daily RSI is no confirmation . 3rd the qqq reaches 531/534 knowing it could extend to 541/555 and similar in sp cash or the DJI prints a .786 this is a lot but it is part of the game plan best of trades WAVETIMER
SPY/QQQ Plan Your Trade For 6-9: Inside BreakawayToday's pattern suggests the SPY/QQQ will attempt to make a breakaway type of price move - away from Friday's open-close range.
Given the fairly tight opening price level this morning, I would stay cautious in early trading today and try to let the first 60 minutes play out - looking for that breakaway trend/momentum.
Overall, the markets are still in a Bullish price phase - trying to push higher.
But, as I continue to warn, I believe the markets could rollover and break downward at any time.
BTCUSD moved substantially higher overnight. This could be the beginning of a bigger advance higher. But, it could also be an exhaustion move higher.
Gold and Silver are still melting upward. This move in metals recently certainly shows the markets are still fearful of any potential downside price activity.
Again, I urge traders to stay cautious as we continue to struggle within the sideways price range.
Price will show us what it wants to do and I believe this move higher in BTCUSD could be a false type of breakout move to the upside.
Get some.
#trading #research #investing #tradingalgos #tradingsignals #cycles #fibonacci #elliotwave #modelingsystems #stocks #bitcoin #btcusd #cryptos #spy #gold #nq #investing #trading #spytrading #spymarket #tradingmarket #stockmarket #silver

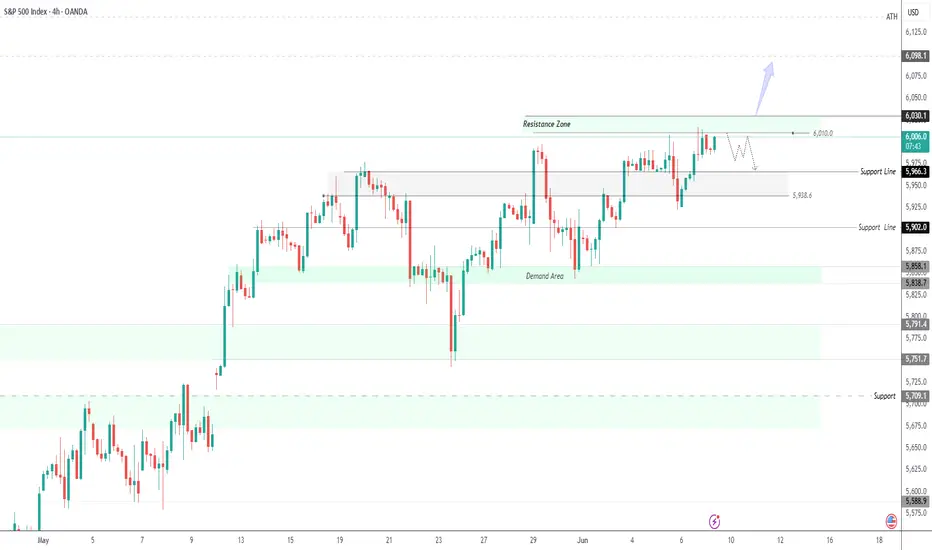
SPX500 – Volatile Week Ahead as Trade Talks and CPI LoomSPX500 | Overview
Fundamental Insight:
S&P 500 futures edged lower early Monday as traders brace for a high-impact week.
Key events include:
- US-China trade talks in London (Monday)
- U.S. inflation data (CPI) expected midweek (Wednesday)
Markets are cautious, awaiting clarity from both geopolitical developments and macroeconomic indicators, which could trigger strong directional moves.
Technical Outlook:
The price appears to be entering a correction phase, with the potential to drop toward 5966.
A confirmed break below 5966 may extend the bearish trend toward 5938 and 5902.
However, a break above 6030 would invalidate the bearish scenario and could trigger a bullish continuation toward 6098 and potentially a new all-time high (ATH).
Pivot Line: 6010
Support Levels: 5966, 5938, 5902
Resistance Levels: 6030, 6098
Weekly $SPY / $SPX Scenarios for June 9–13, 2025 🔮 Weekly AMEX:SPY / SP:SPX Scenarios for June 9–13, 2025 🔮
🌍 Market-Moving News 🌍
📱 Apple WWDC & Tech Momentum
Apple’s annual Worldwide Developers Conference kicks off Monday with CEO Tim Cook set to discuss new products, services, and likely AI initiatives—tracks should watch include impacts on NASDAQ:AAPL and AI-related stocks
🧨 GameStop Eyed for Crypto Pivot
GameStop (a meme-stock darling) reports earnings Tuesday. Markets are watching for updates on its $500M bitcoin investment and potential pivot toward crypto-driven revenue streams
🇨🇳 U.S.–China Trade Talks in London
High-level trade dialogue begins Monday between U.S. and Chinese representatives in London, offering possible relief to trade tensions and providing a lift to risk assets
📉 Key Inflation Data Midweek
Wednesday brings the May CPI release—crucial for assessing tariff-driven inflation trends and likely to influence Fed policy outlook ahead of next month’s meeting
💹 Oil Markets React to Trade Uncertainty
Oil prices are stable to slightly up ahead of trade talks, as Brent holds around $66/barrel—reflecting balanced supply concerns and hopes for easing global tensions
🌐 G7 Summit and Global Policy Risks
G7 finance ministers convene in Canada (50th anniversary), tackling trade strains, Russia–Ukraine, and inflation. Global macrospoilers could trigger renewed volatility
📊 Key Data Releases & Events 📊
📅 Monday, June 9
Apple WWDC begins (CEO keynote)
U.S.–China trade talks start in London
📅 Tuesday, June 10
GameStop Q2 earnings (+ bitcoin update)
NFIB Small Business Index (6:00 AM ET)
📅 Wednesday, June 11
8:30 AM ET – Consumer Price Index (May)
Watch for inflation signal from tariffs.
8:30 AM ET – Core CPI (May)
Core inflation trend under scrutiny.
📅 Thursday, June 12
8:30 AM ET – Producer Price Index (May)
Early check on wholesale inflation
8:30 AM ET – Initial & Continuing Jobless Claims
📅 Friday, June 13
10:00 AM ET – University of Michigan Consumer Sentiment (June, preliminary)
Consumer mood and tariff impact insights
⚠️ Disclaimer:
This is for informational/educational purposes only. Not financial advice. See a licensed advisor before making investing decisions.
📌 #trading #stockmarket #economy #news #trendtao #charting #technicalanalysis
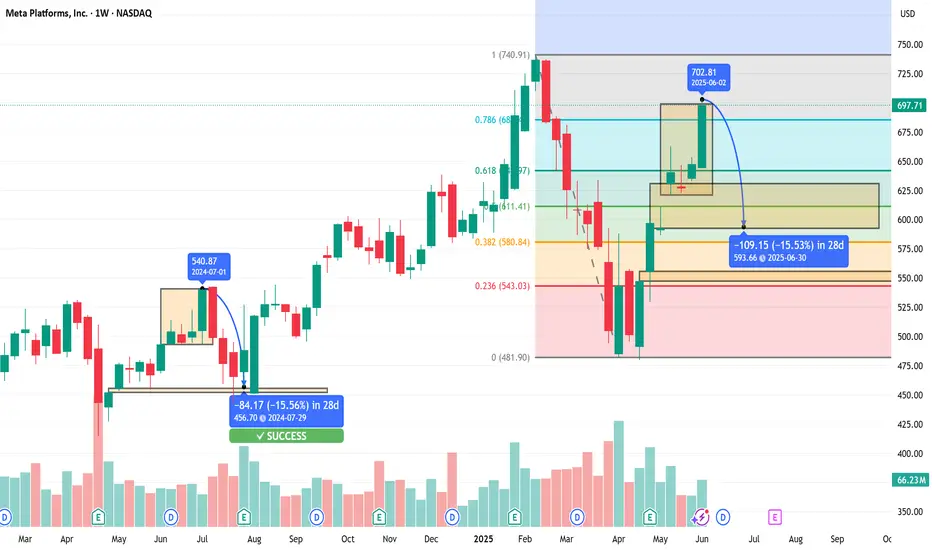
$META Short Swing - Fractal Repeat Play - Sub $600 Target@everyone 🔻 META Short Swing – Fractal Repeat Play 🔁
Entry Trigger: Week of June 10, 2025
Ticker: NASDAQ:META
Current Price: $697.71
Target Price: $593.66
Estimated Duration: ~3–4 weeks
Conviction: ★★★★★
🧠 Thesis:
This is a nearly perfect fractal repeat of META’s July 2024 top:
Identical weekly candle structure: topping wick into fib + supply zone
Weekly gap fill target lines up exactly again — same 15.5% drop
Wick gap fill = $593.66 (same confluence from 2024)
Bearish fib roadmap from 0.786 → 0.618 → 0.382
Volume and momentum exhausted on the run into $702
📉 Trade Plan:
Entry Range: $690–702 rejection zone
Stop Loss: Weekly close above $705
Primary Target: $593.66
This level completes the wick gap fill and matches 2024’s exact structure
Secondary Target (optional): $580.84 (full fib gap + demand retest)
🛠️ Options to Consider:
6/28 $650P or $640P – standard swing
7/5 $620P – for deeper move toward 0.382 and beyond
🔍 Setup Snapshot:
July 2024: -15.56% in 28 days
June 2025: Targeting -15.53% in 28 days
Same gap, same wick rejection, same fade roadmap
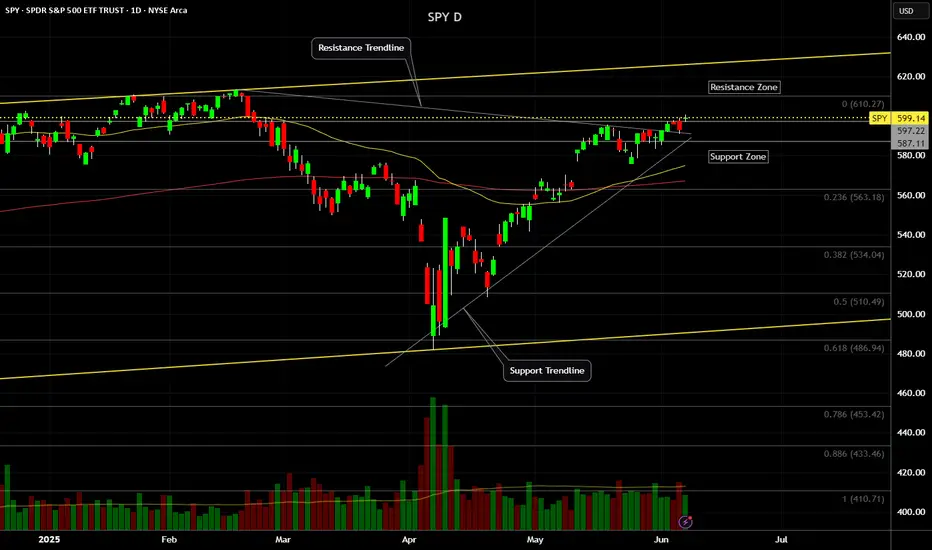
SPY (S&P500 ETF) - Price Attempting Breakout Above ResistanceSPY (S&P500 ETF) price is attempting to breakout above Daily resistance levels of $594 and $597.
SPY ETF has been in an uptrend since May 2025. A Golden Cross also occured on May 19th 2025, signaling that a potential longer term bullish rally could occur.
Friday's candle closed as a Doji signaling some potential indecision after recent price volatility.
SPY price is not at any extreme level on the Daily chart.
If SPY price ever gaps up and rallies up to the $612 to $620 resistance zone, price could sell off stronger (short-term).
In June 2025, trade deal and inflation news will most likely be the catalyst for further volatility, in addition to government news announcements.
Weekly Market Forecast: BUY Stock Indices & Oil! Sell Gold! In this Weekly Market Forecast, we will analyze the S&P 500, NASDAQ, DOW JONES, Gold and Silver futures, for the week of June 9 - 13th.
Stock Indices are looking more bullish. Valid buys only!
Gold is weak. Sells only until there is a market structure shift upwards.
Oil prices have room to go higher. Buy it.
Silver is a wait and see. Should start to pull back this week, as it closed last week stronger than Gold.
CPI Wednesday. After the news is announced, the market should be very tradeable for the rest of the week.
Enjoy!
May profits be upon you.
Leave any questions or comments in the comment section.
I appreciate any feedback from my viewers!
Like and/or subscribe if you want more accurate analysis.
Thank you so much!
Disclaimer:
I do not provide personal investment advice and I am not a qualified licensed investment advisor.
All information found here, including any ideas, opinions, views, predictions, forecasts, commentaries, suggestions, expressed or implied herein, are for informational, entertainment or educational purposes only and should not be construed as personal investment advice. While the information provided is believed to be accurate, it may include errors or inaccuracies.
I will not and cannot be held liable for any actions you take as a result of anything you read here.
Conduct your own due diligence, or consult a licensed financial advisor or broker before making any and all investment decisions. Any investments, trades, speculations, or decisions made on the basis of any information found on this channel, expressed or implied herein, are committed at your own risk, financial or otherwise.

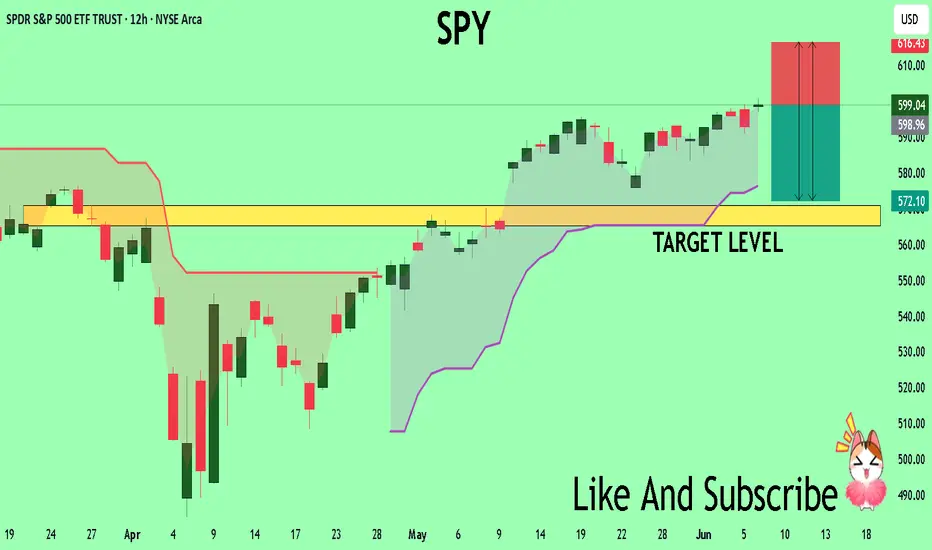
SPY Trading Opportunity! SELL!
My dear followers,
I analysed this chart on SPY and concluded the following:
The market is trading on 599.04 pivot level.
Bias - Bearish
Technical Indicators: Both Super Trend & Pivot HL indicate a highly probable Bearish continuation.
Target - 570.83
Safe Stop Loss - 616.43
About Used Indicators:
A super-trend indicator is plotted on either above or below the closing price to signal a buy or sell. The indicator changes color, based on whether or not you should be buying. If the super-trend indicator moves below the closing price, the indicator turns green, and it signals an entry point or points to buy.
Disclosure: I am part of Trade Nation's Influencer program and receive a monthly fee for using their TradingView charts in my analysis.
———————————
WISH YOU ALL LUCK
Stock Market Forecast | TSLA NVDA AAPL AMZN META MSFTStock Market Forecast | CME_MINI:NQ1! CME_MINI:ES1! QQQ AMEX:SPY
Mag 7 Forecast | NASDAQ:TSLA NASDAQ:NVDA AAPL AMZN META MSFT GOOG

SPY Swing Trade Plan – 2025-06-06📈 SPY Swing Trade Plan – 2025-06-06
Bias: Moderately Bullish
Timeframe: 3–4 weeks
Catalysts: Strong institutional flows, trade talk optimism, solid jobs report
Trade Type: Long equity position
🧠 Model Summary Table
Model Bias Entry Stop Loss Take Profit Holding Period Confidence
DS Moderately Bullish $600.02 $595.54 $618.02 3 weeks 65%
LM Moderately Bullish $598.50 $586.70 $616–618 3–4 weeks 75%
GK Strongly Bullish $600.02 $592.00 $610.00 4 weeks 72%
GM Moderately Bullish ~$600.50 $587.50 $627.50 3–4 weeks 70%
CD Moderately Bullish $600–600.50 $585.00 $620 / $635 3–4 weeks 72%
✅ Consensus: SPY is in a bullish trend across timeframes
⚠️ Disagreements: MACD momentum and entry/pullback levels
🔍 Technical & Sentiment Summary
Trend: SPY above 10/50/200 EMAs on all models
RSI: 60–61 → bullish but not overbought
MACD: Mostly positive, DS cautious on daily histogram
Support Levels: $591.06, $595.54, $597.26
Resistance Zones: $600.83, $605.21, $610
VIX: 17.6 (declining), supports risk-on sentiment
News: Trade talk optimism and strong jobs data fueling momentum
✅ Final Trade Setup
Parameter Value
Instrument SPY
Strategy LONG
Entry Price $600.00
Stop Loss $588.00
Take Profit $625.00
Position Size 83 shares (1% risk on $100K)
Entry Timing At market open
Confidence 70%
💡 Rationale: Aligned bullish signals across timeframes, falling VIX, and strong macro sentiment favor a trend continuation move toward $625. Position sized for conservative risk management.
⚠️ Key Risks & Considerations
MACD divergence could signal near-term stall
Resistance zone at $605 may act as a cap
Macro volatility: Strong jobs could raise rate expectations
VIX Watch: A spike above 20 could reverse market trend
Exit Protocol: Consider closing if SPY closes below the 10-day EMA (~$591)
📊 TRADE DETAILS SNAPSHOT
🎯 Instrument: SPY
📈 Direction: LONG
💰 Entry Price: 600.0
🛑 Stop Loss: 588.0
🎯 Take Profit: 625.0
📊 Size: 83 shares
💪 Confidence: 70%
⏰ Entry Timing: Open

RobinHood - Urgent News - Afterhours SelloffOn June 6, 2025, S&P Dow Jones Indices announced no changes to the S&P 500 index in its quarterly rebalance, marking the first such instance since March 2022. This decision notably excluded Robinhood Markets Inc., despite speculation that it might be included due to its market capitalization exceeding $20.5 billion and recent strong performance. Following the announcement, Robinhood's stock declined over 5% in after-hours trading
The next S&P500 quarterly rebalancing is set for September 2025....perhaps the next leg higher needs to wait until them
As of June 6, market close, Robinhood's stock is trading at $74.88, with a market capitalization of approximately $36.85 billion. The company has experienced significant growth, with a 365% increase in stock price over the past 12 months and a 50% surge to start 2025. Analysts project continued revenue and earnings growth, with an average one-year price target of $51.19 per share
We issued put option alerts to our members and shorted this live stream on Friday afternoon.
