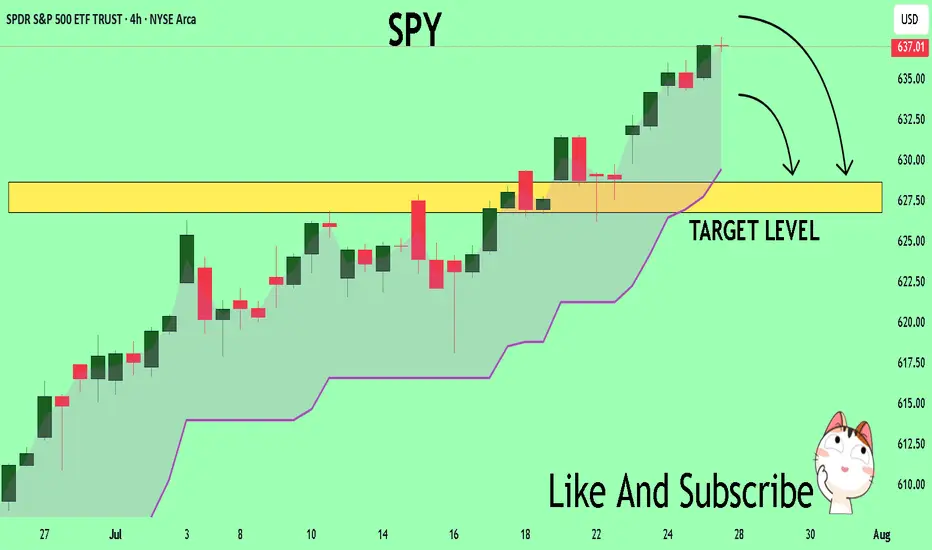
SPY Will Collapse! SELL!
My dear subscribers,
This is my opinion on the SPY next move:
The instrument tests an important psychological level 637.01
Bias - Bearish
Technical Indicators: Supper Trend gives a precise Bearish signal, while Pivot Point HL predicts price changes and potential reversals in the market.
Target - 628.63
About Used Indicators:
On the subsequent day, trading above the pivot point is thought to indicate ongoing bullish sentiment, while trading below the pivot point indicates bearish sentiment.
Disclosure: I am part of Trade Nation's Influencer program and receive a monthly fee for using their TradingView charts in my analysis.
———————————
WISH YOU ALL LUCK
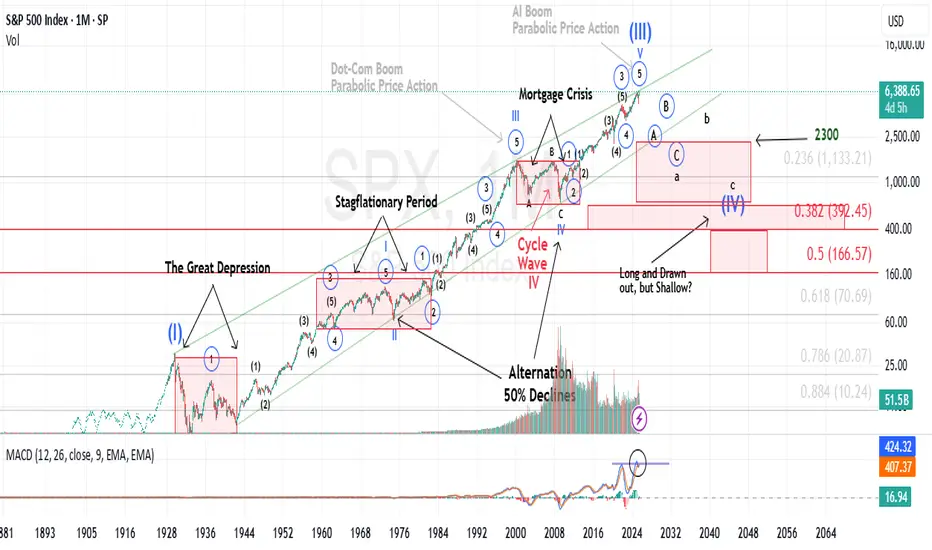
SPDR S&P 500 ETF (SPY)
History does not repeat itself, however it tends to rhymeIt’s widely accepted that Mark Twain once said (or wrote) that “history does not repeat itself, however it tends to rhyme”.
Historical Parallels to a Super Cycle Wave (I) Top in U.S. Equities
The road to a major market top is often paved with echoing patterns from the past, and today's landscape bears an uncanny resemblance to pivotal historical events that preceded economic upheaval.
The 1918 Spanish Flu—though less economically damaging in the U.S. than elsewhere, still triggered a 1.5% drop in GDP and a 2.1% decline in consumer spending. The resulting economic weakness, paired with rising inflation, eroded real returns on equities and short-term government bonds for years.
Then came the 1929 stock market crash, the spark that ignited the Great Depression. Driven by a perfect storm of extreme speculation, sky-high valuations, and a regulatory vacuum, the collapse revealed the systemic fragility beneath the euphoria.
Adding fuel to the fire, the Smoot-Hawley Tariff Act of 1930 slammed the brakes on global trade. By sharply raising tariffs on imports, it invited swift retaliatory measures from abroad. The result: a devastating plunge in both U.S. exports and imports, deepening the economic crisis and worsening unemployment. Smoot-Hawley has since become a textbook example of how protectionist policy can magnify economic damage.
Modern Echoes: A Cycle Repeating?
Fast forward to the present and we see unsettling similarities.
The Covid-19 pandemic serves as a modern analog to the 1918 flu, disrupting global supply chains and triggering a steep drop in GDP and consumer spending. Unlike the post-WWI period, however, inflation didn’t precede the crisis, it exploded afterward, fueled by pent-up demand and fiscal stimulus, giving rise to persistent “sticky” inflation....and NOT TRANSITORY.
In a similar inversion of sequence, the Trump-era tariffs—modern-day echoes of Smoot-Hawley, were enacted before any major equity downturn, not after. Still, their long-term impact on global trade and supply chain reliability remains a pressure point for the economy.
Most critically, speculation and valuation excess are again center stage. Just as the roaring ’20s were characterized by euphoric risk-taking, today’s U.S. equity market is trading at record-high P/E ratios, despite rising macroeconomic uncertainty and deteriorating breadth.
These historical and contemporary markers suggest we may be approaching the apex of a Super Cycle Wave (III), a turning point that, like its predecessors, may only be fully recognized in hindsight.
It is my contention, that history is currently rhyming.
Best to all,
Chris
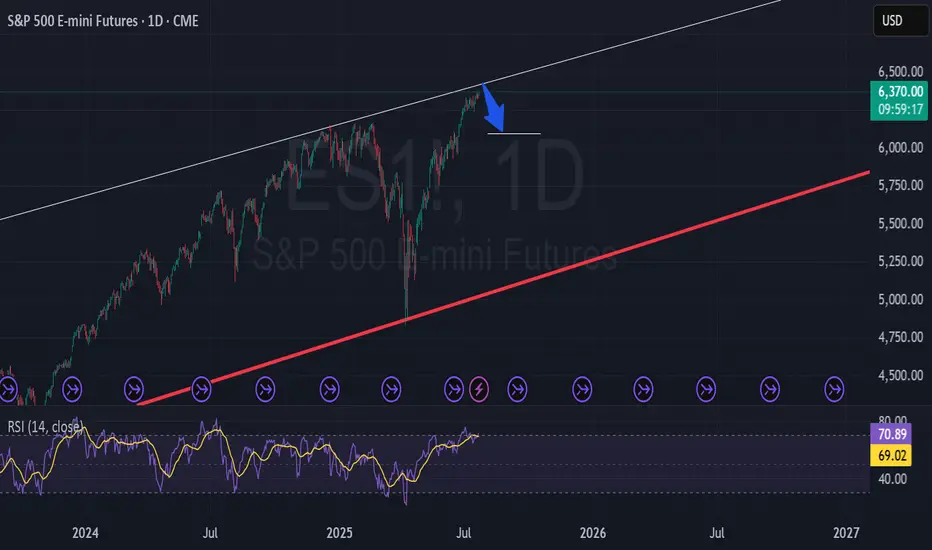
SPY Imagine the SmellImagine the smell from the Bulls if the $514 gap is filled.
Bearish divergence galore.
Not a matter of if this wedge breaks.
Its when.
Stock Market Forecast | TSLA NVDA AAPL AMZN META MSFTStock Market Forecast | CME_MINI:NQ1! CME_MINI:ES1! SPY QQQ
Mag 7 forecast NASDAQ:TSLA NASDAQ:NVDA AAPL AMZN META MSFT GOOG

SPY: Bearish Continuation & Short Signal
SPY
- Classic bearish setup
- Our team expects bearish continuation
SUGGESTED TRADE:
Swing Trade
Short SPY
Entry Point - 637.01
Stop Loss - 638.57
Take Profit - 633.58
Our Risk - 1%
Start protection of your profits from lower levels
Disclosure: I am part of Trade Nation's Influencer program and receive a monthly fee for using their TradingView charts in my analysis.
❤️ Please, support our work with like & comment! ❤️

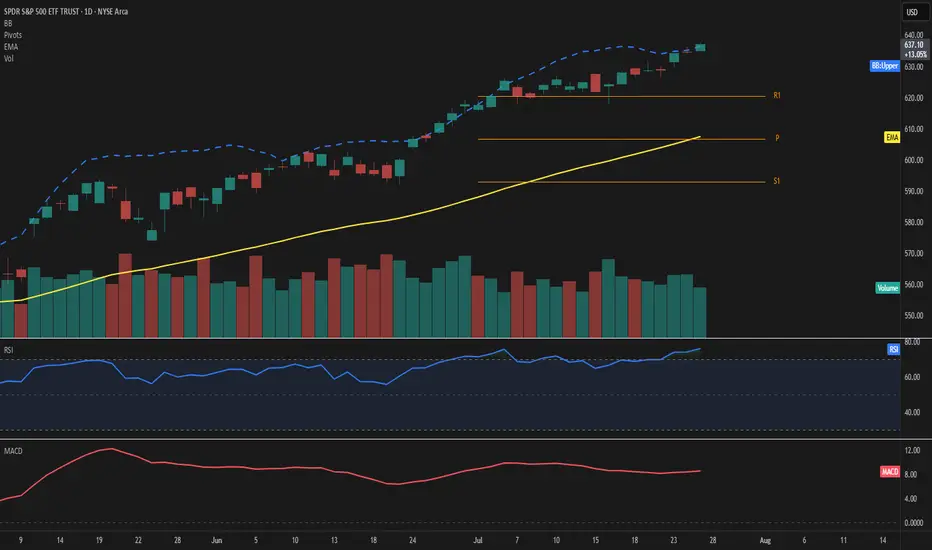
SPY – Explosive strength above resistancePrice extends well above the 50-day EMA and pierces through the upper Bollinger Band, highlighting strong bullish momentum. RSI stands at 76, confirming overbought conditions, while MACD remains firmly positive.
The ongoing move leaves the EMA50 at 608 and the Fibonacci pivot at 607—both now acting as key support levels. With R1 at 620 already surpassed, the next potential resistance zone lies in uncharted territory beyond 636.
Volume has decreased by over 20%, which tempers the move slightly and should be monitored closely.
As long as price holds above 620, the bullish scenario remains valid.
Watch for any sudden spike in volume or a drop back below 636 as a possible shift signal.
$MRVL Nice Risk Reward HereNASDAQ:MRVL is still basing so this could be quite an early trade. However, I did put on a ½ size position yesterday as it rose above the 21 EMA (blue). I like that it is over the AVWAP from the Jan 23rd all-time high (ATH). That means that by price and volume the majority of stockholders are at or near breakeven since that ATH. Which also tells me that there are not many sellers left and that the stock has a chance of entering a stage 2 uptrend.
My current stop will be based on a solid close below the 50 DMA (red). I want to add to my position “if” we can get a good follow-thru day above $75.26.
If you like this idea, please make it your own and follow “your” trading rules. Remember, it is your money at risk.

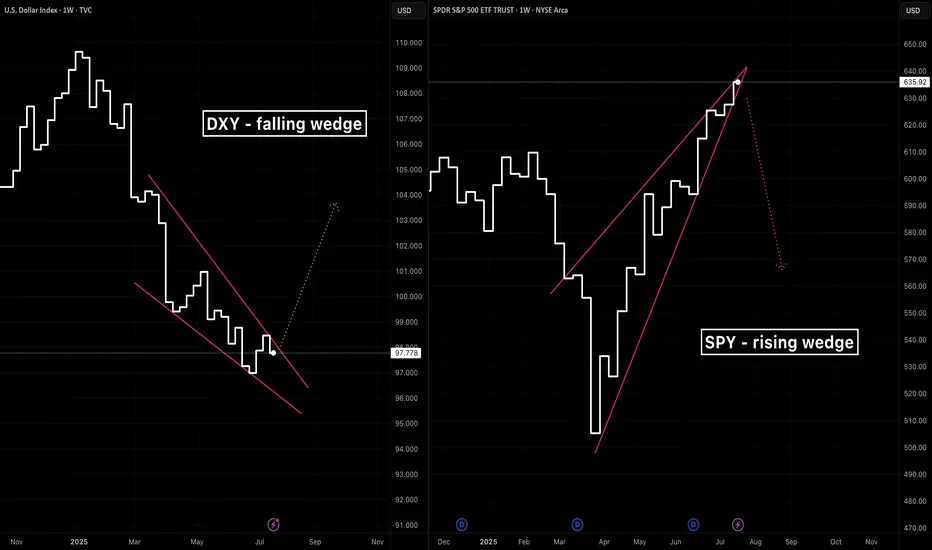
A tale of two wedgesIn early 2025 we’ve seen two classic wedge patterns on two of the market’s most watched charts: a falling wedge on the U.S. Dollar Index ( TVC:DXY ) and a rising wedge on the S&P 500 ETF ( AMEX:SPY ). Alone each tells its own tale—but together they sketch a tug‑of‑war between a fading dollar and resilient equities.
The Falling Wedge on DXY
A falling wedge in a downtrend signals waning bearish momentum and often precedes a bullish reversal once price breaks the upper trendline.
The Rising Wedge on SPY
A rising wedge in an uptrend is classically a bearish reversal pattern —a breakdown below the lower trendline confirms sellers are gaining control.
A Converging Reversal
Given the well‑known inverse correlation between the dollar and most assets, it’s noteworthy that both asset classes are flashing signs of a reversal. Taken together that makes a compelling argument.
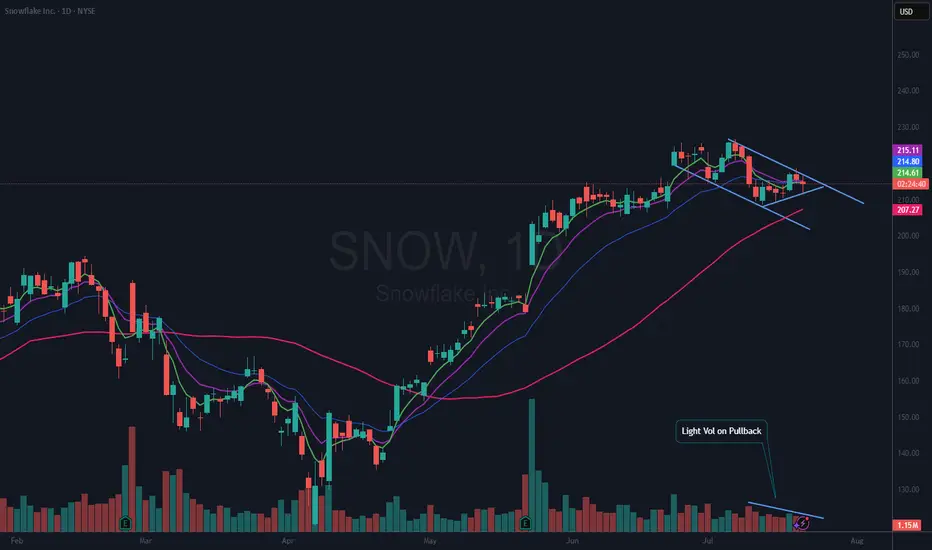
$SNOW Bull Flag?NYSE:SNOW has been and still may be one of the leaders in this market. It is forming a Bull Flag and within that flag is a nice wedging formation.
I am bullish with this name, so I have an alert set on the upper downtrend line. Should it break that, I will look for a good risk reward entry to open a position. It is possible if the market pulls back, that NYSE:SNOW could continue down to test the 50 DMA (red). All TBD.
If you like this idea, please make it your own and follow your trading plan. Remember, it is your money at risk.
In addition, Nvidia NASDAQ:NVDA and Snowflake NYSE:SNOW were among the investors that backed artificial intelligence company Reka's $110 million funding round, Reka said Tuesday.
Reka said the investment will accelerate its technical development efforts and will also scale its multimodal platforms.
The investment boosts the startup's valuation to more than $1 billion from the previous $300 million in a 2023 funding round, Bloomberg reported Tuesday.
Why a USD Bounce Could Trigger a Stock PullbackThe US Dollar has faced brutal selling during the first half of 2025. Some are even questioning whether the Dollar’s global hegemony is at risk. Early in the year the US stock market AMEX:SPY sold off aggressively, falling 19% from mid‑March to early April. Since then stocks have more than regained their losses and the Dollar is still in the tank. So where does that leave us for the rest of the year?
The Dollar Inverse Correlation
The US Dollar has an inverse correlation to most everything. Stocks, bonds, crypto, commodities, real estate — all are measured in Dollars. Therefore when the Dollar loses value, all things equal it takes more of them to reach the same value those assets were denominated at before. Conversely when the Dollar rises, other assets lose value in Dollar terms. Here we can see a long standing inverse correlation to stocks AMEX:SPY
Dollar in oversold territory
The Relative Strength Index (RSI) is a momentum oscillator that measures the magnitude of recent price changes on a scale from 0 to 100 to help identify overbought (above 70) or oversold (below 30) conditions. The Dollar has hit oversold several times so far this year, but not yet staged a material recovery.
Stocks in overbought territory
Meanwhile stocks have staged a blistering rebound off the "Liberation Day" driven selloff earlier this year. The S&P 500 now sits at an all‑time high, and you guessed it, has tapped overbought twice this month.
USD is fundamentally attractive
Because investors seek to earn the highest available yield on their capital, they tend to move funds into currencies offering higher interest rates (and away from those with lower rates), so differences in policy rates across countries create incentives for cross‑border borrowing and lending that drive FX flows. For example the Fed ( ECONOMICS:USINTR ) is at 4.5%, and the ECB ( ECONOMICS:EUINTR ) is at 2.15%. Moreover the Dollar is down significantly against major trading pairs that have lower yields. In our prior example the Dollar is down 11.98% against the Euro YTD (1- FX:EURUSD ), leaving substantial room for capital gains. Gravity could lure FX traders back in the second half of 2025.
Tariff calculus
Tariffs tend to bolster the imposing country’s currency in two main ways: by making imports more expensive they reduce import volumes, improving the trade balance (i.e. fewer foreign‑currency outflows), and by collecting duties in domestic currency the government effectively withdraws that currency from circulation, increasing its relative scarcity. Both effects lift demand for—and support the value of—the home currency.
Putting it all together
Despite the TVC:DXY ’s ~10.8% YTD slide and repeated oversold conditions, the compelling carry trade sets the stage for a USD bounce that, in turn, could pressure overextended equities. With stocks stretched and the Dollar oversold, the carry‑driven rebound in USD could well presage a pullback in equities. Stocks are expensive, Dollars are cheap 🤑

Extended rally off April lows should be completing imminentlyEvery so often, a market move defies conventional expectations of retracement—and the rally off the Liberation Day lows is exactly that. It’s extended longer and climbed higher than even the most bullish forecasts imagined in early April. No one remembers the calls for an imminent recession by most large Wall Street firms.
Now, we're pushing into yet another all-time high—despite glaring negative MACD divergence and a financial media landscape that’s nothing short of euphoric.
The narratives being pushed? Honestly, it’s hard to write them with a straight face:
Tariffs are no longer inflationary. Apparently, I wasted time and tuition learning international trade theory and macroeconomics. Who knew deficits and trade imbalances didn’t matter anymore? Who pays tariffs again? ...never mind.
Weak momentum since mid-May signals not exhaustion—but an “unhealthy absence” of institutional selling, which apparently means the retail trader is in full control now. Because that always ends well... right?

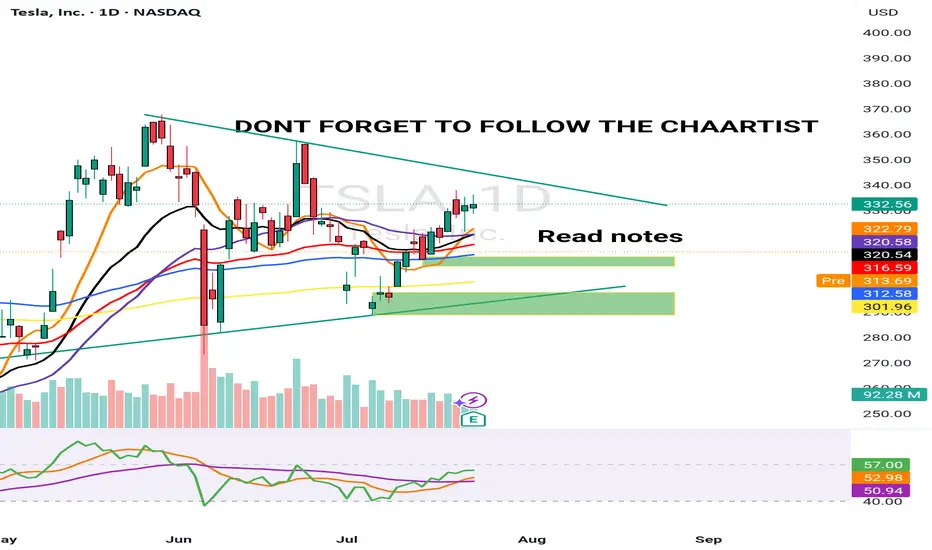
TESLA POST EARNING 24 JULY 2025This is Post earning analysis for Tesla . I have clearly explained all the levels. Please trade carefully & try to stick to your plan.
NOTE: FOLLOW THE LEVELS

TSLA 24 JULY 2025I have marked 2 levels in green boxes. Price is inside this box pre market and TSLA is down -8.5% from the highs of $338 post market till $310 & -7.5% down from yesterday's close
A better level is the lower demand zone but its not the best. Price has not hit any major resistance.
My job is to read the data & trade. I am still bullish & 10% up down move is normal for Tesla &
This could be a "BEAR TRAP".
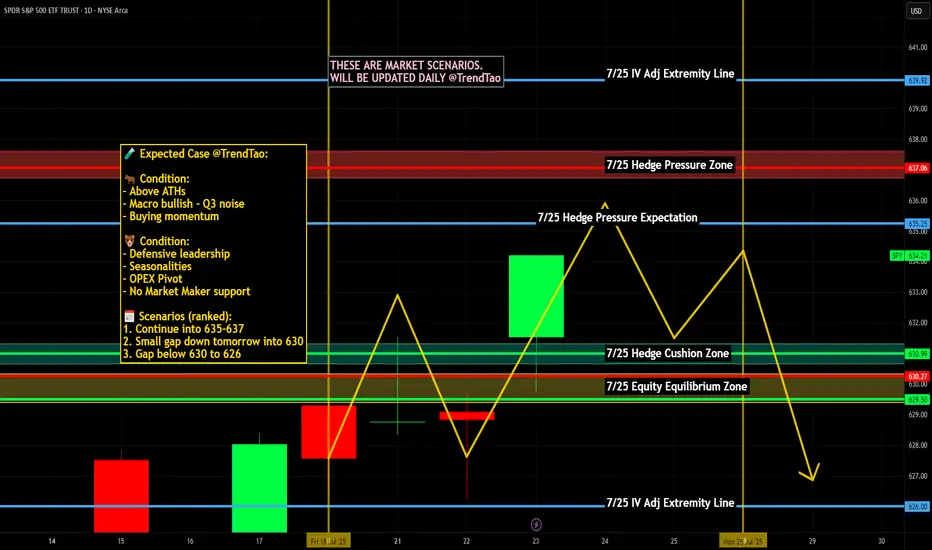
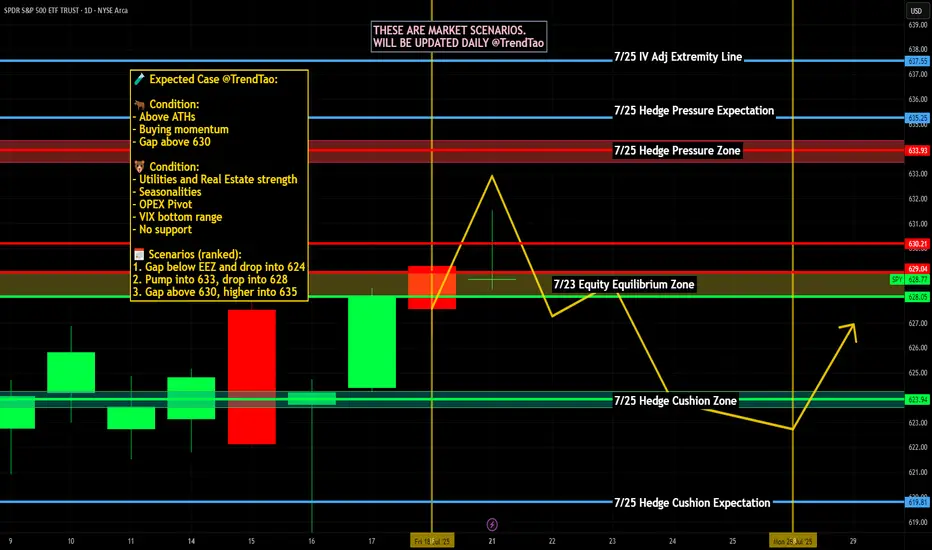
Nightly $SPY / $SPX Scenarios for July 24, 2025🔮 Nightly AMEX:SPY / SP:SPX Scenarios for July 24, 2025 🔮
🌍 Market-Moving News 🌍
🤝 U.S.–EU & U.S.–Japan Trade Optimism Lifts Sentiment
The S&P 500 and Nasdaq hit record-high closes on July 23, fueled by optimism over a potential U.S.–EU trade deal mirroring the U.S.–Japan framework, with the EU-set tariff on autos potentially halved to 15%
💵 Dollar Retreats, Yields Climb
As markets shifted toward risk assets, U.S. Treasury yields increased and gold softened, while the dollar eased—highlighting growing confidence in trade-driven growth news
🏦 Fed Independence Under Pressure—But No July Cut Expected
A Reuters poll shows economists see heightened political pressure on the Fed jeopardizing its independence, though the consensus remains that rates will stay unchanged this month
📊 Key Data Releases & Events 📊
📅 Thursday, July 24:
8:30 AM ET – Initial Jobless Claims
Weekly tally of new unemployment benefit applications—key indicator of labor-market conditions.
10:00 AM ET – New Residential Sales (June)
Tracks signed contracts for new homes, offering insight into housing demand under tightening mortgage rates.
All Day – Trade Headlines & Fed Watch
Continued focus on U.S.–EU trade developments and any follow-up to Fed independence concerns from policy circles.
⚠️ Disclaimer:
This information is for educational and informational purposes only—not financial advice. Please consult a licensed financial advisor before making investment decisions.
📌 #trading #stockmarket #trade #economy #Fed #housing #jobs #technicalanalysis
Altcoin Season Has Started. And A Quick Look At The Stock MarketHey Traders,
Time for me to catch you up on the latest price action in both the stock market and crypto as well as touch upon a few changes on my platform and subscription services and what I plan for the future.
Timestamps:
00:00 | Housekeeping - site changes, etc
04:35 | BTC Dominance
06:45 | DXY Dollar Chart
10:00 | SPY
14:25 | BTC Bitcoin Chart
15:45 | Bitcoin Liquidity Heatmap
17:30 | Solana
19:05 | Ethereum
20:20 | Crypto & Stock Trackers
24:25 | My Indicator
26:10 | Where I Went Wrong & How I Plan To Course Correct
✌️ Stew

AAPL LIVE PRICE ACTION JULY 23 2025This is the price action for AAPL. I have discussed indicators as well. Do not blindly trade without understanding the logics. I am long here with stocks only.
NOTE: DO NOT BLINDLY BUY

Expect Correction august/septemberMarkets MUST correct, everything is overbought and sentiment is Extreme greed. RSI points to extreme overbought territory, VIX very low and not going any lower (reached bottom).
Usually august/september the market corrects. so i expect a correction around 5-8%.
Be prepared, dont chase FOMO. Be careful.
SP:SPX TVC:SPX CBOE:SPX CBOE:XSP AMEX:SPY
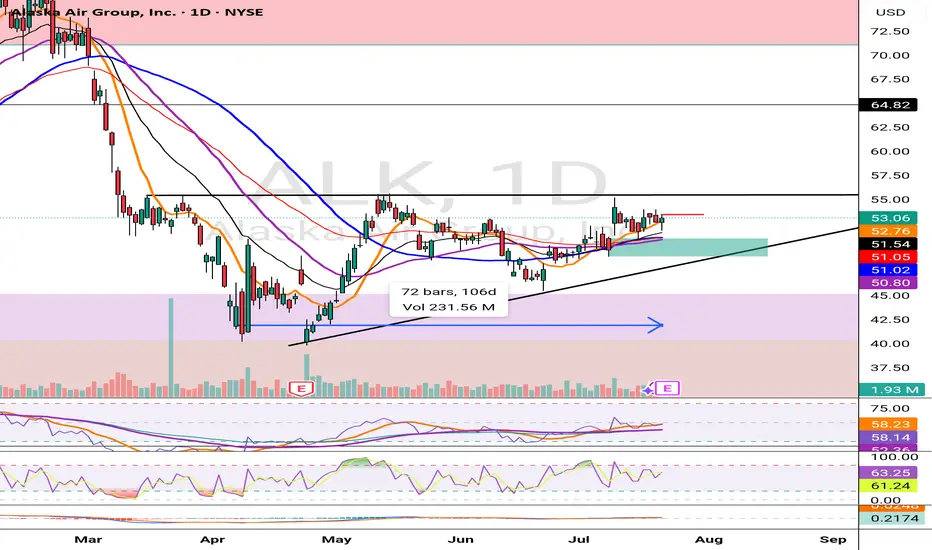
ALK LOOKING BULLISH 22 JULY 2025ALK is looking good to go long at current price. I am going long as it looks very good. If you dont understand a trade then don't push yourself.
NOTE: LONG WITH STOCKS ONLY
TESLA PRICE ACTION 22 JULY 2025This is the price action for Tesla. i have discussed indicators as well. Do not blindly trade without understanding the logics. I am long here with stocks & calls.
NOTE: DO NOT BLINDLY BUY

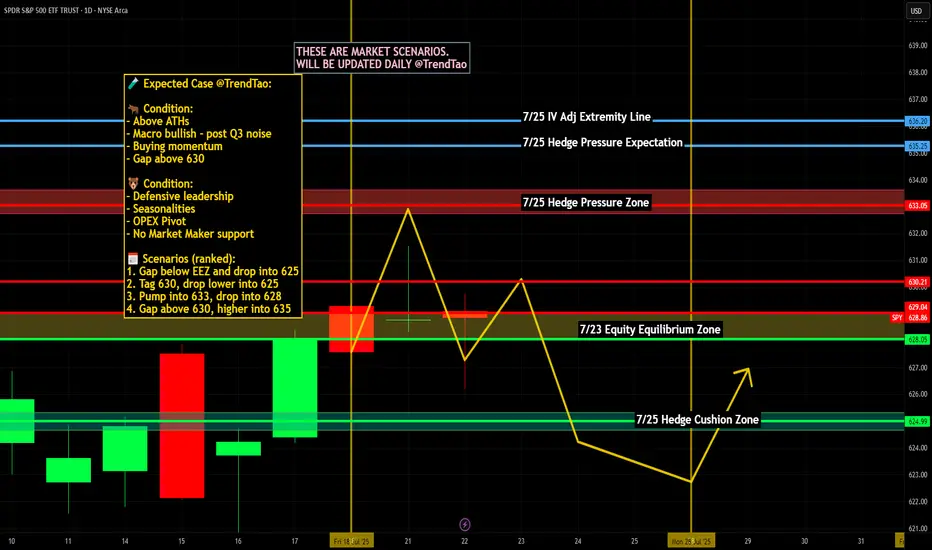
Nightly $SPY / $SPX Scenarios for July 23, 2025🔮 Nightly AMEX:SPY / SP:SPX Scenarios for July 23, 2025 🔮
🌍 Market-Moving News 🌍
📈 Morgan Stanley Stays Bullish
Morgan Stanley reaffirmed its optimistic view, forecasting the S&P 500 will reach 7,200 by mid‑2026. They cited strong earnings and anticipated rate cuts as key drivers, though warned of risks from rising Treasury yields and tariff-related cost pressure
📉 Inflation Debate Reignites
A renewed debate is underway regarding whether tariffs are "transitory" or persistent inflation drivers. Treasury counselor Joseph Lavorgna argued tariff impacts will be one-off, while others caution long-term price pressures may persist, complicating Fed policy directions
🏛️ Calls for Fed Reform Intensify
Treasury Secretary Scott Bessent suggested structural reforms to the Federal Reserve could have greater long-term impact than removing Chair Powell, highlighting ongoing concerns over central-bank governance amid political criticism
💳 Investors Shift to Corporate Bonds
As equity valuations have surged, investors are reallocating toward investment-grade corporate bonds, reducing credit spreads to the tightest levels since 1998—a sign of elevated risk appetite balanced with caution
📊 Key Data Releases & Events 📊
📅 Wednesday, July 23:
(No major U.S. economic releases)
Market focus remains on tech earnings (Tesla, Alphabet) and Fed signals following Tuesday’s Powell address.
⚠️ Disclaimer:
This information is for educational/informational purposes only and does not constitute financial advice. Please consult a licensed financial advisor before making investing decisions.
📌 #trading #stockmarket #economy #tariffs #Fed #earnings #corporatebonds
SPY Options Analysis Summary (2025-07-22)
🔻 AMEX:SPY Weak Bearish Put Setup (0DTE) – 07/22/25
All models agree: price is weak, momentum is limp, and VWAP is above.
But conviction? Not unanimous. High-risk, high-reward 0DTE scalpers only.
⸻
📉 Trade Setup
• 🟥 Direction: PUT
• 🎯 Strike: $626.00
• 💵 Entry: $0.57
• 💰 Target: $1.70 (+200%)
• 🛑 Stop: $0.28 (–50%)
• 📅 Expiry: Today (0DTE)
• ⚖️ Confidence: 65%
• ⏰ Entry Timing: Market Open
⸻
🧠 Multi-AI Consensus
Model Bias Action
Grok/xAI Weak Bearish ⚠️ No Trade
Claude Weak Bearish ⚠️ No Trade
Gemini Bearish ✅ $627 Put
Llama Moderately Bearish ⚠️ Conservative Put
DeepSeek Bearish ✅ $626 Put
🔹 VWAP < Price = Bearish bias
🔹 RSI = Neutral → watch for fakeouts
🔹 VIX favorable (<22)
🔹 Volume = weak = risk of whipsaw
⸻
⚠️ Risk Notes
• Bounce risk off session lows is real
• Lack of momentum may cause theta burn
• Best for scalpers who react fast — not a swing trade
• No conviction = smaller size, tighter leash
⸻
📢 Tagline (for virality):
“ AMEX:SPY is limping, not bleeding. But if it breaks, 200% comes fast. 0DTE scalpers: this is your window.” 💣

Nightly $SPY / $SPX Scenarios for July 22, 2025🔮 Nightly AMEX:SPY / SP:SPX Scenarios for July 22, 2025 🔮
🌍 Market-Moving News 🌍
🚀 Tech & EV Stocks in Focus Ahead of Earnings
Futures were quiet ahead of Tuesday’s open, but key movers included Astera Labs (+19%), Alphabet (+2.7%), Netflix +2%, and Robinhood –4.9% after being passed over for the S&P 500. Investors are positioning ahead of major tech and EV earnings this week — including Tesla, Alphabet, Lockheed Martin, Coca‑Cola, and Honeywell
📣 Powell Speech Eyed for Rate Clues
Fed Chair Jerome Powell is set to speak at 8:30 AM ET today at the Integrated Review of the Capital Framework for Large Banks Conference in D.C. Markets will be watching for any indications on future interest rate direction
🌏 Japan’s Political Shift Has Little Market Impact
Japan’s ruling coalition lost its upper-house majority over the weekend, but markets remained stable as it was largely expected. The yen held steady, and Asian equities stayed calm amid the holiday—focus remains on upcoming corporate earnings
📊 Key Data Releases & Events 📊
📅 Tuesday, July 22:
8:30 AM ET – Powell Speech: Key address at the bank regulation conference. Tone and forward guidance may sway bond and equity markets.
After Market Close – Alphabet & Tesla Earnings: Heavyweights due today—market attention will track revenue guidance, especially on advertising, EV demand, and AI.
⚠️ Disclaimer:
For educational and informational purposes only. Not financial advice—consult a licensed advisor before making investment decisions.
📌 #trading #stockmarket #tech #Fed #earnings #AI #infrastructure #volatility
July 21 Special Update : Metals, SPY & More. What's Next.This special update is to highlight why I continue to believe traders should stay very cautious of this rally in the SPY/QQQ/BTCUSD.
Underlying economic data suggest that this is one big speculative rally following the April Tariff collapse.
And, the economic data I see from my custom indexes suggests the markets are moving into a very volatile and potentially dangerous topping pattern.
As I've stated many times in this video. I'm not saying the markets have topped and you should SELL EVERYTHING. I'm suggesting this market is extremely over-valued in terms of the underlying risk factors at play and the very clear data that suggests the markets are already in a recessionary price trend.
You may ask, "How can the markets continue to rally like this in a moderate recession?".
The answer is simple.
All bubbles end with a super-speculative phase. This phase is where everyone piles into a euphoric attempt to ride the rally higher.
It happened in the late 1990s. It has happened again through the 2000-2005+ housing bubble. Heck, it has occurred in the collectors market over the past few decades where people spent fortunes on the "hottest items" (think Beanie-Babies) only to find out they bought at the height of the bubble.
That is why I continue to urge traders to remain cautious and to withdraw profits from this speculative rally phase. Protect your investment capital immediately and consider the risks associated with the information I share in this video.
I'm not trying to scare anyone. I'm just trying to be realistic in terms of what I see in my data and why I believe now is the best time to MOVE TO SAFETY.
My data suggests that the markets are about to enter a fragile and potentially dangerous pullback phase. If you want to ride it out - go for it.
Otherwise, prepare for significant volatility over the next six months or more.
Get some.
#trading #research #investing #tradingalgos #tradingsignals #cycles #fibonacci #elliotwave #modelingsystems #stocks #bitcoin #btcusd #cryptos #spy #gold #nq #investing #trading #spytrading #spymarket #tradingmarket #stockmarket #silver
