Is Stock Market Bottom Here or Continue Crashing?Stock Market Analysis | NASDAQ:QQQ AMEX:SPY
Mag 7 Analysis | NASDAQ:TSLA NASDAQ:NVDA AAPL AMZN META GOOGL MSFT
SPDR S&P 500 ETF (SPY)

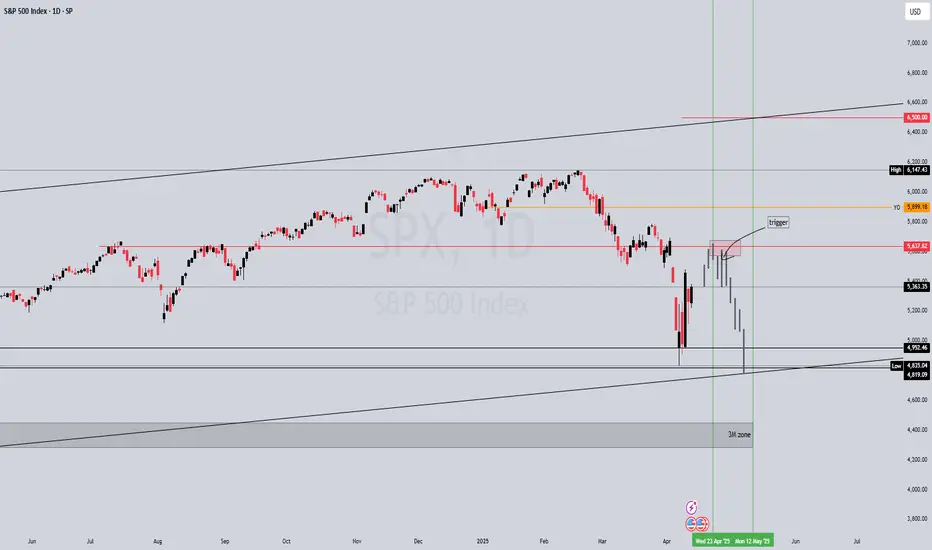
SPY, More pain to come? SPY / 1D
Hello Traders, welcome back to another market breakdown.
SPY is showing strong bearish momentum, breaking below resistance. However, the price is in the oversold zone for now. Hence, instead of jumping in at current levels, I recommend waiting for a pullback into the middle of the range zone for a more strategic entry.
If the pullback holds and sell mode confirms, the third leg lower could target new lows.
Stay disciplined, wait for the market to come to you, and trade with confidence!
Trade safely,
Trader Leo.
SPY/QQQ Plan Your Trade Overview For 4-12 : Thank youThis video is mostly a big thank you for all the great comments and questions over the past few weeks.
I've been posting these videos on TradingView for almost a year and the types of viewers/followers I've been gaining is incredible.
You guys & gals have really impressed me with your questions and engagement. Many of you follow me for months without ever commenting or asking any questions.
I received a call from a client/follower in Alberta last night and he reported last week's gains at over 300% by following my videos.
I received a message from another TV follower saying he's been following my videos for many months and, after a bad loss a few years back, he has decided to give trading another go.
I've stated it before and I'll keep saying it.. I'm not trying to scam you out of anything. I'm trying to show you the RIGHT SKILLS and TECHNIQUES for you to learn to become a better, more skilled trader.
The way I look at it is like this...
If I can teach you half of what I know and see on the charts, then you guys will be able to achieve so much greater success and have gained/retained the knowledge to do it on your own.
You watch me do it over and over on these charts. Guess what - you are LEARNING at the same time.
Now, after a couple of years of doing this and following my videos, you've GAINED an education on how to trade more efficiently, manage risk more efficiently, and achieve your trading goals (I hope).
Right now, I'm getting messages/comments from people saying they are making 200%, 300%, 500%, or more every week or two from my videos.
That is absolutely incredible. I just want to urge you to remember I'm not 100% perfect in predicting the markets. No one EVER really is 100% perfect at it.
In the long run, as long as you don't get super greedy, you'll survive any minor losses and live to trade another day.
That is probably the most important thing I can teach you - trade within a proper scale to your RISK LEVEL. Never BET THE FARM on your trades. Always have a 50% to 70% cash reserve.
Anyway. Thank you. I really appreciate all of you.
Hope you enjoy this video.
#trading #research #investing #tradingalgos #tradingsignals #cycles #fibonacci #elliotwave #modelingsystems #stocks #bitcoin #btcusd #cryptos #spy #gold #nq #investing #trading #spytrading #spymarket #tradingmarket #stockmarket #silver

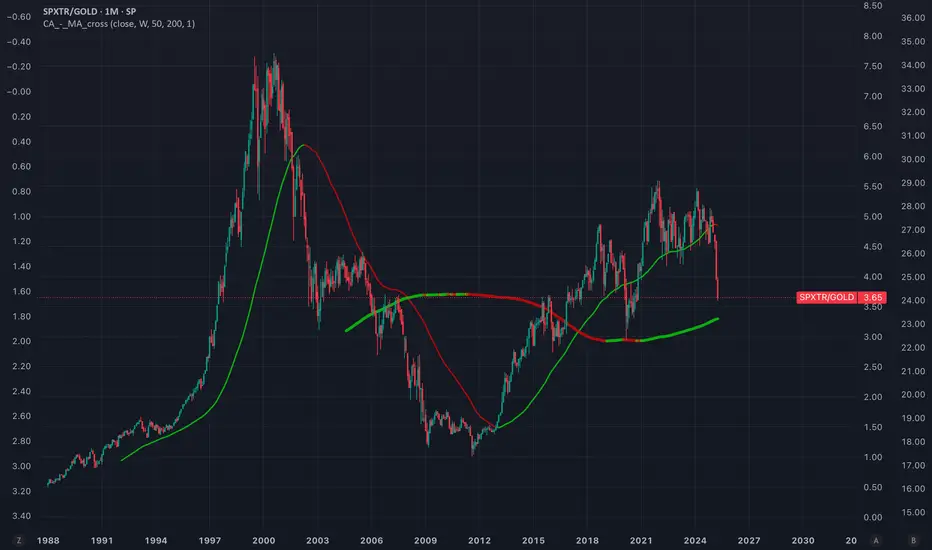
SPX/GOLD ratio near to key supportcrossing below moving average of 200 months could trigger a secular movement in favour of gold.
Potential global debt colapse and lack of confidence in USD + high valuation, mag-7 concentration and high growths expectations on AI are macro/fundamental facts that supports this idea.
Barrick Gold (strong buy) I want you guys take a look at some things real quick
Current Environment Macro Landscape:
Defensive + Hard Assets -
Gold, Miners, Energy, Real Estate (inflation hedges)
AI & Mega Cap Tech -
MSFT, NVDA, AMZN — inflows
China / Trade War Plays -
FCX, CAT, Global Industrials
Reflation / Commodity Rotation-
Oil, Copper, Uranium, Ag plays
gold:
safe haven play amid geopolitical risk and tariffs
Strong correlation with real interest rates + USD — lower rates + weaker dollar = bullish
Tariffs = inflationary = bullish for gold
Strong gold reserve base + relatively low AISC
copper:
1. China Tariffs = Industrial Policy Countermoves
If the U.S. imposes more tariffs on China, China could respond with stimulus or infrastructure spending — which increases demand for copper.
China is the world’s largest consumer of copper, and its response to tariffs often includes pro-growth policies.
2. Copper is Critical for EVs, Grids, and Renewables
Global push toward electrification, clean energy, EVs, etc., requires a massive amount of copper.
Demand is secular, not cyclical — even if tariffs temporarily suppress growth, the long-term demand curve is strong.
3. Tight Supply Outlook
Copper supply is constrained globally. Many copper mines are aging, with long lead times for new projects.
Barrick is developing world-class copper assets (e.g., Reko Diq in Pakistan — one of the largest undeveloped copper-gold deposits in the world).
lets not forget the most revenue being generated from operations comes from their Nevada mines.. US PRODUCTION
gold barrick isnt the only mining company money is moving to, take some thought into moving money to commodities

April 11th Trade Journal & Market AnalysisApril 11th Trade Journal & Market Analysis
EOD accountability report: +1566.50
Sleep: 6 hour, Overall health: going thru Flu symptoms
**Daily Trade Recap based on VX Algo System **
12:08 PM Market Structure flipped bullish on VX Algo X3!
1:00 PM VXAlgo ES X1 Sell Signal (2x Signal)
Today was a very choppy for the early part of the day, tested pre market lows and almost broke it because of consumer sentiment.
We eventually bounce and started moving upward toward the 5 min and 10 min resistance , and eventually broke out with the market structure flipping bullish at 12:08, we went back for a 1 min MOB backtest and pushed up further.
Monday plan; look for back to support as noted on the video

Trump Tariffs - Trade War - High Volatility - Key LevelsEasy trading for 2025, right? Haha
We are seeing some of the wildest swings ever in the markets
Extreme intraday swings and volatility is getting everybody's attention
This video discusses all key levels and current seasonality
Hoping for the best and preparing for the worst

SPY/QQQ Plan Your Trade For 4-11 : Break-Away in CarryoverToday's Break-away pattern suggests the SPY/QQQ will attempt to move (break) away from yesterday's Body range. I believe this trend, after the recent Ultimate Low in price, will be to the upside.
I know a lot of people are asking, "why do you think the markets are going to rally now - after you suggested the markets would trend downward?"
Things have changed now that we have a 90-day pause in the tariff wars. Yes, China is still an issue - but the rest of the world seems to have a pause on the tariff wars as negotiations continue.
I believe the removal of the tariff pressure on the markets will result in a moderate upward trend as we move into Q1:2025 earnings season.
Still, I don't believe we will see new ATHs anytime soon. But I do believe the 580+ level on the SPY is a potential high price level that can be reached before the end of April 2025.
Gold and Silver are moving into a GAP trend move today. I believe the GAP will be to the upside and I believe Gold and Silver will continue to rally.
Silver is really low in terms of comparison to Gold. Silver could make a very big move to the upside over the next 30+ days.
BTCUSD is still consolidating into the narrow range I suggested would happen before the bigger breakdown event near the end of April (into early May).
Everything is playing out just as I expected. The big change is the removal of the tariffs for 75+ nations (for now). That will give the markets some room to the upside and we need to understand how price structure is playing out into an A-B-C wave structure.
Get some.
#trading #research #investing #tradingalgos #tradingsignals #cycles #fibonacci #elliotwave #modelingsystems #stocks #bitcoin #btcusd #cryptos #spy #gold #nq #investing #trading #spytrading #spymarket #tradingmarket #stockmarket #silver

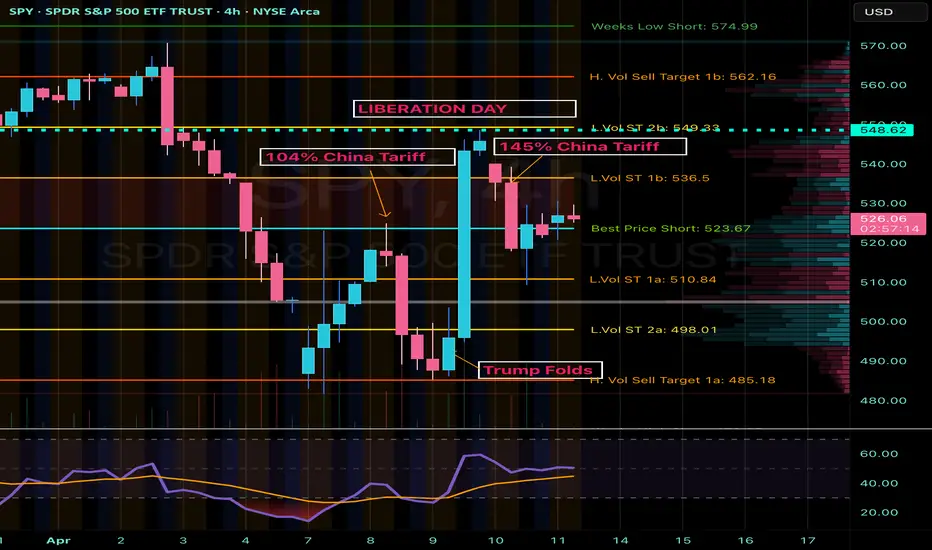
SPY Analysis: Navigating Tariff-Induced VolatilityContinuing from my last update, market volatility remains high due to Trump's unpredictable policy decisions. After initially folding and offering economic relief, Trump pivoted sharply with a sudden 145% tariff announcement. Today, China countered strongly with a 125% tariff. These escalating tariff exchanges continue to create significant uncertainty and market fluctuations, highlighting the critical need for careful analysis and precise trade management.
Technical Breakdown (4-Hour Chart)
Current Price Zone: Around $528.45
Key Resistance Levels:
- Immediate Resistance: $536.50 (L.Vol ST 1b)
- Critical Resistance: $549.33 - $549.60 (L.Vol ST 2b)
- Major Resistance Zone (Liberation Day): Approximately $562.16
Support Levels:
- Initial Support: $523.67 (Best Price Short)
- Secondary Support: $510.84 (L.Vol ST 1a)
- Important Lower Support: $498.01 (L.Vol ST 2a)
- Strong Support Level (Trump Folded area): ~$485.18
Trading Scenarios
Bullish Scenario (Potential Tariff Tension Relief):
- Entry Trigger: Confirmed breakout and sustained hold above resistance at $536.50.
Profit Targets:
- Target 1: $549.33 (next strong resistance level)
- Target 2: $562.16 (major resistance)
- Stop Loss: Below immediate support at $523.67, carefully managing downside risk.
Bearish Scenario (Ongoing Tariff Escalation or Increased Market Fear):
Entry Trigger: Inability to reclaim $536.50, or a decisive breakdown below support at $523.67.
Profit Targets:
- Target 1: $510.84 (nearest significant support)
- Target 2: $498.01 (secondary critical support)
- Target 3: $485.18 (robust support area)
- Stop Loss: Above resistance at $536.50 to protect against potential reversals.
Thought Process & Final Thoughts
The SPY currently trades within clearly defined resistance and support bands, heavily influenced by unpredictable tariff-driven headlines. Trump's volatile policy shifts and China's assertive retaliations amplify short-term market risks. Maintain flexible trading strategies, adhere strictly to established levels, and practice disciplined risk management. Continuous monitoring and swift response to evolving market sentiment will be essential for navigating this challenging environment effectively.
Gold ETF(GLD) - Gold is the Safe Haven?Is Gold the safe haven from all the market turmoil? Looking at the chart, it would appear that Gold is unfazed by current market conditions. Price is still making All-Time Highs as price continues to swing above the 25(green), 100,(yellow) and 200(blue) day EMAs. Further fears in the Bond market may increase interest in Gold as a stable asset. What are you thoughts? What are some other assets that are defying 'gravity'?

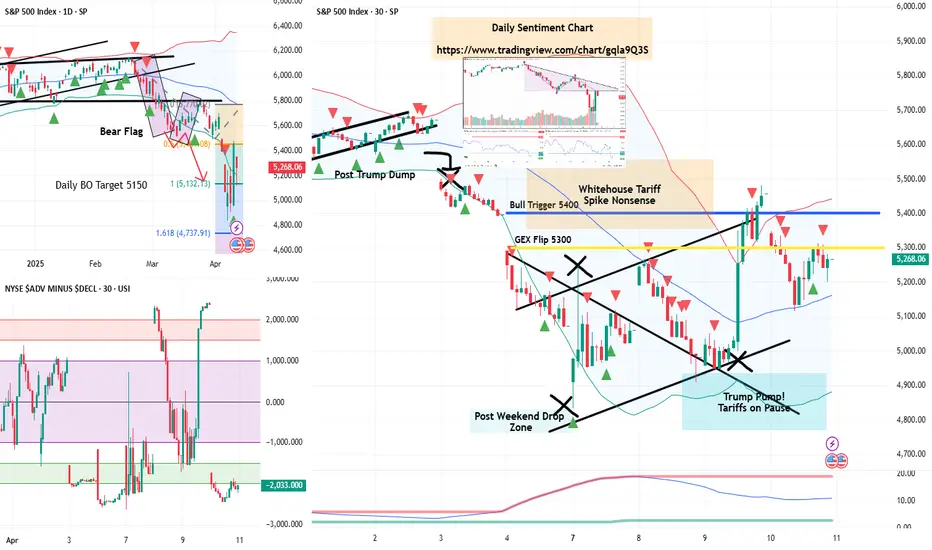
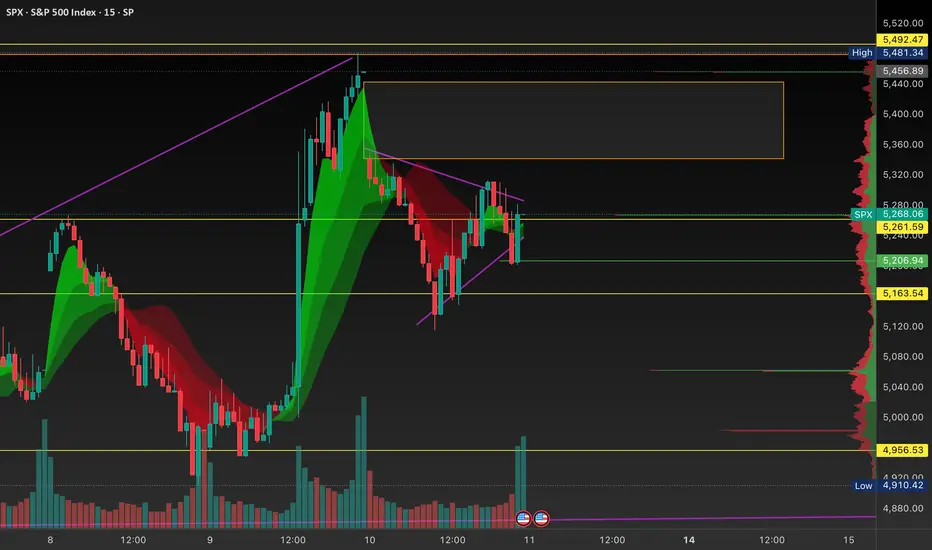
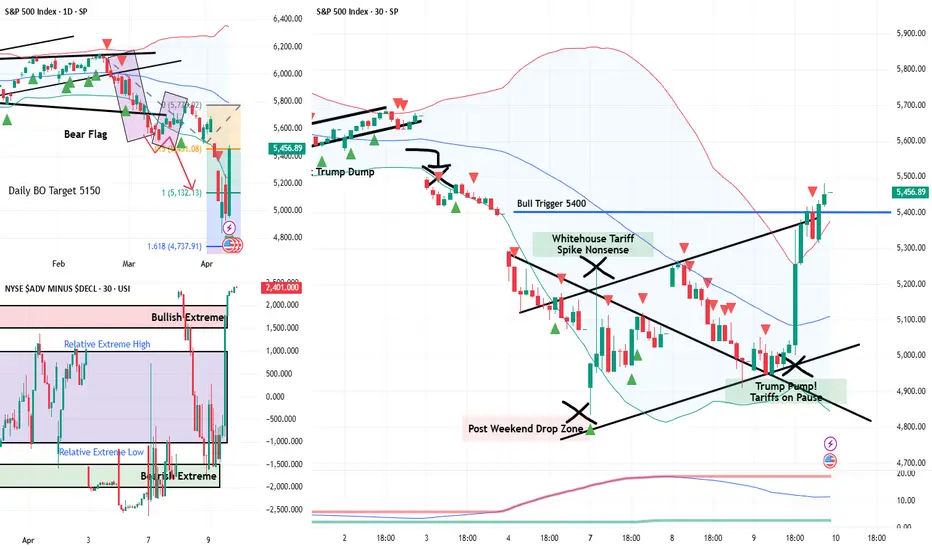
Just Let Me Cash Out Before the Weekend | SPX Analysis 11 April Let’s be honest…
This week has been ridiculous.
The market pumped harder than a spin class on espresso because of a rumour.
Then dumped.
Then teased a breakout.
Then decided against it mid-sentence.
It’s been a full-blown rollercoaster of overreactions, headline bait, and “wait, what did Trump say now?” moments.
But amidst the noise, the plan is still holding up.
5400?
Still resistance.
Still our pivot level.
Still doing its job.
---
👁️ Trader’s Eye View – Charting the Nonsense
Let’s recap what I’m seeing:
📉 Earlier this week, the 5400 bull trigger got pierced by an emotional market surge.
But there was no confirmation, no sustained breakout – and we’ve reversed since then.
Now?
We’re seeing the start of a rising channel – but every turn seems to align with a tweet, a walk-back, or a reaction to misread data.
It’s like price is drawing patterns using the tip of a headline.
That’s not conviction.
That’s chaos dressed as structure.
🧭 What I’m Doing Now
📌 Still bearish below 5400
📌 Watching for a move to 5000 or the rising channel low
📌 Will use Tag ‘n Turn, Pulse Bars, and GEX flips for entries
The ideal scenario?
Let my bear swing cash out before the close, pour something brown into a glass, and avoid blood pressure spikes over the weekend.
That’s the play.
---
🎯 Expert Insight – When the Chart's Not Lying, But the Headlines Are
Mistake:
Assuming a spike equals a breakout. Trading on headline strength instead of chart strength.
Fix:
Let the level prove itself.
5400 is my line in the sand – not because I said so, but because price keeps reacting to it.
That’s structure. That’s what we trade.
---
Fun Fact
In 2020, the average headline-related spike in SPX lasted under 37 minutes before mean-reverting.
This week?
We saw multiple trillion-dollar reactions last less than half an hour.
It’s not a breakout if it’s a sugar rush.
Warning: what can save us from a collapse: must read.⚠️This analysis isn’t purely chart-based, but in this macro environment, understanding the bigger picture is essential for predicting market movements. Hopefully, TradingView will allow this idea so that everyone can read it.
What Can Save Us?
Before looking for a solution, we must first acknowledge the problem—and then determine if and when a resolution is coming.
1. Trump’s Tariffs & Policies: A Market Shock
Trump’s economic strategy marks a radical departure from the policies of the past 30 years. However, previous administrations weakened U.S. global influence, shifting power in favor of China.
Since Trump's motto is "Make America Great Again", serious changes are inevitable. Until investors fully grasp these policies, uncertainty will persist.
Let’s break down the key areas of impact and Trump’s expected responses:
2.Monetary Policy & The Federal Reserve
The Federal Reserve (FED) and Jerome Powell are not aligned with the White House.
Powell is sticking to his monetary policy approach, but Trump needs 0% interest rates to implement his vision.
Markets hate uncertainty, and this is fueling volatility.
🔴 Trump's Response:
Expect a bombshell move—Trump will fire Jerome Powell and replace him with a Fed chairman who supports rate cuts to 0%. This will cause short-term chaos but ultimately fuel a massive market rally as:
✔️ The housing market recovers
✔️ Liquidity surges
✔️ Stocks skyrocket
3.U.S. Dependence on China & Russia for Raw Materials
The U.S. imports essential resources from China and Russia, making it vulnerable.
The BRICS alliance is strengthening, further threatening U.S. dominance.
🔴 Trump's Response:
Trump has openly expressed interest in acquiring Greenland, citing its rich natural resources. He will take it by military force if necessary, positioning the U.S. as a raw material powerhouse on par with Russia.
4.Lost Allies: Canada, Mexico & South America
Canada is aligning with Europe
Mexico & South America are leaning towards BRICS
🔴 Trump's Response:
To counter this:
Canada will be pressured into rejoining a U.S.-led trade bloc—or face potential annexation.
South American economies will be crippled by tariffs, forcing them to reintegrate under U.S. influence.
5.Geopolitical Conflicts: Middle East & Ukraine
Iran is aligned with Russia & China
Ukraine relies on Europe (France, UK, EU), rather than the U.S.
The U.S. is not benefiting from these wars
🔴 Trump's Response:
If Zelensky continues to align with Europe, Trump may order a full-scale U.S. bombing of Ukraine, flatten Kyiv, eliminate Zelensky live on TikTok, and then split Ukraine with Russia.
This move would:
✔️ Strengthen U.S.-Russia relations
✔️ Secure a deal on Greenland
✔️ Humble Europe
6.Conclusion: A Global Power Shift
Expect a period of chaos and fear. However, what investors must understand is that Trump is 100% serious about these moves—and he will execute them regardless of global opinion.
If Trump’s strategy works:
✅ The U.S. will regain dominance
✅ Markets will rally hard
✅ Confidence in the U.S. economy will be restored
If Trump fails:
🚨 A prolonged economic downturn (15-20 years of stagflation)
🚨 U.S. & Europe suffer major losses
🚨 Best move? Relocate to Asia or the Middle East before the crash.
So, even if Trump’s policies seem insane, the best-case scenario is that he succeeds.
💡 DYOR (Do Your Own Research)
#Bitcoin #Crypto #Trump #MAGA #Geopolitics #StockMarket #SPX500 #Trading #Investing #Economy #FederalReserve #RateCuts
SPX: Roller Coaster Fest. Looking for a possible short?Not FA*
A lot of set ups looking like flags. Missed the move up but caught puts today for good profit. Or decent profit. I have yet to conquer on how NOT to sell too early? Anyone have any tips?
Set up I’m seeing right now (SPY/SPX): Looks to be flagging.
Green Ray for a short entry
Overall sentiment still feels very bearish. Trump seemed to postpone the tariffs to prevent this market from tanking into near *recession* touches but some say it was a manipulative swing?
So thinking we sell off Friday - as China tariff deal still yet to solidify. A lot of uncertainty overall.
Also on the 1M, the set up looks like a bear flag.
Let me know what you guys think and any insight is welcome! Still new to TA and really wanting to get better at understanding charts/levels. Goal is to be consistent in trading and profitable, very profitable.
GLHF
April 10th Trade Journal & Market AnalysisEOD accountability report: +$3087.50
Sleep: 6 hour, Overall health: going thru Flu symptoms
**Daily Trade Recap based on VX Algo System **
10:27 AM VXAlgo ES X1 Buy signal (double buy signal)
12:30 PM VXAlgo NQ X1 Buy Signal (triple buy signal)
1:45 PM VXAlgo NQ X3 Buy Signal (triple buy signal) + market structure = A+ set up
Took some time off the last few days from trading futures to
re-organize the options account and long term port, got back into trading futures today.

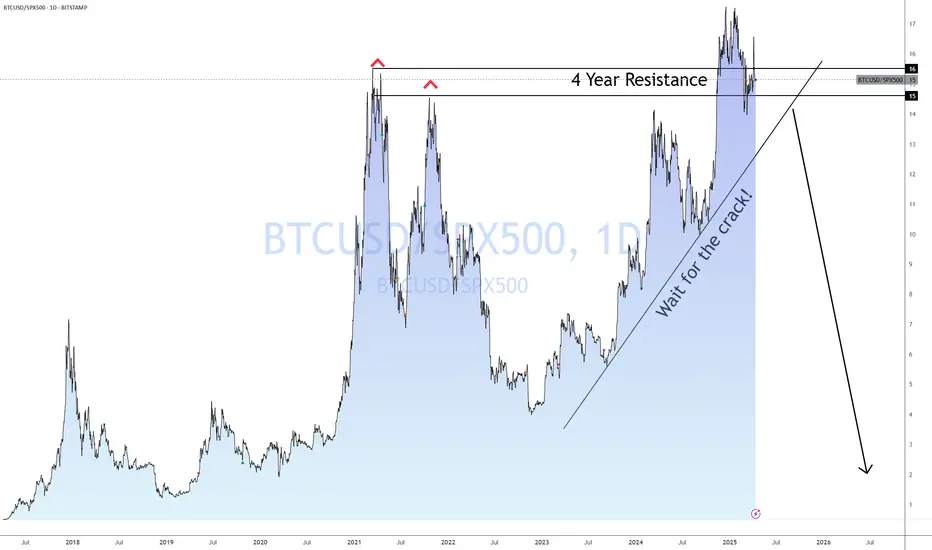
BTC SPX Ratio At Its LimitsAs BTC has matured, it has revealed its limits relative to SPX. Any time the price rises above 15, a correction follows.
While it has not yet cracked I find myself violating my own rules again and compelled to share this chart with you BEFORE the crack.
Markets are volatile and I am simply trying to keep people from getting hurt. Do not make the mistake of thinking BTC is a safe asset.
Bulls best to take profits.
Click boost, follow, subscribe, and let me help you navigate these crazy markets.
SPY PRICE ACTION 10TH APRIL2025Spy further price action is here. I have discussed all the potential buying levels and do not go long at current price as we are into a supply zone.
Feel free to leave a comment
NOTE:WAIT AS WE ARE INTO A SUPPLY

SPY/QQQ Plan Your Trade For 4-10 : FLAT-DOWN PatternToday's Flat-Down Pattern suggests the SPY/QQQ will struggle to move away from yesterday's big open-close range.
Normally, I would suggest the Flat-Down pattern will be a small, somewhat FLAT price move.
But, after yesterday's big move, the Flat-Down pattern can really be anywhere within yesterday's Daily Body range.
So, we could see very wild volatility today. That means we need to be prepared for general price consolidation (which suggests somewhat sideways price trending) and be prepared for some potential BIG price trends within that consolidation.
These BIG price trends would be more like bursts of trending, while still staying somewhat consolidated overall.
Watch today's video to learn how the Excess Phase Peak pattern is dominating the trend right now (in the Consolidation Phase).
The same thing is happening in BTCUSD. BTCUSD has been in an EPP Consolidation phase for over 35+ days now.
Gold and Silver are setting up a CRUSH pattern today. That could be a VERY BIG move higher (or downward). Given my analysis of Gold acting like a hedge (a proper hedge for global risk levels), I believe today's move will EXPLODE higher.
Gold is already in an early-stage parabolic bullish price trend. When gold explodes above $3500, I believe it will quickly gain momentum towards the $5100 level.
Right now, Gold is recovering from the Tariff news and about to explode upward (above $3200) if we see this CRUSH pattern play out well.
Thank you again for all the great compliments. I'm just trying to share my knowledge and skills with all of you before I die. There is no need to carry all of this great information and technology to my grave.
So, follow along, ask questions, learn, and PROFIT while I keep doing this.
Get some.
#trading #research #investing #tradingalgos #tradingsignals #cycles #fibonacci #elliotwave #modelingsystems #stocks #bitcoin #btcusd #cryptos #spy #gold #nq #investing #trading #spytrading #spymarket #tradingmarket #stockmarket #silver

Trump Pump Just Broke the Charts12% Up in a Day. Now What?
What a difference a headline makes.
Monday:
Markets dump. Panic. Retail sells the low.
We hit our bearish targets like clockwork.
Wednesday:
Markets explode like they found a cheat code.
SPX rallies 9.5% in a day.
Nasdaq? A completely unhinged 12% up.
All because… tariffs might be paused again.
You can’t make this stuff up.
But you can trade it.
When Euphoria and Edge Collide
The Trump Pump Parade
After last week’s fake-news-induced dump, we now have headline euphoria.
No earnings beat. No rate cut. No macro shift.
Just one rumour:
“Trump might pause tariffs.”
Cue the biggest one-day rally since 1933.
Nasdaq: +12%
SPX: +9.5%
SPX now kissing the 5400 bull trigger level
Financial media?
Throwing a rave.
Retail?
FOMOing back into the top.
It’s madness.
But it’s not structure.
The System Trader’s Reality
Meanwhile, in the AntiVestor camp…
The bear swing is still on but under review.
Why? Because we trade levels, not vibes.
And 5400 has always been our pivot.
We’re now sitting right on it, with overnight futures starting to drift lower – like the market just realised it left the oven on.
The decision zone is here.
Hold 5400?
It’s time to shift gears.
Bull thesis activates. Tag ‘n Turn setups. Bull Pulse Bars. GEX Bulls Eye trades.
Lose 5400?
We go right back to feeding the bears.
It’s not emotional. It’s mechanical.
This is what system trading looks like.
---
Expert Insights: The Market Owes You Nothing
Mistake:
Getting emotional after missing a rally or overstaying a short.
Fix:
Use a system with defined levels.
5400 was always the line.
You don’t need to guess the pivot. You just need to trade it when it confirms.
This rally may be overblown.
But until the market proves otherwise, you don’t fight the tape – you ride it with structure.
---
Fun Fact
The last time the Nasdaq moved more than 10% in a day?
March 13th, 2020 – the height of COVID panic buying.
That rally was followed by… a further drop.
Then a V-bottom.
Then a massive bull market.
So… is this the start of something new?
Or just another overcaffeinated bounce?
History says: Don’t decide early. Let price confirm.
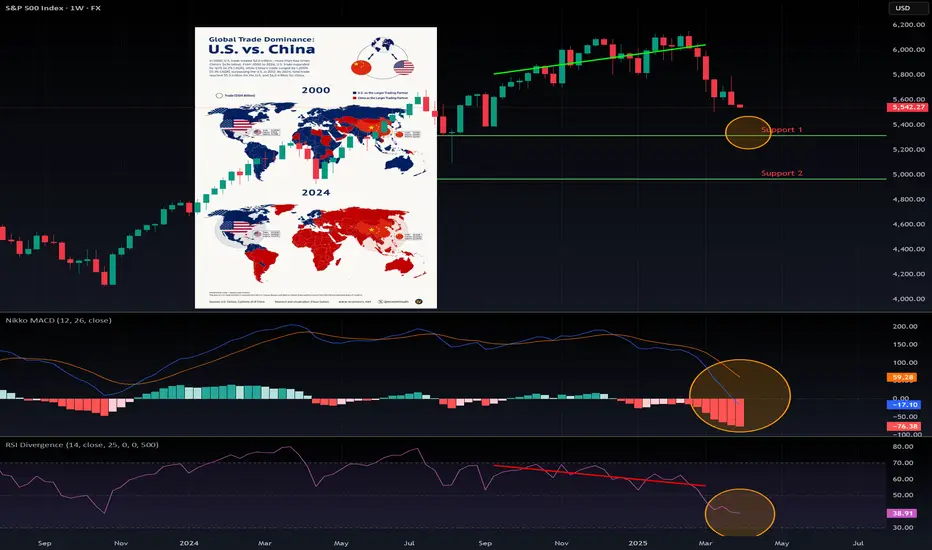
Trump's Second Term Brings Sharpest Market Decline Since 2001It's gone nearly three months or so... (Duh..? WTF.. less than 3 months, really? 🙀) since Donald Trump entered The White House (again).
Those times everyone was on a rush, chatting endless "Blah-Blah-Blah", "I-crypto-czar", "crypto-capital-of-the-world", "we-robot", "mambo-jumbo", "super-duper", AI, VR and so on super hyped bullsh#t.
What's happened next? We all know.. mostly all US stocks and crypto markets turned to 'a Bearish Mode', or to at least to 'a Correction' (that is still actual at this time).
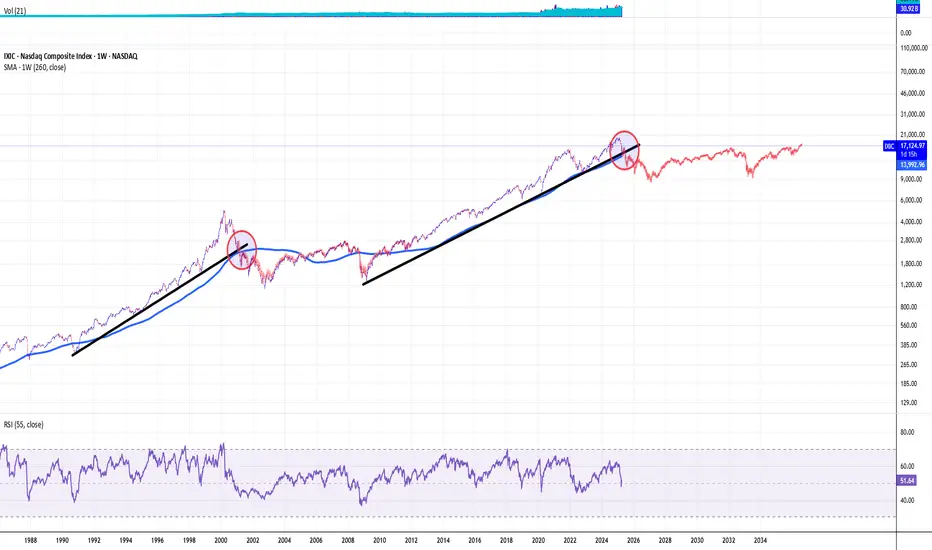
Here's a short educational breakdown for Nasdaq Composite index NASDAQ:IXIC what we think about all of that, at our beloved 💖 @PandorraResearch Team.
Trump's Second Term Brings Sharpest Market Decline Since 2001: Analyzing the recent 15% Stock Market Plunge
President Donald Trump's second term has coincided with a dramatic stock market downturn, with the S&P 500 losing approximately 15% of its value since his January 2025 inauguration. This represents the worst start to a presidential term since George W. Bush in 2001 during the dot-com crash. The decline has erased more than $3 trillion in market value, driven primarily by concerns over trade policies, particularly the implementation of new tariffs.
Market analysts point to growing fears of potential stagflation—a toxic combination of slow economic growth and high inflation—as investor confidence continues to deteriorate despite pre-election expectations of business-friendly policies.
Unprecedented Market Decline Under the New Administration
Historical Context of Presidential Market Performance
The current market downturn stands out in stark relief when compared to previous presidential transitions. The S&P 500 has fallen nearly 10% in the first 10 weeks since Trump's inauguration on January 20, 2025, marking the worst start under a new president since George W. Bush in 2001. This decline is significantly worse than the start of the prior five administrations, with Bush's roughly 18% drop during the dot-com crash being the only steeper decline in recent presidential history. Looking further back, only Richard Nixon experienced a comparable early-term market decline with a 7.2% drop, highlighting the severity of the current situation.
When examining presidential market performance metrics, Trump's second term has already distinguished itself negatively. During the first 50 days, the S&P 500 declined by 6.4%, positioning it among the poorest market starts since 1950. By contrast, the best 50-day starts were achieved by John F. Kennedy (up 9.4%), Barack Obama (up 5.7%), and Bill Clinton (up 4.2%), demonstrating how unusual the current market trajectory is in historical context.
Magnitude of the Current Decline
The scale of market value destruction has been substantial. More than $3 trillion has been erased from the S&P 500's value over approximately 52 trading sessions since Trump's inauguration. By early April 2025, the decline had accelerated to approximately 15% from Inauguration Day, pushing the market dangerously close to bear territory. Market analysts note that if the S&P 500 reaches a 20% decline from its recent peak, it would mark the earliest instance of a bear market during a new administration based on S&P 500 history since 1957.
The tech-heavy Nasdaq Composite has suffered even more severely, with declines exceeding 11% by mid-March. This demonstrates the particular vulnerability of growth stocks that had previously led market gains, now facing the most significant corrections.
Key Factors Driving the Market Downturn
Trade Policy Uncertainty and Tariff Concerns
Trade policy, particularly the implementation and threat of tariffs, has emerged as the primary catalyst for market turmoil. The unpredictable nature of these policies has created significant uncertainty for businesses, investors, and consumers alike. Trump's "on-again, off-again approach to tariffs" has effectively extinguished the optimism that initially buoyed markets following his election victory in November 2024.
The market decline accelerated dramatically after what was termed the "Liberation Day" event, during which Trump announced plans for unprecedented tariff escalation. Two-thirds of the S&P 500's 15% decline occurred after this announcement, prompting Ed Yardeni of Yardeni Research to observe that "Liberation Day has been succeeded by Annihilation Days in the stock market".
Fear of Stagflation and Economic Instability
Many economists have warned that the new tariffs could reaccelerate inflation at a time when economic growth may be slowing, creating conditions for stagflation. This combination is particularly concerning for investors, as it creates a challenging environment for corporate profitability and economic prosperity. The risk that tariffs could trigger this economic condition has effectively neutralized investor optimism regarding other aspects of Trump's agenda, including potential regulatory reforms and tax reductions.
Shift in Market Sentiment
The market has undergone a fundamental transformation in sentiment from the period immediately following Trump's election victory to the current environment. Initially, investors had bid stocks up to record highs, anticipating benefits from tax cuts, deregulation, and business-friendly policies. However, this optimism has been replaced by growing concern about economic direction.
As one market strategist noted, "We have witnessed a significant shift in sentiment. A lot of strategies that previously worked are now failing". The S&P 500 has relinquished all gains made since Trump's November 2024 election victory, representing a striking reversal in market confidence.
Potential Long-Term Implications
Historical Patterns and Future Outlook
Historical analysis suggests that poor market starts during presidential transitions often foreshadow continued challenges. According to SunDial Capital Research strategist Jason Goepfert, rough starts represent a "bad omen" for stocks based on past performance patterns. His analysis indicates that markets typically show a median return of -1.9% six months after such a start, and after a year, they generally remain flat. Among similar historical instances, only four out of ten cases resulted in more gains than losses over the following year.
Administration's Response to Market Decline
Unlike during his first term, when Trump regularly referenced strong stock market performance as evidence of his administration's success, his second-term approach appears markedly different. Some market analysts have noted that "The Trump administration appears to be more accepting of the market's decline, potentially even welcoming a recession to achieve their broader objectives". This shift in attitude has further unsettled investors who previously expected the administration to prioritize market stability.
Technical challenge
The tech-heavy Nasdaq Composite index has recently soared 12% for its best day since January 2001.
But did you know what happened next in 2001? The major upside trend as well as 5-years SMA were shortly broken and market printed extra 40 percent Bearish decline.
Similar with what's happening in 2025..!? Exactly!
Conclusion
Trump's second presidential term has coincided with one of the worst stock market starts in modern American history, comparable only to George W. Bush's entry during the dot-com crash of 2001.
The approximately 15% market decline since inauguration represents a loss of trillions in market value and a complete reversal of the optimism that followed his election. Trade policy uncertainty, particularly regarding tariffs, has emerged as the primary driver of market instability, creating fears of potential stagflation and undermining business confidence.
As historical patterns suggest that poor starts often lead to continued underperformance, investors remain concerned about the market's trajectory through the remainder of 2025 and beyond.
--
Best 'a bad omen' wishes,
Your Beloved @PandorraResearch Team 😎
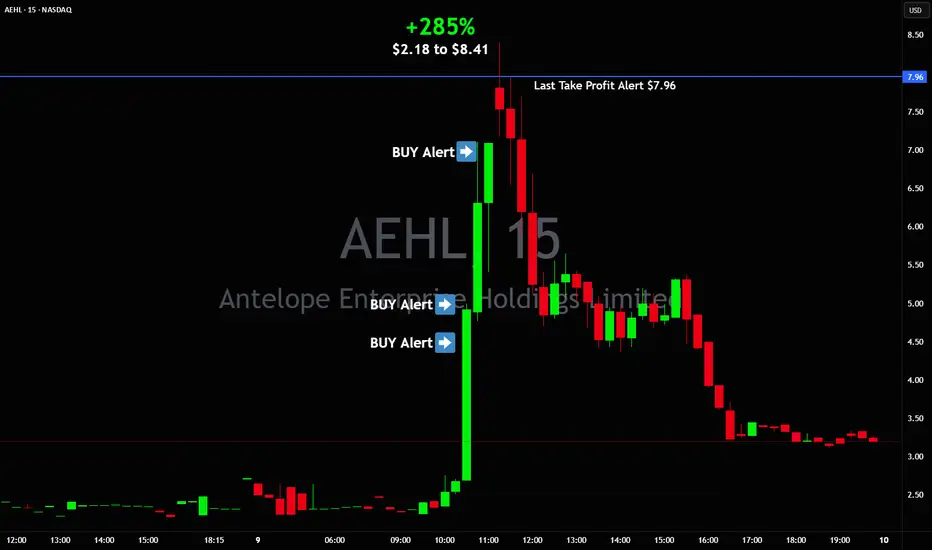
$2 to $8 with 3 Buys, this is how printing money feels like 🖨️💵 Printing money $2 to $8
3 Buys from $4 to $7 on NASDAQ:AEHL
Last take profit right into $8 area pop 🎯
Told you about it premaket!
It's a dream to be in before halt and just sell a dollar higher with no effort 🚀
Nightly $SPY / $SPX Scenarios for April 10, 2025🔮 🔮
🌍 Market-Moving News 🌍:
🇺🇸📈 U.S. Tariff Pause and Increased Tariffs on China: President Donald Trump announced a 90-day pause on tariffs for most trading partners but increased tariffs on Chinese imports to 125%. This move led to a surge in global stock markets, with the S&P 500 rising by 9.5% and the Dow Jones by 7.9%.
🇨🇳📈 China's Retaliatory Tariffs: In response, China imposed additional tariffs of 84% on U.S. goods, escalating trade tensions and impacting global markets.
📊 Key Data Releases 📊
📅 Thursday, April 10:
📈 Consumer Price Index (CPI) (8:30 AM ET):
Forecast: 0.1%
Previous: 0.2%
Measures the average change over time in the prices paid by consumers for goods and services, indicating inflation trends.
📉 Initial Jobless Claims (8:30 AM ET):
Forecast: 219,000
Previous: 225,000
Reports the number of individuals filing for unemployment benefits for the first time, reflecting labor market conditions.
🗣️ Fed Governor Michelle Bowman Testifies to Senate (10:00 AM ET):
Provides insights into the Federal Reserve's perspective on economic conditions and monetary policy.
⚠️ Disclaimer: This information is for educational and informational purposes only and should not be construed as financial advice. Always consult a licensed financial advisor before making investment decisions.
📌 #trading #stockmarket #economy #news #trendtao #charting #technicalanalysis
SPY Analysis & Tariff TurmoilLast Friday, the market pressure was intense, and my bullish call option, targeting $537.64 on SPY, seemed overly ambitious as tariffs and political uncertainties peaked. I stated, " AMEX:SPY Trump went all in thinking he had the cards. We were getting sent back to the McKinley era," wondering when or if Trump would fold under international pressure and market realities.
Fast-forward to Wednesday, April 8—Trump didn't just blink; he folded utterly, reversing the harsh tariff policies he initially defended aggressively. Prompted by China's aggressively dumping of U.S. Treasuries and stark recession warnings from Goldman Sachs, BlackRock, and JPMorgan, Trump pivoted significantly:
• Base tariffs: 10%
• Tariffs on China: Increased to 125%
• Tariffs on U.S. goods entering China: Increased to 84% starting April 10
While temporarily bullish, these sudden, dramatic policy swings underline ongoing instability and volatility. However, with big bank earnings on deck this Friday, short-term momentum looks positive.
Technical Levels & Trade Ideas
Hourly Chart
The hourly chart reveals a critical zone—dubbed "Liberation Day Trapped Longs"—between $544.37 (H. Vol Sell Target 1b) and $560.54 (L. Vol ST 2b). Bulls trapped here from recent highs may now look to exit on a relief rally.
• Bullish Scenario:
• Entry: SPY reclaiming and holding above $544.37.
• Target 1: $560.54 (top of trapped longs)
• Target 2: $566.54 (next resistance area)
• Stop Loss: Below recent lows near $535 to limit downside.
• Bearish Scenario (if tariffs intensify again or earnings disappoint):
• Entry: Breakdown confirmation below $535.
• Target 1: $522.20 (Weeks Low Long)
• Target 2: $510.00, potential further support
• Stop Loss: Above $544.50 to manage risk effectively.
Daily Chart Perspective
The broader daily chart shows SPY stabilizing around key lower supports after significant volatility. Recent price action suggests cautious optimism for an upward bounce, but considerable headwinds remain if tariff escalations resume.
Final Thoughts
The rapid tariff reversals and heightened volatility are unsettling. The short-term bullish move offers potential quick upside trades into earnings, but caution remains paramount. You can continue managing risks prudently and watch closely for political or economic headlines that could quickly shift market sentiment again.

SPY/QQQ Plan Your Trade For 4-9 : Top/Resistance UpdateToday's big rally, prompted by Trump's Tariff comments, presents a real learning opportunity for traders and followers of my videos.
Everyone wants to know what's going to happen next.
This video will tell you what I believe is NEXT for the markets and why.
It should also reinforce the construct that price is the ultimate indicator and the use of the EPP/Cradle patterns as a mechanism for using price structure to attempt to identify where opportunities may exist.
As much as this video is an analysis of price action and a prediction of what may come next, it is also a tutorial showing you how to use price patterns, structure and context to attempt to plan for your next opportunities.
Ideally, the next phase of the market is to establish a consolidation range.
If the 480-525 lower consolidation range does not hold - then it will likely become a precursor of the July breakdown (support) level. Remember, we still have the July/Oct lows to deal with.
I fully expect the 550-575 consolidation range to become the new dominant consolidation phase for the current EPP pattern.
It makes sense to me that, absent any crazy tariff war, the most likely outcome will be for the markets to recover back to the 550-575 level and to consolidate further.
The last component we have to consider is the recent lows near 480 could have been a very quick breakdown to an Ultimate Low. If that is the case, then we'll most into a mode of seeking the next higher resistance level and I believe the 550 or 575 level would be the obvious next resistance level.
So, at this point, I believe the continuation of the Excess Phase Peak pattern is likely, but the price is actively seeking the consolidation range between the lower consolidation level and the upper consolidation level.
Price MUST establish the consolidation range, or INVALIDATE this pattern, in order to move onto the next pattern/phase.
Get Some..
#trading #research #investing #tradingalgos #tradingsignals #cycles #fibonacci #elliotwave #modelingsystems #stocks #bitcoin #btcusd #cryptos #spy #gold #nq #investing #trading #spytrading #spymarket #tradingmarket #stockmarket #silver
