SPY/QQQ Plan Your Trade For 2-20 : Rotation PatternSorry for my delay this morning. Everything is fine over here - just a bit hectic this morning, and I had to drive my son to his work at 530am - which interrupted my plans.
OK, so here we go.
This video helps to organize my analysis/thinking into more clearly presented data for my followers. I use the Fibonacci Price Theory as a basis for all my analysis. On top of that, I use other techniques (anchor bars, my SPY Cycle Patterns, and my custom indexes) to help identify when and where opportunities exist for the best trades.
I've been getting comments related to my labeling these videos as Bullish or Bearish which may go against the primary trend direction presented on the charts. So, now I've added a TEXT LABEL that tells you what every chart is doing on a Short, Intermediate, and Long-term basis.
This will help all of you follow my analysis/thinking going forward (I hope).
Today's Rotation Pattern suggests the markets will slide into a sideways price rotation phase.
This rotation could be a stalling pattern after the recent rally to new ATHs.
I'm still very cautious of a breakdown/pullback in trend after this move higher. As I keep saying, I don't believe the markets have sufficient momentum to continue a massive rally phase. And I really believe this new ATH level is a BULL TRAP - setting up longs to jump into this rally mode before a bigger pullback/breakdown takes place.
Gold and Silver are struggling to move higher with a fairly broad rotating range - but they are still pushing higher.
I believe Gold and Silver will make a big move higher over the next 30+ days. So, be prepared for volatility - but stick with long trades for metals as I believe Gold will rally to levels above $3100 very quickly.
Bitcoin could be shifting into a new Excess Phase Peak pattern off recent lows. The FPT trends for Bitcoin are still BEARISH, but we are starting to see a base setup that may become a new Excess Phase Peak low.
Watch this video and please comment if you have any questions.
Again, sorry for my delay this morning.
Get some..
#trading #research #investing #tradingalgos #tradingsignals #cycles #fibonacci #elliotwave #modelingsystems #stocks #bitcoin #btcusd #cryptos #spy #gold #nq #investing #trading #spytrading #spymarket #tradingmarket #stockmarket #silver
SPDR S&P 500 ETF (SPY)

Nightly $SPY / $SPX Scenarios for 2.20.2025🔮
🌍 Market-Moving News:
🇰🇷📉 Samsung Share Cancellation: Samsung Electronics plans to cancel over 57 million shares, including 50.1 million common shares and 6.9 million preferred shares, on February 20. This move aims to reduce the total number of issued shares without decreasing the company's capital.
📊 Key Data Releases:
📅 Thursday, Feb 20:
🏭 Philadelphia Fed Manufacturing Index (8:30 AM ET): Forecast: 19.4; Previous: 44.3.
📉 Initial Jobless Claims (8:30 AM ET): Forecast: 214K; Previous: 213K.
📈 Leading Index (10:00 AM ET): Forecast: -0.1%; Previous: -0.1%.
📌 #trading #stockmarket #economy #news #trendtao #charting #technicalanalysis

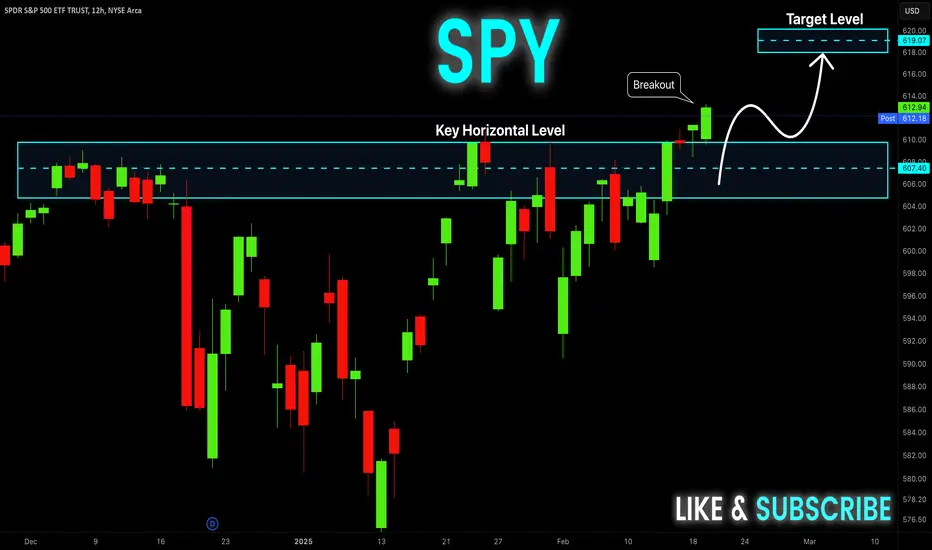
SPY Bullish Breakout! Buy!
Hello,Traders!
SPY is trading in a strong
Uptrend and the index made
A bullish breakout of the key
Horizontal level around 608$
So we are bullish biased and
We will be expecting a further
Bullish move up
Buy!
Comment and subscribe to help us grow!
Check out other forecasts below too!
Bullish Cypher - SPY spotted a bullish Cypher pattern on SPY’s daily chart, and it looks promising.
Entry: Current Market Price
Stop Loss: 575.50, just under the D-point, to give the trade some breathing room.
Targets: All time high
Ideas and Inputs are welcome.
Thank you for dropping by.
Disclaimer:
This analysis is for educational purposes only and is not financial advice. Trading involves significant risk, and you should only trade with money you can afford to lose. Past performance is not indicative of future results. Always do your own research and consult with a financial advisor before making any trading decisions.

Bulls and Bears zone for 02-19-2025So far S&P 500 has been trading sideways this week.
Any test of yesterday's Close could provide direction for the day.
Level to watch : 6136 ---6138
Report to watch:
US: FOMC Minutes 2:00PM ET
SPY/QQQ Plan Your Trade For 2-19-25: GAP Reversal Counter-trendToday's pattern suggests a morning GAP will lead to a price reversal in a counter-trend type of mode.
I read this as a potential that price will initially struggle to find a trend. Eventually, when it does identify a trend mode, I believe that trend will strengthen into a reversal of the current upward price trend.
Normally, Counter-trend patterns invert. So, what I would have expected as an uptrend would turn into a downtrend. But, the markets have moved into a very consolidated price channel near recent highs and volume has diminished strongly.
Because of this type of setup, I believe an aggressive breakaway or breakdown price move is pending.
Price will attempt to make a move - and when it does, it should be explosive.
My continued research, which I share with you in this video, continues to suggest price will stall out and revert downward.
We'll see how things play out over the next few days.
Gold and Silver are back near recent all-time highs. Stay cautious of a breakdown in metals associated with a breakdown in the SPY/QQQ.
BTCUSD is still struggling to make a move. As you will see, I believe the dominant trend is to the downside right now.
In short, we are standing at the edge of a cliff regarding price action. At this point, we either grow wings and soar higher or fall downward - hoping for a soft landing.
Buckle up.
Get some.
#trading #research #investing #tradingalgos #tradingsignals #cycles #fibonacci #elliotwave #modelingsystems #stocks #bitcoin #btcusd #cryptos #spy #gold #nq #investing #trading #spytrading #spymarket #tradingmarket #stockmarket #silver

$SPY🚨 AMEX:SPY Outlook
We are overextended here and failed to surpass major OB(s). The next leg down will be a wild ride, as we may fall below $590 heading into March.
The great financial switch to the Digital Financial System is upon us.
$3.35 to $13.46 in 45 minutes during premarket, strong 300%Early bird gets the worm in premarket stock trading I guess. When they start moving like this during early morning it pays to wake up early and catch one of these because it could be more profit faster than during all regular trading hours during the day.

Nightly $SPY / $SPX Scenarios for 2.19.2025🔮
🌍 Market-Moving News:
🇺🇸🗣️ President Trump's Address: At 9:00 PM ET on Tuesday, February 18, President Trump is scheduled to deliver a speech that may provide insights into upcoming policy directions.
📱🍏 Apple Product Launch: Apple CEO Tim Cook has announced a new product launch set for February 19, 2025. Speculations suggest it could be the iPhone SE 4, featuring a 6.1-inch OLED display and an A18 chip with Apple Intelligence.
📊 Key Data Releases:
🏠 Housing Starts (8:30 AM ET): Forecast: 1.390M; Previous: 1.499M.
📄 FOMC Meeting Minutes (2:00 PM ET): Detailed insights into the Federal Reserve's policy discussions from the January meeting.
📌 #trading #stockmarket #economy #news #trendtao #charting #technicalanalysis

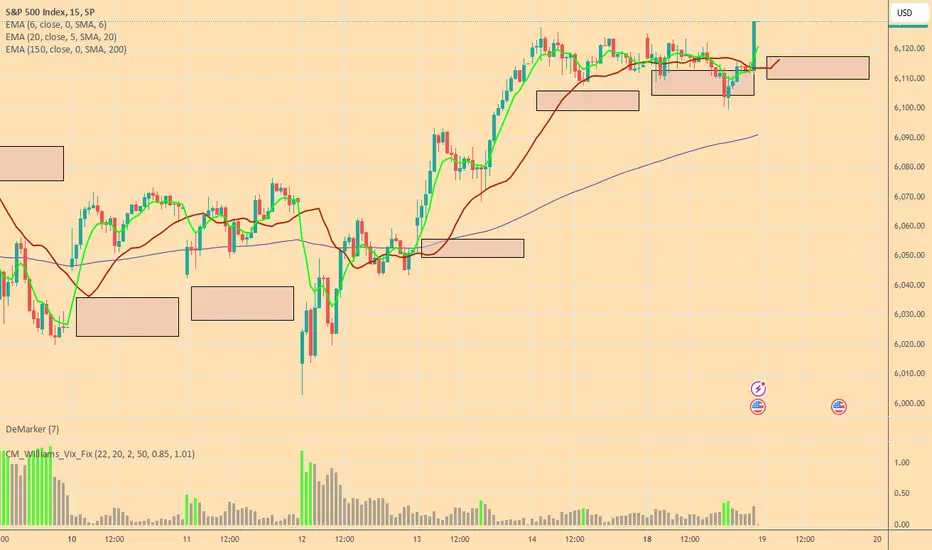
One More Close and SPY Will be Running!!!Typically I share the signals of my King Trading Momentum Strategy, which combines the 5 EMA crossing above the 13 EMA, RSI strength, favorable momentum as measured by ADX plus evaluating recent volume changes and even a little thing called Beta! But this time it is all about technical analysis. On SPY I originally thought we truncated wave 5 but now that we closed above the all-time high just one more close higher to confirm and this one is off to the races. Today it even retested breakout, held and bounced hard higher into close (super bullish). Impulsive waves are important to me with my momentum strategy, as instead of chasing missed opportunities I simply take the next signal on the hourly, as the strategy is optimized for over 100 beloved equities (if enabled in options)! There is always another trade when SPY goes impulsive! Currently signals have fired on TNA, SPXL, SOXL, TQQQ & UDOW (3x leveraged ETFs) just to name a few. If that doesn't make you feel bullish then I'm not sure what will!

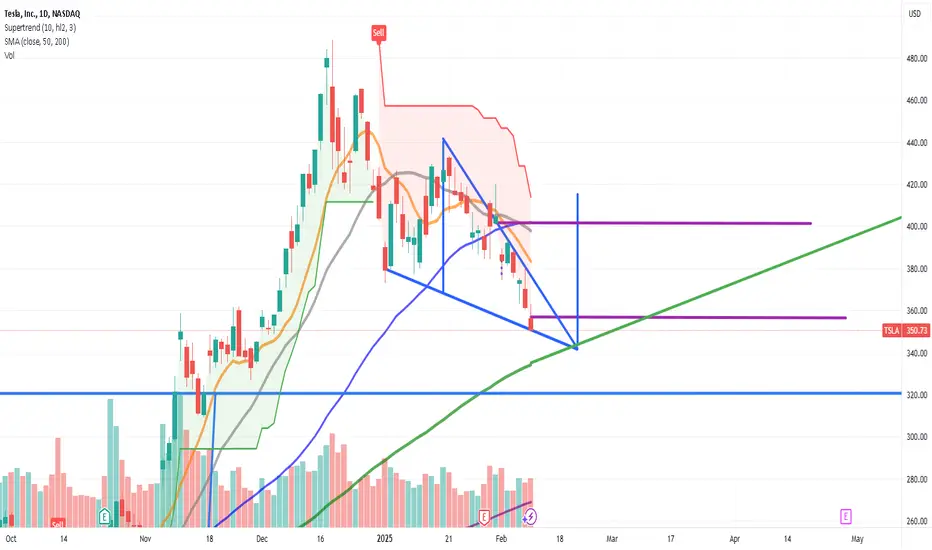
$TSLA poised for an EASY rise to $400 and beyond.BUY NASDAQ:TSLA NOW
A falling wedge is a chart pattern suggesting a probable rise in a stock's price. This bullish pattern emerges during a downtrend, as the price range tightens and the trend lines converge.
RSI: 35.02 as of 02/10/2025
NASDAQ:TSLA 's price began 2025 at $403.84. As of today, it stands at $350.73, reflecting a -13% decrease since the start of the year. By the end of 2025, it's projected to reach $692 , a year-to-year increase of +71%. This marks a +97% rise from today’s price. Mid-2025 predictions place Tesla at $477 . In the first half of 2026, the price is expected to climb to $805, and by year-end, add another $163 to close at $968, which is +176% from the current price.
-Month Low $350.51
Low $350.51
Pivot Point 1st Support Point $346.59
Pivot Point 2nd Support Point $342.46
Price 1 Standard Deviation Support $334.84
Pivot Point 3rd Support Point $334.40
Thank you
SPY/QQQ Plan Your Trade Post Market Update : Big Squeeze CloseToday is quite a day in terms of trading volatility and volume. We've not seen a low-volume day like today in the SPY for more than a year.
It is very likely this rally near the close of trading was more of a short-squeeze and not really a momentum breakout.
We'll see how things play out tomorrow. But, I'm not budging related to my expectations of a breakdown in the markets over the next 5-10+ days.
I see this market as completely over-cooked to the upside - and it seems to be evident in the lack of buying volume playing out.
My Custom Crash index is flat and topping. My Custom Volatility Index is flat and topping. My Custom US Leading Index is actually LOWER so far this week.
One thing is certain, there is a lot of open "air" below the 598 level on the SPY.
Buckle Up.
When it breaks - it may be a BIG BREAKDOWN setting up.
Get Some.
#trading #research #investing #tradingalgos #tradingsignals #cycles #fibonacci #elliotwave #modelingsystems #stocks #bitcoin #btcusd #cryptos #spy #gold #nq #investing #trading #spytrading #spymarket #tradingmarket #stockmarket #silver

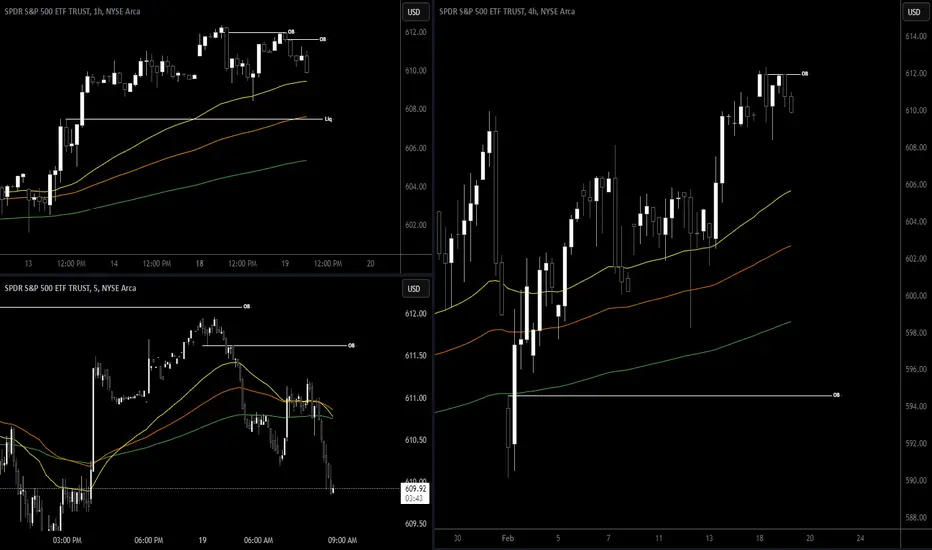
S&P 500 Futures - The stop hunt before the next move higher?Trading SPY, QQQ, or its futures counterparts had people checking their swing trades! A previous pivot point near the 0.382 level showed an area of piled up stop loss orders. With a glimpse of all time highs early in the morning a new measurement was required at the over night swing level. Price took the elevator down to grab the liquidity before moving higher? Or will this mark a reversal point for the S&P 500?

SPY/QQQ Plan Your Trade For 2-18 : GAP PotentialAs the markets continue to struggle to break away from the current consolidated/sideways price trend, one thing is certain: The current FLAG/EPP pattern is setting up an explosive price move.
My expectations are for a price breakdown, as my predictive modeling and GANN Cycle Patterns suggest that Major Bottoms will set up near February 21 and March 21-23.
These major Bottoms suggest a strong potential for a price breakdown, reflecting uncertainty for the first half of 2025.
Additionally, I believe the strength of the US Dollar is driving a "Capital Shift," where foreign capital is actively moving away from currency and economic risks, pooling aggressively into the safest currency and assets. This translates into capital pooling into US, UK, and EURO assets to avoid broader currency devaluation events.
The dynamics of the global markets are very interesting right now. The influx of capital into the strongest economies with the strongest currencies may present a MELT-UP type of market trend. However, the uncertainty related to future US economic growth and performance may prompt some deep downturns/pullbacks in price.
I don't see how the US markets can move past the economic turmoil of broad government restructuring until after June/July 2025.
Therefore, I continue to urge traders to stay cautious of any melt-up trend. The markets want to move higher, but there are currently extreme volatility risks related to any potential price breakdowns.
I'm watching Gold/Silver and Bitcoin to see if we move back into any euphoric phase. And right now, I'm seeing metals starting to move into a type of panic selloff while Bitcoin is struggling to regain any real strength.
The continued sideways trend of Bitcoin leads me to believe the euphoria is diminishing, and reality may be setting in. That means we may be in for a bumpy ride over the next 90+ days.
Stay fluid and stay cautious of any big breakdowns.
Get some.
#trading #research #investing #tradingalgos #tradingsignals #cycles #fibonacci #elliotwave #modelingsystems #stocks #bitcoin #btcusd #cryptos #spy #gold #nq #investing #trading #spytrading #spymarket #tradingmarket #stockmarket #silver

Weekly Market Outlook: February 18 – 21, 2025🔮
🌍 Market-Moving News:
🇺🇸📈 U.S. Tariffs Implementation: President Donald Trump has signed executive orders imposing a 25% tariff on imports from Canada and Mexico, and a 10% tariff on imports from China. These tariffs are set to take effect on Tuesday, February 18, 2025.
🇷🇺🇺🇸 Diplomatic Talks: Senior U.S. and Russian officials are scheduled to meet in Riyadh, Saudi Arabia, on February 18 to discuss the ongoing conflict in Ukraine and explore potential resolutions.
🇩🇪🗳️ German Snap Election: Germany is set to hold a snap election this week, with the far-right Alternative for Germany (AfD) expected to perform well, potentially influencing European markets.
📊 Key Data Releases:
Tuesday, Feb 18:
🇺🇸🏭 NY Empire State Manufacturing Index (8:30 AM ET): Measures manufacturing activity in New York State.
🇺🇸🗣️ U.S. President Trump Speech (3:00 PM ET): Insights into potential policy directions and economic outlook.
Wednesday, Feb 19:
🇺🇸🏠 Housing Starts (8:30 AM ET): Data on new residential construction projects.
🇺🇸📄 FOMC Meeting Minutes (2:00 PM ET): Detailed insights into the Federal Reserve's policy discussions from the January meeting.
Thursday, Feb 20:
🇺🇸📉 Initial Jobless Claims (8:30 AM ET): Weekly data on unemployment claims.
🇺🇸🏭 Philadelphia Fed Manufacturing Index (8:30 AM ET): Indicator of manufacturing sector health in the Philadelphia region.
Friday, Feb 21:
🇺🇸🏭 S&P Global Flash Manufacturing PMI (9:45 AM ET): Preliminary data on manufacturing sector performance.
🇺🇸🏠 Existing Home Sales (10:00 AM ET): Reports on the number of previously owned homes sold.
📌 #trading #stockmarket #economy #news #trendtao #charting #technicalanalysis

2025 Market Outlook - Cautiously Bullish (Important Bar Counts)Hey Everybody,
Thanks for checking out the video. I'm reviewing all major instruments, US and Non US.
US has carried the financial markets since 2020 and 2022 and this year out of the gate we're seeing big runs in "uninvestable" spaces like Europe and China. I say that jokingly because of how bad everything thought non US assets were, but here we are watching DAX, FTSE, and HSI running to double digit gains while the US lags behind.
Will the US catch up and the global economy tide rise to lift all boats or are we truly seeing a catch up trade that will have headwinds uncertainties a plenty? Time will tell.
This week is a holiday shortened trading week, RBA and RBNZ expected to cut rates, Europe and US printing PMI on Friday. BABA and BIDU earnings this week (China related), and NVDA earnings next week (#2 market cap in US).
I discuss the big bar counts that I'm watching closely on SPY, SPX, XSP, RSP, NDX, QQQ, DIA, NVDA, META, NFLX, and others that I believe technically will matter for limited upside momentum without a bigger pause, snapback or correction ahead.
Cautiously optimistic is a perfect play for 2025. I'm off to a good start for the year and intend to keep that way without chasing or doing anything silly.
Thank for watching.

Markets are going PARABOLIC!AMEX:SPY SP:SPX : Jail Break!
🎯$630 incoming!
- Consolidation then breakout
- H5 about to flip green
- WCB thriving
- Volume shelf launch
Not financial advice

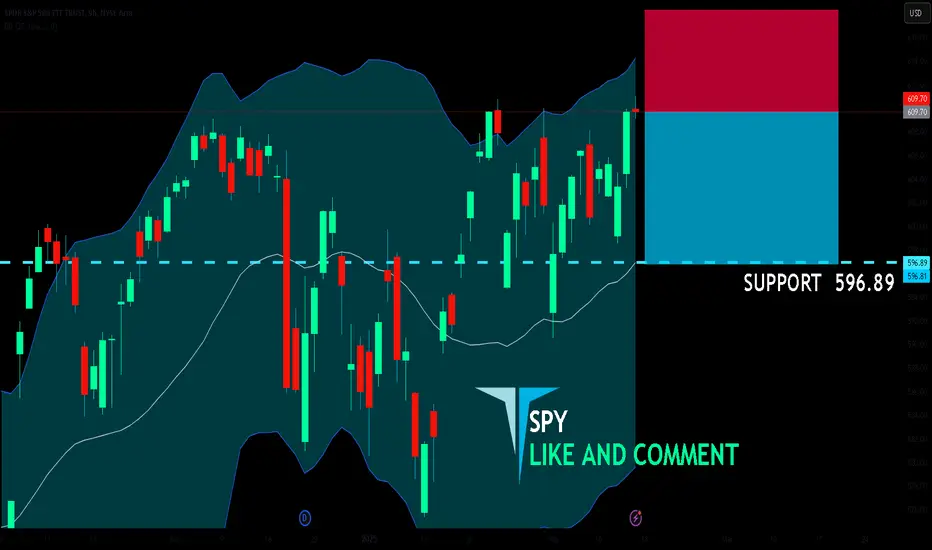
SPY BEARISH BIAS RIGHT NOW| SHORT
Hello, Friends!
Previous week’s green candle means that for us the SPY pair is in the uptrend. And the current movement leg was also up but the resistance line will be hit soon and upper BB band proximity will signal an overbought condition so we will go for a counter-trend short trade with the target being at 596.89.
✅LIKE AND COMMENT MY IDEAS✅
Stock Market Forecast | TSLA NVDA AAPL AMZN META GOOGL MSFTStock Market Analysis | SPY QQQ, NQ ES
Mag 7 Analysis | TSLA NVDA AAPL AMZN META GOOGL MSFT

SPY: Short Trade Explained
SPY
- Classic bearish setup
- Our team expects bearish continuation
SUGGESTED TRADE:
Swing Trade
Short SPY
Entry Point - 609.70
Stop Loss - 616.72
Take Profit - 594.95
Our Risk - 1%
Start protection of your profits from lower levels
❤️ Please, support our work with like & comment! ❤️

$Meta and U.S equity Bull Run Almost Finished? Was just having a little fun before bed and brainstorming on the NASDAQ:META chart. Our darling as of late. I love trying to find similarities and patterns between macro swings and cycles. Human psychology and business cycles have a way of repeating themselves pretty often. As they say, history doesn't repeat, but it rhymes.
This recent melt up reminds a lot of the price action NASDAQ:META saw in 2021-2022. RSI overbought both times, currently approaching the 2.618 fib when connecting them to major high and low points. Decreasing volume on the moves up.
There's a lot of other data to support a bear market may be on the horizon:
Weak housing data/stocks (I do see some outlier stocks in the housing sector).
The yield curve un-inversion which typically precedes major bear markets 6-12 months after un-inversion.
The dollar seems to want to keep going higher. However it has shown a lot of weakness here lately which could help fuel the rest of the bull market.
The unwinding of the Japanese Yen carry trade has seemed to play a big factor in U.S equities as of late. Every time the BOJ hikes interest rates, a lot of U.S. equities see pretty sizable bearish volatility shortly after.
Being the darling that NASDAQ:META has become, once this trend line breaks it will be a signal that everyone should be taking note of in my opinion. I think the risk of a bear market increases dramatically. Maybe we get a shallow or 2022 style bear market next year and continue to make one last lag into new highs in 2027.
Here are some ideas that could support that theory:
China seems to be coming out of a depression-style bear market and is beginning to inject liquidity into their economy. This could help give U.S. equities a little more juice to run higher for longer
chips could make a major comeback and fuel SPY/QQQ higher for longer.
Names like Google, Tesla and Amazon can continue to show strength and we could see a rotation into them.
Maybe we get some more significant quantum breakthroughs with the help of AI.
These are things to keep in mind, but I think the probabilities of this this bull market we've enjoyed since 2008 is A LOT closer to the end than the beginning.
I base most of my sentiment off the 18.6 year real estate/land cycle theory that I have been following since 2022. I also give a lot of credibility to U.S. yield curve un-inversions sending shockwaves through the global economic system.
What do you guys and gals think?

SELL SIGNAL IS BEEN GIVEN put/callThe chart is my put /call model please take time to notice All signals Have a great weekend best of trades WAVETIMER I am now moved to a 100 % long deep in the money PUTS in QQQ and SPY for June 2026

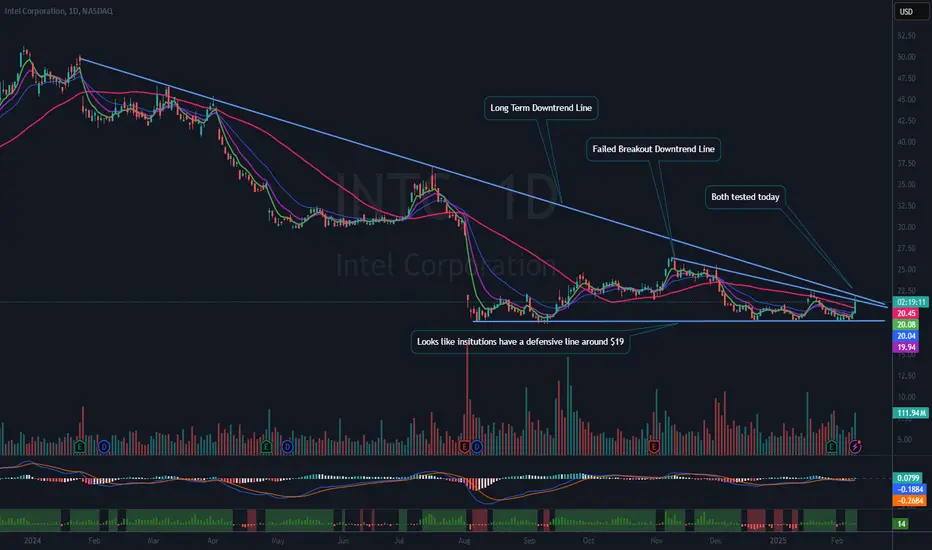
$INTC Nice Long Base – Ready to Breakout?NASDAQ:INTC oh how the mighty fall from grace. But so much for nostalgia. INTC has been basing since August 2024 for over 6 months. It looks like it has support around $19. It has tried to get moving a few times but no go.
Today it has tested both the longer term and shorter-term downtrend lines (DTL). It is testing today on the news that JD VANCE said AI will be built in the US. I have tried this name before and have been stopped out for a small loss. I have an alert set on the long term DTL. Should that trigger, I will want a convincing close above it. Looks to me, risk is well defined with a stop under $19. At current price that is about an 11% Stop Loss. Too much for me, so I would go to a lower timeframe to see if there is a better Risk Reward stop. All TBD.
I am only posting this because I like the longer base and thought you might want it on your watchlist as well.
This is my idea, if you like it, make it your own to fit “your” trading plan.