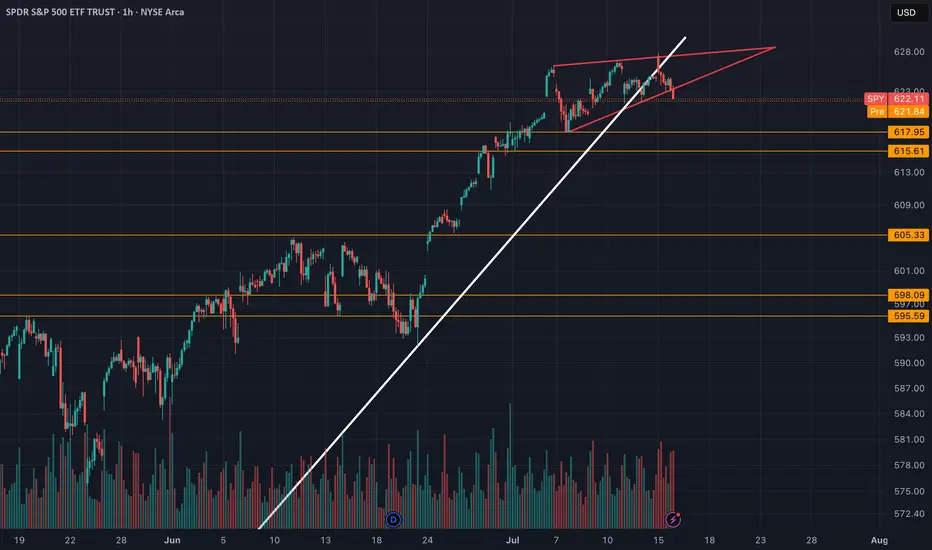
SPY (SP-500) - Rising WedgeYesterday we had a breakdown of the rising wedge on SPY. I draw out some important levels to look out for coming days/weeks. The trendline since april has also been broken. ICEUS:DXY is breaking out to which is increasing the risks for a "Risk off" scenario in tech stocks and crypto.
Nothing here should be interpreted as financial advise. Always do your own research and decisions.
SPDR S&P 500 ETF (SPY)
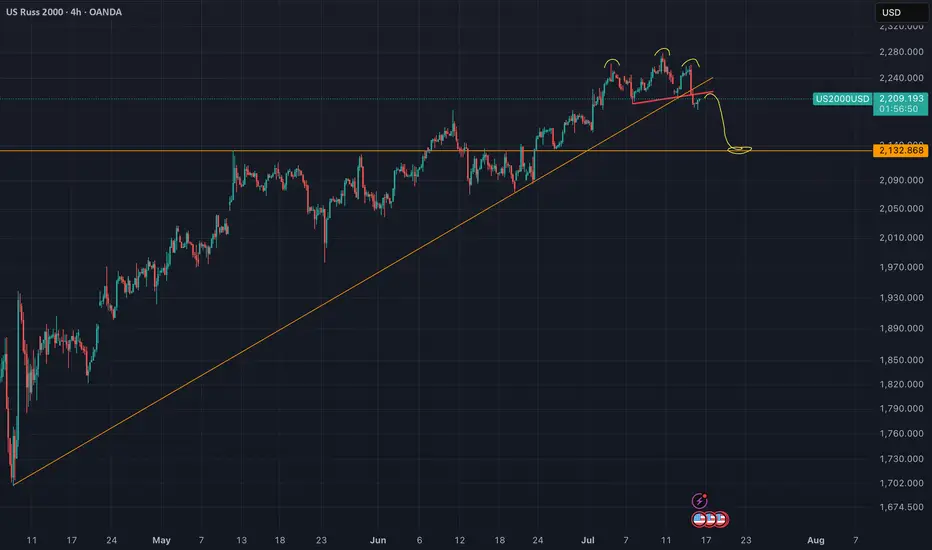
US2000 - Head And Shoulders (Top signal)Reversal in play. The neckline of the H&S got validated yesterday.
Nothing here should be interpreted as financial advise. Always do your own research and decisions.
SPY PRICE ACTION 16 JULY 2025This is the price action of spy at its very best as always. I have clearly discussed the important levels & have also discussed the momentum as well.
Feel free to leave your comment
NOTE:I AM NOT TRADING SPY

SPY/QQQ Plan Your Trade Special Update : BUCKLE UPThis video is a special update for all TradingView members. I felt I needed to share this information and present the case that I believe poses the most significant risk to your financial future - and it's happening right now.
Several weeks ago, I identified a very unique mirror setup in the SPY and kept an eye on how it was playing out. I needed to see confirmation of this setup before I could say it had any real likelihood of playing out as I expected.
As of today, I'm suggesting that we now have excellent confirmation that the US/Global markets are about to enter a deep consolidation phase, lasting through the rest of 2025 and possibly into 2026 and early 2027.
The interesting thing about this price pattern/structure is that it is almost exactly the same as the 2003-2007 structure, which I believe is the origin of this mirror setup. Almost down to the exact type of price bars/patterns I'm seeing.
Many of you are already aware that I've been calling for a critical low cycle in the SPY on July 18 for many months. What you may not realize is that the pattern is based on Weekly price data. The July 18 cycle low can have a span of +/- 1-3 weeks related to when and how the cycle low pattern plays out.
Watch this video. If you have any questions, message me or comment.
I'm still here, doing my best to identify and unlock the secrets of price action and to help as many traders as I can.
Price is the Ultimate Indicator.
Get some.
#trading #research #investing #tradingalgos #tradingsignals #cycles #fibonacci #elliotwave #modelingsystems #stocks #bitcoin #btcusd #cryptos #spy #gold #nq #investing #trading #spytrading #spymarket #tradingmarket #stockmarket #silver

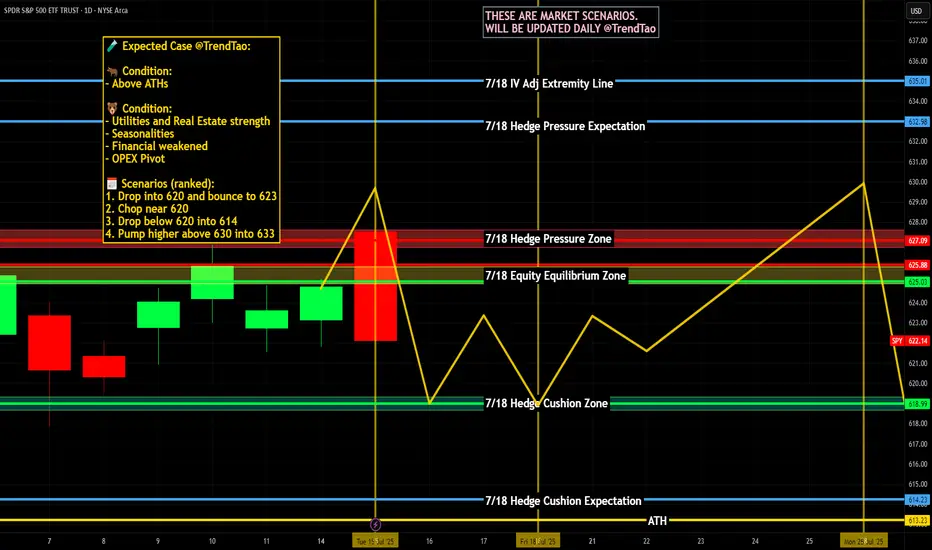
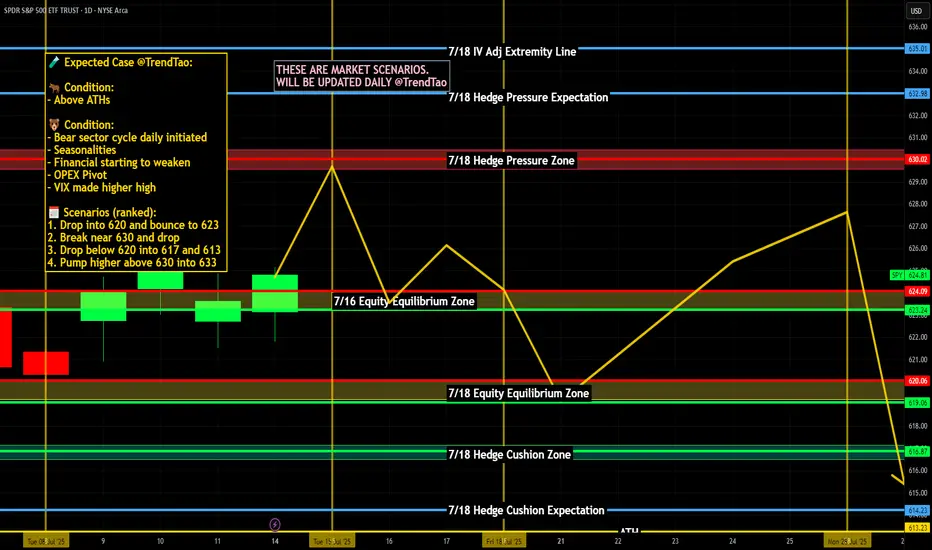
Nightly $SPY / $SPX Scenarios for July 16, 2025 🔮 Nightly AMEX:SPY / SP:SPX Scenarios for July 16, 2025 🔮
🌍 Market-Moving News 🌍
📈 Record Bullish Sentiment Signals Rotation
Bank of America reports the most bullish fund-manager sentiment since February. With 81% expecting one or two Fed rate cuts this year, the group sees a rotation strategy replacing outright selling, with investors tipping toward sector shifts over wholesale exits
⚠️ Trump’s Fed Attacks Stir Policy Concerns
President Trump’s public criticism of Fed Chair Powell—calling for steep rate cuts and threatening removal—has raised market alarms over the central bank’s independence. Analysts warn such interference could destabilize confidence in U.S. monetary policy
🏦 Banks Prepare for Earnings Surge
Major U.S. banks are expected to report strong Q2 results this week. Enhanced trading and investment banking revenues are forecasted to offset economic uncertainties tied to tariffs
📡 Nvidia CEO to Visit Beijing
Jensen Huang is set to hold a high-profile media briefing in Beijing on July 16, signaling continued emphasis on China for Nvidia despite U.S. export restrictions—potentially a key narrative for tech markets
📊 Key Data Releases & Events 📊
📅 Wednesday, July 16:
8:30 AM ET – Producer Price Index (June)
Gauges wholesale inflation pressures; June expected +0.2% MoM vs May’s +0.1%
9:15 AM ET – Industrial Production & Capacity Utilization (June)
Monitors factory and utilities output and usage rates—key for industrial-sector health
Jensen Huang in Beijing
Nvidia CEO to lead media briefing in Beijing—a potential market mover for chipmaking and AI sectors
⚠️ Disclaimer:
This info is for educational purposes only—not financial advice. Consult a licensed professional before making investment decisions.
📌 #trading #stockmarket #inflation #Fed #tech #industrial #PPI
HOOD - Get Great PricingNASDAQ:HOOD and I have had a mixed relationship over the years. I have had my biggest win on the HOOD brokerage (5,000% options trade, $1200 into 60k) and at the same time I was present for the Derogatory removal of the GME button (of which I had sold before they took that button).
After many years and brokerages, I find myself returning to HOOD but this time much more experience... To my surprise, I love the platform, and I still recommend it for new traders for the ease and UI. Honestly, unless you are dealing with BIG Volume or Hot-Keying out of Low float Penny stocks, It will suit you just fine.
Now Let's Talk HOOD.
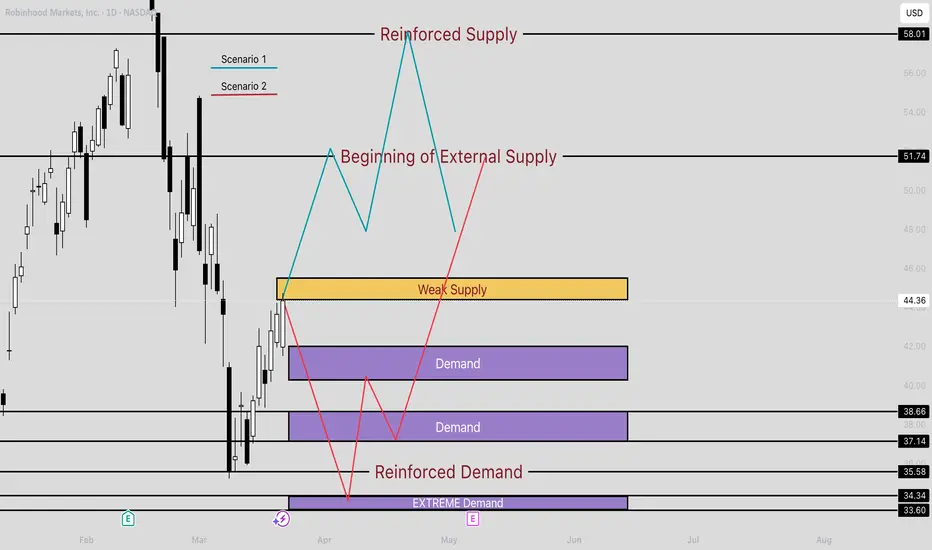
In this MASSIVE range we are looking at High $67, and a Low of $35. Thats a 47% drop!
Although we have recovered a bit, Many are eager to find a way to get in the range. Here I have put together 2 scenarios to help you play your position with confidence.
Better Price = Better psychology
Whether we are shopping at grocery store, or if we are buying a car. Getting a good deal feels better. But how do you feel when you know you overpaid?
TLDR: The best deals are the lowest purple zone "Extreme Demand" if you are Long, "Reinforced Supply" (at the top) if you are looking to get short or take profit.
Under the HOOD
Currently Robinghood is running into a little bit of a supply zone labelled "Weak Supply"
This is a new player, and we don't yet know how just how big this player is. So far they have absorbed some of that buying pressure coming in, but I would not be surprised if they we overtaken or even gapped above come Monday. This brings us to our first Scenario
Scenario 1: Blue line
With the break above "weak supply", there is headroom all the way until 51.74. This is where we will see some supply initially and maybe a small rejection.
Why would it not reject back down to a demand area like 41? Great question.
If this overtakes that "Weak Supply" zone, this will make a strong case that there is momentum behind the wheels here. I think there will be a new player reinforcing this buying if this happens all the way to the Finale at $58.01. From here I would consider taking some profits, maybe partials, or looking for some Puts.
Scenario 2: Red line
Getting Rejected by "Weak supply" would be evidence that this move was fluff. Those two demand zones may try to hold a bit, but with the lack of buying interest in the
$45 area, this won't make those buyers feel confident.
This is different story when comparing to the "Extreme Demand" zone (lowest purple zone). Buyers here have PROVEN that this is something they are very interested and they are not done accumulating yet. So from this location buyers feel confident that they are getting a good price*( see fn. )
From here this should drive demand up again, crushing shorts, and sending another nice squeeze to test that supply at 51.71
WHEW! if you made it this far, I appreciate your time!
Upvote/Follow if you enjoyed this idea, there are many more to come!
Happy trading!
* (This is a good price, because buyers are showing that it is. Although, if it did come down here, this would be the 4th test of this area. I still think there will be strong demand here, but this isn't the best tests. 2nd and 3rd were stronger.)
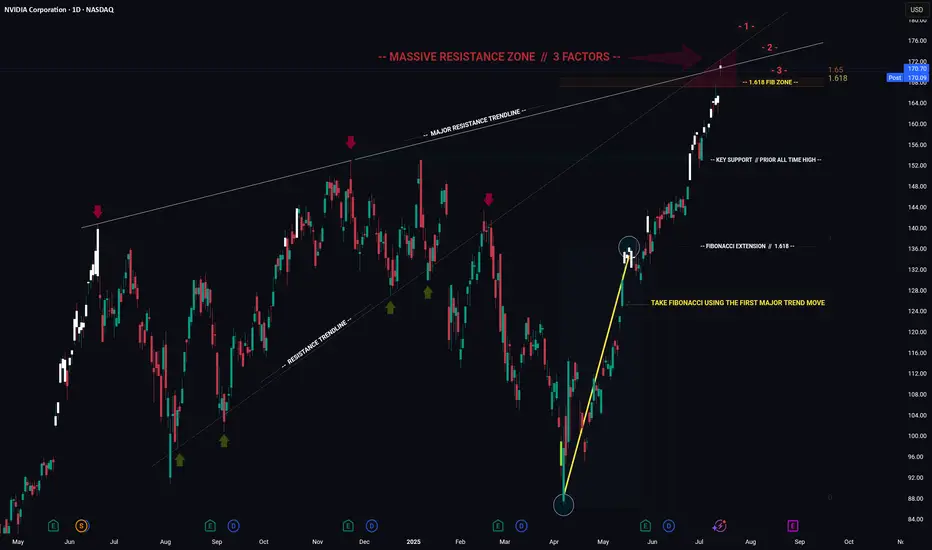
NVIDIA -- Major Resistance // Confluence of 3 FactorsHello Traders!
WOW... This chart is quite incredible I must say.
It's amazing how price is currently at an exact point where 2 major trendlines converge which also nearly coincides with the 1.618 Fibonacci extension. Price closed almost to the penny just above the major trendline connecting the prior highs. It will be very interesting to see what price does over the next few days.
What Does These Converging Trendlines Mean?: Think of a trendline like a wall... Depending on how "strong" the trendline is, this wall could be made from wood all the way through to vibranium straight from Captain Americas shield! These two trendlines converging would likely resemble a steel wall and would be extremely hard to penetrate. (Although there are no gurantees in trading)
What To Watch For: I will be watching to see if price can both break and confirm above both resistance trendlines. It will take MEGA buying pressure to accomplish this and would likely mean continuation to the upside. If price cannot break and confirm above then we will likely see a large retrace to support.
Thanks everyone and best of luck on your trading journeys!
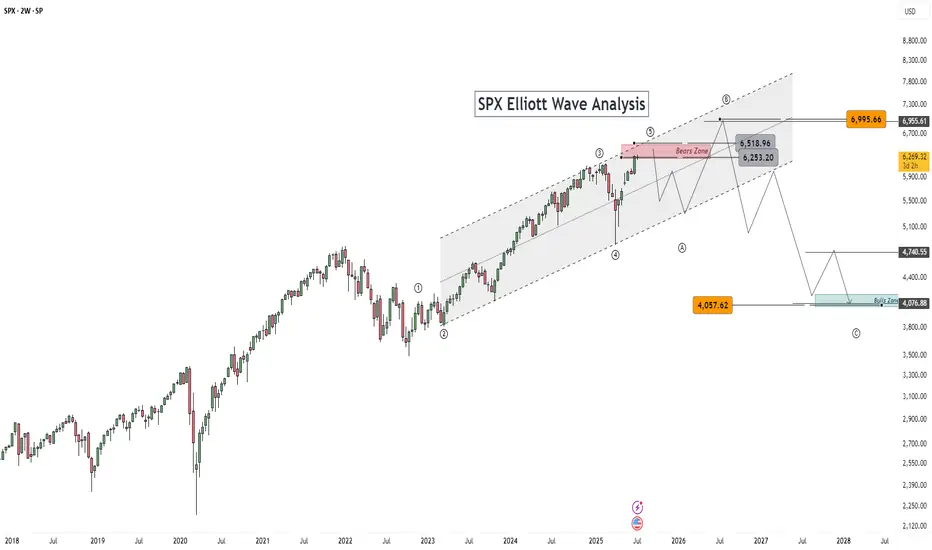
This is just my Elliott Wave Analysis not financial Advice. $SPThis is just my Elliott Wave Analysis not financial Advice. SP:SPX #SPX SP:SPX
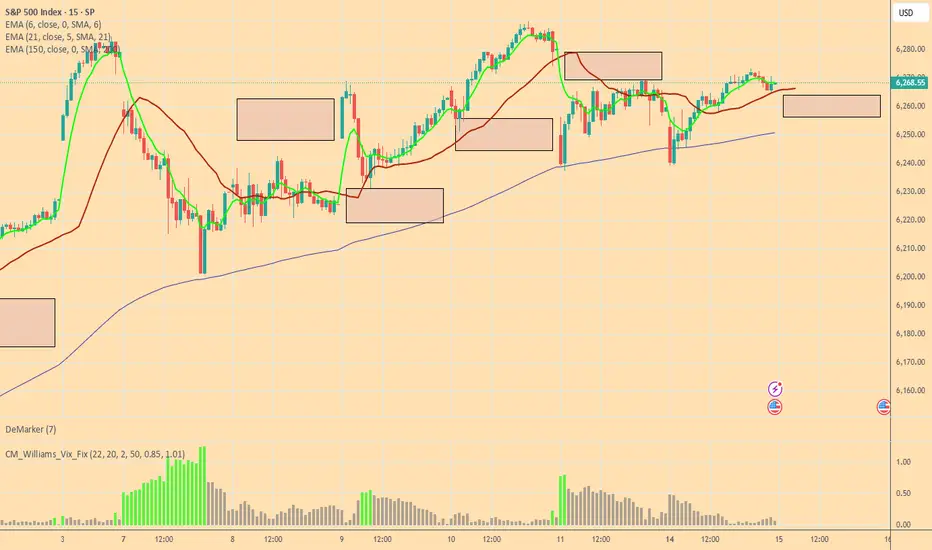
Bulls and Bears zone for 07-15-2025ETH session market is trading higher and expected to Open gap up.
Would traders be able to keep that momentum going rest of the RTH session.
Level to watch: 6328 --- 6330
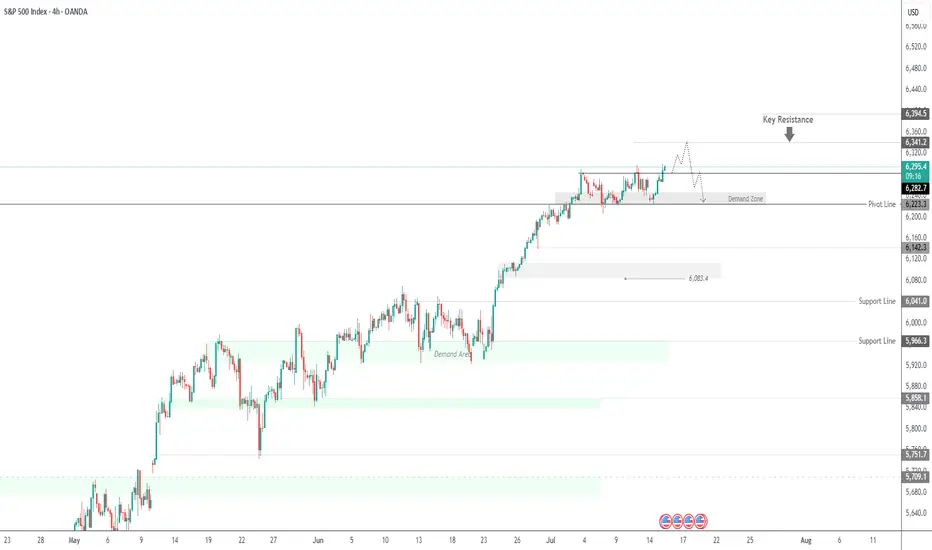
SPX500 Outlook – CPI Data in Focus, Key Pivot at 6282SPX500 – Market Outlook
U.S. futures are climbing as Nvidia plans to resume chip sales to China, fueling positive momentum across tech and growth sectors.
However, investor caution remains ahead of key events:
Major banks ( NYSE:JPM , NYSE:WFC Wells Fargo, NYSE:C Citigroup) will report earnings, offering insights into the financial sector.
All eyes are on the June CPI report, expected at 2.6%. A higher reading could reinforce bearish pressure, while a softer print would support continued bullish momentum.
Technical Outlook:
SPX500 has bounced from the demand zone and is now trading above the pivot at 6282, which keeps the bullish trend in play.
As long as the price holds above this level, we expect continuation toward 6341, and if broken, extended upside toward 6394.
To shift bearish, price must break and close below 6223, which would open the path toward 6142.
Pivot: 6282
Resistance: 6341 – 6394
Support: 6225 – 6191 – 6142
Event Watch : CPI data release today – anything above 2.6% may trigger downside; below 2.6% could support further upside.
Previous idea:
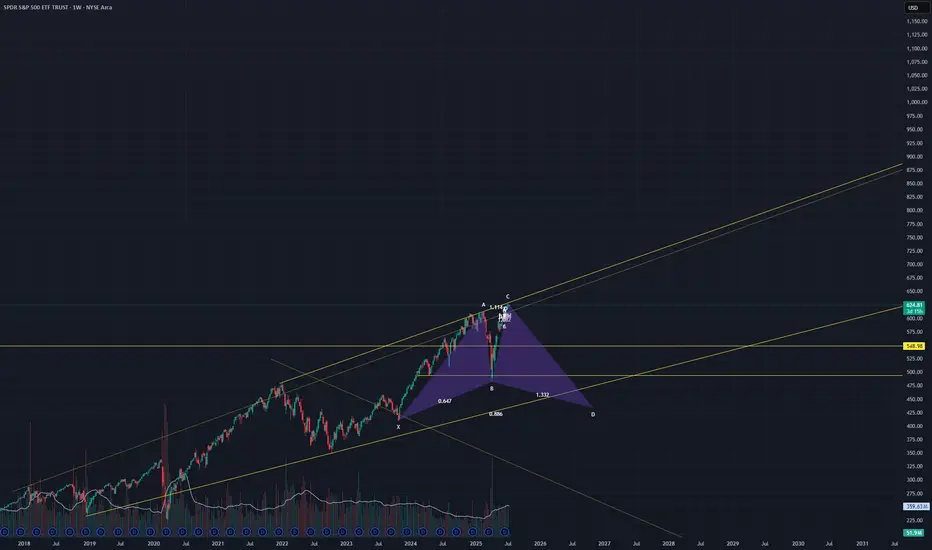
SPY is about to dumpThere isn't much to say. Chart speaks for itself. Possible shark farming if we hit resistance at this trendline that was resistance since 2022. Not shown but its also at the 707 extension of the October '24 and April '25 low.
Market Watch UPDATES! Stock Indices, Gold, Silver, US OILWelcome to the Market Watch Updates for Monday, July 14th.
In this video, we will give the forecast updates for the following markets:
S&P500, NASDAQ, DOW JONES, GOLD, SILVER and US OIL.
Enjoy!
May profits be upon you.
Leave any questions or comments in the comment section.
I appreciate any feedback from my viewers!
Like and/or subscribe if you want more accurate analysis.
Thank you so much!
Disclaimer:
I do not provide personal investment advice and I am not a qualified licensed investment advisor.
All information found here, including any ideas, opinions, views, predictions, forecasts, commentaries, suggestions, expressed or implied herein, are for informational, entertainment or educational purposes only and should not be construed as personal investment advice. While the information provided is believed to be accurate, it may include errors or inaccuracies.
I will not and cannot be held liable for any actions you take as a result of anything you read here.
Conduct your own due diligence, or consult a licensed financial advisor or broker before making any and all investment decisions. Any investments, trades, speculations, or decisions made on the basis of any information found on this channel, expressed or implied herein, are committed at your own risk, financial or otherwise.

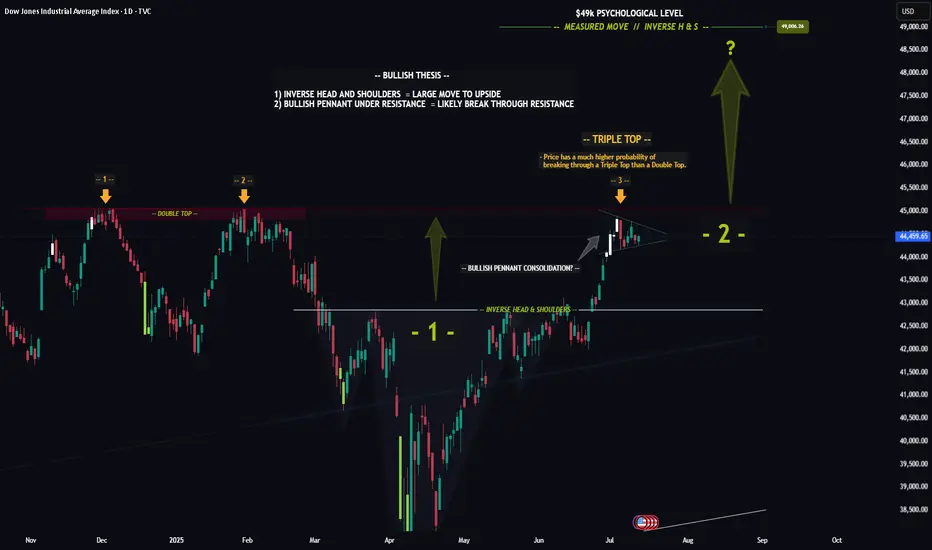
DOW (DJI) -- Preparing For The Next Big Move?Hello Traders!
The chart of the DOW is really quite incredible... Recently price formed a textbook Inverse Head & Shoulders pattern, which led to a nice nearly to the all time high. Furthermore price looks to be consolidating in a Bullish Pennant just below the all time high resistance level.
The reason the Pennant below resistance is so significant is because this signals that investors are likely preparing to drive price higher to new highs. Think about it like a fighter resting before the next big fight.
Triple Top: In addition to the pennant price has now hit this resistance level for the 3rd time. The more times price hits a level typically the weaker it gets. After the 3rd hit the chance of a breakout increases dramatically.
In Summary: The "Triple Top" in conjunction with the "Bullish Pennant" means that there is undoubtedly a very high probability that price will breakout and make new all time highs.
This post is primarily meant to be educational vs a trade idea. Its charts like this that invigorate my technical analysis side and I hope it does for you as well.
Best of luck on your trading journey!
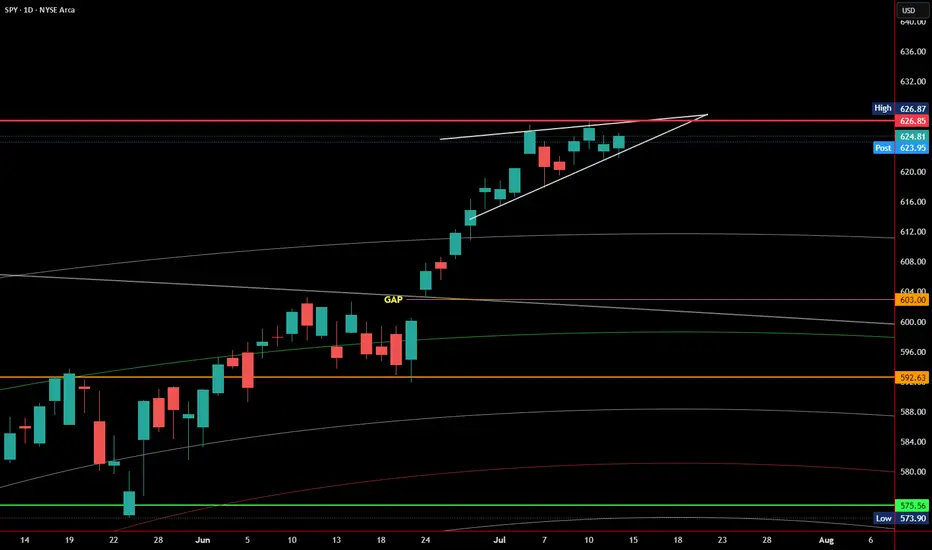
SPY Daily Chart – Rising Wedge at Resistance, RSI Near OverboughSPY continues to push higher, but today's candle reinforces a cautious tone as we approach a key inflection point.
The chart is currently forming a rising wedge pattern — historically a bearish structure that often precedes downside breaks, especially when forming after a strong upside move. Price is hugging the upper boundary of the wedge, with multiple failed breakout attempts near 626.87, which is acting as strong resistance.
The RSI sits at 68.59, just below the 70 overbought threshold. While this confirms strong bullish momentum, it also signals that the move may be getting stretched. A rejection here or a lower high on RSI while price continues higher could form a bearish divergence, a classic early reversal signal.
Volume remains moderate (~51.85M), and the candles have tightened — suggesting indecision. The rising wedge’s lower trendline and the short-term moving average (likely the 8 or 10 EMA) are immediate support. A break below these levels would shift the bias more clearly to the downside.
Key levels to watch:
Resistance: 626.87 (wedge top)
Support: rising wedge lower boundary and EMA (around 620–622)
RSI: break below 65 or a confirmed divergence would increase bearish risk
If the wedge breaks down with a drop in RSI and a flip in momentum indicators (such as Parabolic SAR), it may open the door for a pullback toward previous support zones near 603 or even 592.63.
No confirmation yet, but the risk-reward here starts to shift away from chasing longs. Caution is warranted.
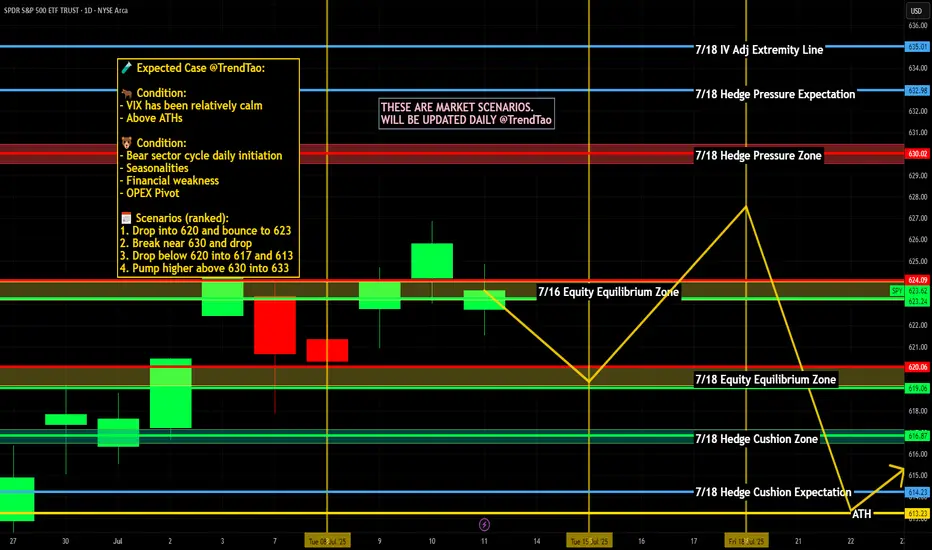
Nightly $SPY / $SPX Scenarios for July 15, 2025🔮 Nightly AMEX:SPY / SP:SPX Scenarios for July 15, 2025 🔮
🌍 Market-Moving News 🌍
📦 Dow Futures Dip on New Tariff Announcements
President Trump announced new 30% tariffs on EU and Mexico, with additional duties on Japan, South Korea, Malaysia, Kazakhstan, South Africa, Laos, and Myanmar starting August 1. Dow, S&P, and Nasdaq futures each slipped ~0.3% as markets assess inflation risk ahead of key CPI data this week
📈 Tech & AI Stocks Lead Despite Tariffs
Stocks like Circle (+9.3%), CoreWeave (+5.2%), Palantir (+5%), Roblox (+5.8%), and Shopify (+4.1%) surged, showcasing sector resilience amid broader tariff fears
⚠️ Deutsche Bank Warns of Summer Volatility
With thin market liquidity and rising geopolitical tension (tariff deadline Aug 1), Deutsche Bank flags summer as a period prone to sudden corrections
📊 Key Data Releases & Events 📊
📅 Tuesday, July 15:
8:30 AM ET – CPI (June)
Core CPI is projected at +0.3% MoM (2.7% YoY) and headline CPI +0.3% MoM—signs tariff effects may be feeding into prices
8:30 AM ET – Core CPI (June)
Expected to come in around 3.0% YoY.
8:30 AM ET – Empire State Manufacturing Survey (July)
Forecast: –7.8 (less negative than June’s –16.0) — a modest sign of stabilizing factory conditions
Fed Speakers Throughout the Day
Watch for commentary from Fed officials (Michael Barr, Barkin, Collins, Logan) for fresh insights on inflation and monetary policy
⚠️ Market Interpretation:
Inflation Watch: A hotter-than-expected CPI could delay anticipated rate cuts and lift yields. A pick-up in core CPI above 3% would be a red flag.
Growth Signals: A less-negative Empire State reading may suggest improving industrial momentum but still signals contraction.
Political Risk: Tariff escalation could shift investor appetite, even if markets right now are focusing on broader macro narratives.
Volatility Setup: The combination of thin liquidity, tariff uncertainty, and critical data makes for a potentially choppy week.
📌 #trading #stockmarket #economy #inflation #tariffs #Fed #CPI #manufacturing #technicalanalysis
SPX 6300 Highs to 6200 Lows - Watch Key LevelsThis week earnings season kicks off
-Notables include JPM, GS, BAC, WFC, NFLX, KMI, PEP and others
US Inflation (CPI and PPI) this week
-forecasts are showing HIGHER inflation
-consumers care, but markets may not
6300-6350 key resistance area for SPX
6200 key support area for SPX
If we break the 6200 floor, there's room to fall to 6000-5700 to find stronger support
I discuss the 50 day moving averarages on the S&P and Nasdaq as levels to watch
For the remainder of the month...
7/18 July Monthly Expiration
7/30 US FOMC (with Press Conference)
8/1 US Non-Farm
8/1 US Tariff Deadline (per Trump)
Markets will have to really love a slew of good earnings and good news to see more highs and melt-ups through this typically bumpy season (Aug-Sep)
Thanks for watching!!!

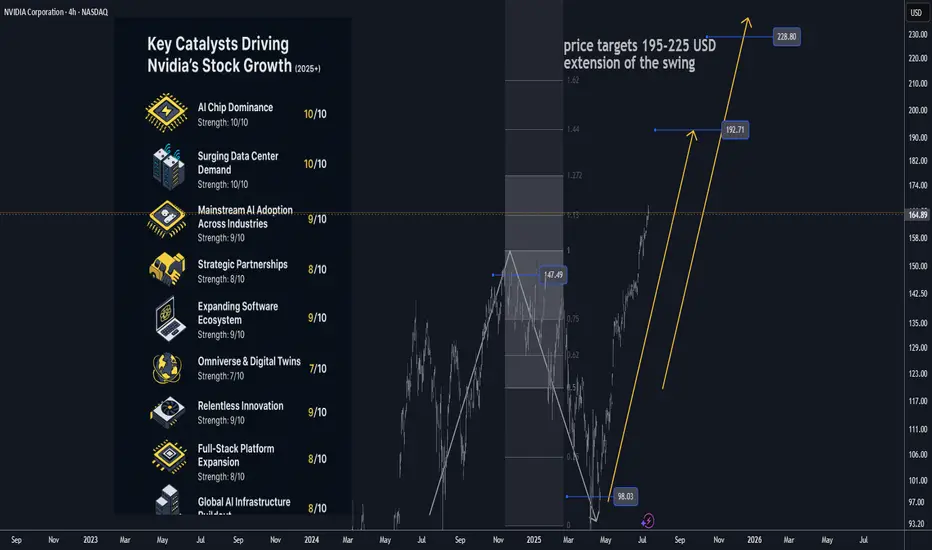
Nvidia (NVDA) 2025+ Catalysts & Risks: Analyst Views🚀 Nvidia (NVDA) 2025+ Catalysts & Risks: Analyst Views
🔑 Key Catalysts Driving Nvidia’s Stock Growth (2025+)
1. 🏆 AI Chip Dominance
Nvidia maintains >90% market share in data-center AI chips (Blackwell, Hopper, Rubin). Its CUDA ecosystem and relentless innovation keep it as the “default” supplier for advanced AI, giving NVDA massive pricing power.
2. 🏗️ Surging Data Center Demand
Cloud and enterprise AI spending remains white-hot. Tech giants (Meta, Microsoft, Amazon, Google) are collectively pouring $300B+ into 2025 AI CapEx. Data center revenues are at all-time highs; analysts expect this uptrend to extend through 2026 as “AI infrastructure arms race” persists.
3. 🌐 Mainstream AI Adoption
AI is now integrated in nearly every industry—healthcare, finance, logistics, manufacturing, retail. As companies embed AI at scale, NVDA’s hardware/software sales rise, with “AI everywhere” tailwinds supporting 15–25% annual growth.
4. 🤝 Strategic Partnerships
Big wins: Deals with Snowflake, ServiceNow, and massive sovereign/international AI collaborations (e.g., $B+ Saudi Arabia/“Humain” order for Blackwell superchips; UAE, India, and Southeast Asia ramping up AI infrastructure using Nvidia).
5. 🚗 Automotive/Autonomous Vehicles
NVDA’s automotive AI segment is now its fastest-growing “new” business line, powering next-gen vehicles (Jaguar Land Rover, Mercedes, BYD, NIO, Lucid) and expected to surpass $1B+ annual run rate by late 2025.
6. 🧑💻 Expanding Software Ecosystem
Nvidia’s “full stack” software (CUDA, AI Enterprise, DGX Cloud) is now a sticky, recurring-revenue engine. Over 4M devs are building on Nvidia’s AI SDKs. Enterprise AI subscriptions add high-margin growth on top of hardware.
7. 🌎 Omniverse & Digital Twins
Industrial metaverse and simulation/digital twin momentum is building (major partnerships with Ansys, Siemens, SAP, Schneider Electric). Omniverse becoming the industry standard for 3D AI/simulation, unlocking new GPU/software demand.
8. 🛠️ Relentless Innovation
Blackwell Ultra GPUs debuting in late 2025, “Rubin” architecture in 2026. Fast-paced, aggressive product roadmap sustains Nvidia’s tech lead and triggers constant upgrade cycles for data centers and cloud providers.
9. 📦 Full-Stack Platform Expansion
Grace CPUs, BlueField DPUs, and Spectrum-X networking mean Nvidia is now a “one-stop shop” for AI infrastructure—capturing more value per system and displacing legacy CPU/network vendors.
10. 🌏 Global AI Infrastructure Buildout
Recent US export rule rollbacks are a huge tailwind, opening up new high-volume markets (Middle East, India, LatAm). Nvidia remains the “go-to” AI chip supplier for sovereign and enterprise supercomputers outside the US, supporting continued global growth.
________________________________________
📈 Latest Analyst Recommendations (July 2025)
•Street Consensus: Overwhelmingly bullish—~85% of analysts rate NVDA as “Buy/Overweight” (rest “Hold”), with target prices often in the $140–$165 range (post-split, as applicable).
•Target Price Range: Median 12-month PT: $150–$160 (representing ~20% upside from July 2025 levels).
•Key Bullish Arguments: Unmatched AI chip lead, accelerating enterprise AI adoption, deep software moat, and a robust international/sovereign AI order pipeline.
•Cautious/Bearish Notes: Valuation premium (45–50x P/E), high expectations priced in, geopolitical and supply chain risks.
________________________________________
⚠️ Key Negative Drivers & Risks
1. 🇨🇳 US–China Tech War / Chip Export Restrictions
• US restrictions: While the Biden administration eased some export bans in May 2025 (allowing more AI chip exports to Gulf/Asia partners), China remains subject to severe curbs on advanced NVDA AI chips.
• Workarounds: Nvidia is selling modified “China-compliant” chips (H20, L20, A800/H800), but at lower margins and lower performance.
• Risk: If US tightens controls again (post-election), China sales could fall further. Chinese firms (Huawei, SMIC, Biren) are also racing to build their own AI chips—posing long-term competitive risk.
2. 🏛️ Political/Regulatory Risk
• Election year: A US policy shift (e.g., harder tech stance after Nov 2025 election) could re-restrict exports, limit new markets, or disrupt supply chains (especially TSMC foundry reliance).
3. 🏷️ Valuation Risk
• NVDA trades at a substantial premium to tech/semiconductor peers (45–50x fwd earnings). Any AI “spending pause” or earnings miss could trigger sharp volatility.
4. 🏭 Supply Chain & Capacity Constraints
• As AI chip demand soars, there’s ongoing risk of supply/delivery bottlenecks (memory, HBM, advanced packaging), which could cap near-term revenue upside.
5. 🏁 Competitive Threats
• AMD, Intel, and custom in-house AI chips (by Google, Amazon, Microsoft, Tesla, etc.) are scaling up fast. Loss of a hyperscaler account or a successful open-source software alternative (vs CUDA) could erode Nvidia’s dominance.
6. 💵 Customer Concentration
• A small handful of cloud giants account for >35% of revenue. Delays or pullbacks in their AI spending would materially impact results.
________________________________________
📝 Summary Outlook (July 2025):
Nvidia’s AI chip monopoly, software moat, and global AI arms race create a powerful multi-year growth setup, but the stock’s high valuation and US-China chip tension are real risks. Analyst consensus remains strongly positive, with most seeing more upside as data-center and enterprise AI demand persists—but with increased focus on geopolitical headlines and potential supply chain hiccups.
________________________________________
MSTR -- Cup & Handle Breakout // Long & Short SetupsHello Traders!
There is a beautiful cup and handle pattern that has formed on MSTR (Microstrategy).
This pattern offers us a wonderful long setup, as well as a potential short at the all time high.
Pattern Failure: If price both breaks and confirms below the C&P neckline the pattern is void.
Price will likely temporarily pull back from the all time high, giving us our short setup. However you'll want to be in and out quick considering price will likely continue to new highs after pulling back.
I will be swing trading the long setup and likely day trading the short setup.
Have fun and best of luck to everyone on their trading journey!

S&P 500: Time For A Pullback??
In this Weekly Market Forecast, we will analyze the S&P 500 for the week of July 14 - 18th.
The S&P 500 had a strong week, until Tariff Tensions Friday arrived.
This by itself doesn't mean we should start looking for sells. With Tuesday CPI Data coming, this short term consolidation is to be expected until the news is announced.
Let the markets pick a direction, and flow with it.
Have a plan of action in place so you can react to the price action promptly!
Enjoy!
May profits be upon you.
Leave any questions or comments in the comment section.
I appreciate any feedback from my viewers!
Like and/or subscribe if you want more accurate analysis.
Thank you so much!
Disclaimer:
I do not provide personal investment advice and I am not a qualified licensed investment advisor.
All information found here, including any ideas, opinions, views, predictions, forecasts, commentaries, suggestions, expressed or implied herein, are for informational, entertainment or educational purposes only and should not be construed as personal investment advice. While the information provided is believed to be accurate, it may include errors or inaccuracies.
I will not and cannot be held liable for any actions you take as a result of anything you read here.
Conduct your own due diligence, or consult a licensed financial advisor or broker before making any and all investment decisions. Any investments, trades, speculations, or decisions made on the basis of any information found on this channel, expressed or implied herein, are committed at your own risk, financial or otherwise.

Weekly $SPY / $SPX Scenarios for July 14–18, 2025🔮 Weekly AMEX:SPY / SP:SPX Scenarios for July 14–18, 2025 🔮
🌍 Market-Moving News 🌍
⚖️ Powell Faces ‘Epic’ Trade‑Inflation Dilemma
Former Fed economists warn Chair Powell is navigating nearly unprecedented terrain: tariffs are pushing up prices even as the labor market cools. Striking a balance between inflation control and growth support remains a formidable challenge
📊 Tariff‑Driven Inflation May Peak This Week
June’s CPI is expected to show a 0.3% month-on-month increase, potentially lifting core inflation to ~2.7%—its highest level in 18 months. These data will heavily influence the Fed’s decision-making process
🏦 Big Bank Earnings Kick Off
Earnings season begins with JPMorgan ( NYSE:JPM ), Goldman Sachs ( NYSE:GS ), Wells Fargo ( NYSE:WFC ), and Citigroup ($C) reporting. Strong results could offset trade and inflation anxieties; expect volatility in financials
📈 Goldman Sees Broader S&P Rally
Goldman Sachs projects the S&P 500 to climb roughly 11% to 6,900 by mid‑2026, underpinned by firm earnings and expected Fed rate cuts. But warns that breadth remains narrow, increasing downside risk without robust participation
⚠️ Summer Volatility Risk Lingers
Deutsche Bank warns that summer’s low liquidity and the looming Aug 1 tariff re‑imposition deadline may spark sudden market turbulence—even amid bullish sentiment
📊 Key Data Releases & Events 📊
📅 Monday, July 14
Quiet start—markets digest back-to-back CPI, tariffs, and clearing post‑earnings.
📅 Tuesday, July 15
8:30 AM ET – Consumer Price Index (June)
Watch for potential tariff impact in CPI; core inflation data are crucial.
8:30 AM ET – Core CPI (June)
10:00 AM ET – Empire State Manufacturing Survey (July)
Early view on Northeast factory trends.
📅 Wednesday, July 16
8:30 AM ET – Producer Price Index (June)
Wholesale inflation signals to validate CPI trends.
10:00 AM ET – Housing Starts & Building Permits (June)
📅 Thursday, July 17
8:30 AM ET – Initial & Continuing Jobless Claims
A gauge on labor-market resilience amid talks of cooling.
📅 Friday, July 18
10:00 AM ET – Federal Reserve Beige Book Release
Fed’s regional economic snapshot ahead of next FOMC.
⚠️ Disclaimer:
This is for educational/informational use only—not financial advice. Consult a licensed professional before investing.
📌 #trading #stockmarket #economy #tariffs #inflation #earnings #Fed #CPI #technicalanalysis
Inevitable Pull Back Coming Soon? | NVDA TSLA AAPL AMZN META MSFStock Market Forecast | CME_MINI:ES1! CME_MINI:NQ1! SPY QQQ
Mag 7 Forecast | NASDAQ:NVDA NASDAQ:TSLA AAPL AMZN META MSFT July 2025 Forecast

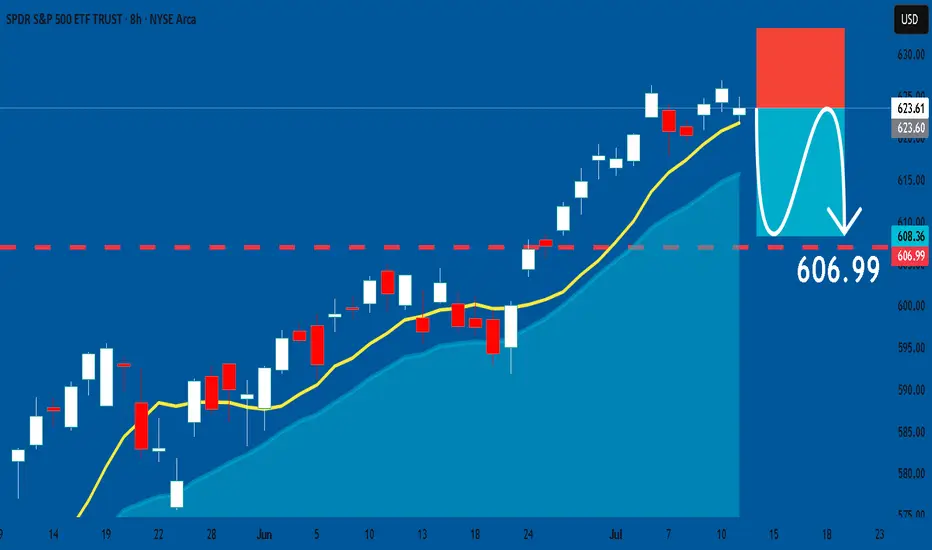
SPY: Short Signal Explained
SPY
- Classic bearish formation
- Our team expects pullback
SUGGESTED TRADE:
Swing Trade
Short SPY
Entry - 623.61
Sl - 633.09
Tp - 606.99
Our Risk - 1%
Start protection of your profits from lower levels
Disclosure: I am part of Trade Nation's Influencer program and receive a monthly fee for using their TradingView charts in my analysis.
❤️ Please, support our work with like & comment! ❤️
Sector Rotation Strategy🌐 Sector Rotation Strategy: A Smart Way to Stay Ahead in the Stock Market
What Is Sector Rotation?
Imagine you're playing cricket. Some players shine in certain conditions — like a fast bowler on a bouncy pitch or a spinner on a turning track. The same idea applies to stock market sectors.
Sector Rotation is the process of shifting your money from one sector to another based on the market cycle, economic trends, or changing investor sentiment.
In simple words:
"You’re moving your money where the action is."
First, What Are Sectors?
The stock market is divided into different sectors, like:
Banking/Financials – HDFC Bank, Kotak Bank, SBI
IT– Infosys, TCS, Wipro
FMCG – HUL, Nestle, Dabur
Auto – Maruti, Tata Motors
Pharma – Sun Pharma, Cipla
Capital Goods/Infra – L&T, Siemens
PSU – BEL, BHEL, HAL
Real Estate, Metals, Energy, Telecom, etc.
Each sector behaves differently at various stages of the economy.
Why Is Sector Rotation Important?
Because all sectors don’t perform well all the time.
For example:
In a bull market, sectors like Auto, Capital Goods, and Infra usually lead.
During slowdowns, investors run to safe havens like FMCG and Pharma.
When inflation or crude oil rises, energy stocks tend to do better.
When interest rates drop, banking and real estate might shine.
So, instead of holding poor-performing sectors, smart investors rotate into the hot ones.
How Does Sector Rotation Work?
Let’s say you are an investor or trader.
Step-by-step guide:
Track the economy and markets
Is GDP growing fast? = Economy expanding
Are interest rates high? = Tight liquidity
Is inflation cooling down? = Growth opportunity
Observe sectoral indices
Check Nifty IT, Nifty Bank, Nifty FMCG, Nifty Pharma, etc.
See which are outperforming or lagging.
Watch for news flow
Budget announcements, RBI policy, global cues, crude oil prices, etc.
E.g., Defence orders boost PSU stocks like BEL or HAL.
Move your capital accordingly
If Infra and Capital Goods are breaking out, reduce exposure in IT or FMCG and rotate into Infra-heavy stocks.
Real Example (India, 2024–2025)
Example: Rotation from IT to PSU & Infra
In late 2023, IT stocks underperformed due to global slowdown and US recession fears.
Meanwhile, PSU and Infra stocks rallied big time because:
Government increased capital expenditure.
Defence contracts awarded.
Railway budget saw record allocations.
So, many smart investors rotated out of IT and into:
PSU Stocks: RVNL, BEL, HAL, BHEL
Capital Goods/Infra: L&T, Siemens, ABB
Railway Stocks: IRFC, IRCTC, Titagarh Wagons
This sector rotation gave 30%–100% returns in a few months for many stocks.
Tools You Can Use
Sectoral Charts on TradingView / Chartink / NSE
Use indicators like RSI, MACD, EMA crossover.
Compare sectors using “Relative Strength” vs Nifty.
Economic Calendar
Track RBI policy, inflation data, IIP, GDP, etc.
News Portals
Moneycontrol, Bloomberg, ET Markets, CNBC.
FIIs/DII Activity
Where the big money is going – this matters!
Sector Rotation Heatmaps
Some platforms show weekly/monthly performance of sectors.
📈 Sector Rotation Strategy for Traders
For short-term traders (swing/intraday):
Rotate into sectors showing strength in volumes, price action, breakouts.
Use tools like Open Interest (OI) for sector-based option strategies.
Example:
On expiry weeks, if Bank Nifty is showing strength with rising OI and volume, rotate capital into banking-related trades (Axis, ICICI, SBI).
Sector Rotation for Long-Term Investors
For investors, sector rotation can be used:
To reduce drawdowns.
To book profits and re-enter at better levels.
To ride economic trends.
Example:
If you had exited IT in late 2022 after a rally, and entered PSU stocks in early 2023, your portfolio would’ve seen better growth.
Pros of Sector Rotation
Better returns compared to static investing
Helps avoid underperforming sectors
Takes advantage of macro trends
Works in both bull and bear markets
Cons or Risks
Requires monitoring and active management
Timing the rotation is difficult
Wrong rotation = underperformance
May incur tax if frequent buying/selling (for investors)
Pro Tips
Don't rotate too fast; let the trend confirm.
Use SIPs or staggered entry in new sectors.
Avoid “hot tips”; follow actual price and volume.
Blend sector rotation with strong stock selection (don’t just chase sector).
Conclusion
The Sector Rotation Strategy is one of the smartest, most practical tools used by both traders and investors. You don’t need to be a pro to use it — just stay alert to the market mood, economic cycles, and where the money is moving.
Think of it as dancing with the market:
“When the music changes, you change your steps.”
Keep rotating. Keep growing.