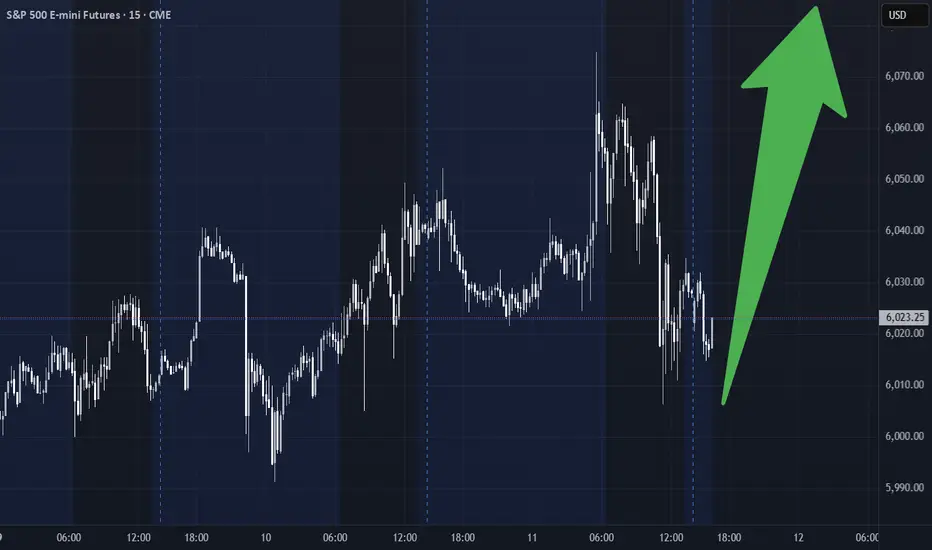
06/16/25 Trade Journal, and ES_F Stock Market analysisEOD accountability report: +450
Sleep: 7 hours
Overall health: Good
What was my initial plan? I knew today was contract rollovers and decided not to trade it, but after noticing that the x1 signals were working pretty good today, i decided to take some plays at the soft support and resistances.
**Daily Trade recap based on VX Algo System from (9:30am to 2pm)**
Lot of X7 buy signals (usual signal that market is bullish)
— 10:40 AM VXAlgo ES X1 Sell Signal (triple signal)
— 11:56 AM VXAlgo ES X3 Sell Signal
— 12:30 PM Market Structure flipped bearish on VX Algo X3!
— 1:20 PM VXAlgo ES X1 Buy signal
Next day plan--> Above 6010 = Bullish, Under 5965= Bearish
Video Recaps -->https://tradingview.sweetlogin.com/u/WallSt007/#published-charts
SPDR S&P 500 ETF (SPY)

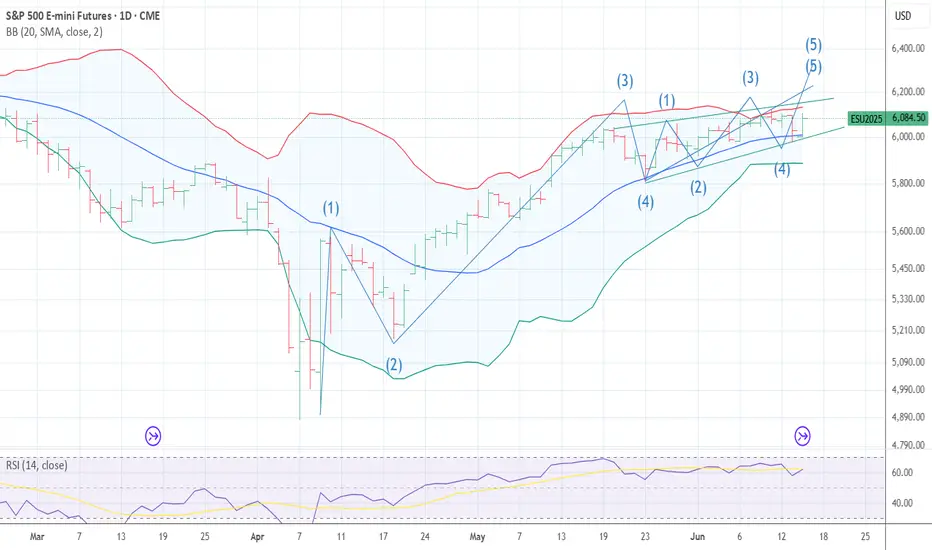
Wave 5 up in a Diagonal could be hours away The chart posted is the sp 500 futures back in april 10 th I labeled the low at 5102 as wave B or 2 both called for sharp rally to as high as 6147 in which wave 1 or a x 1.168 = 3 or c for a wave B top . since then I saw the high at 5968 as the end of wave 3 top and then looked for a drop back to 5669 we saw 5667 and so far all rallies have taken a 3 wave formation in which Most but Not all times this is occurring in an ending diagonal and in each wave we saw so far .887 the preceding wave . I have traded in and out and I am waiting for a final push up to 6083/6147 midpoint 6100 to take a short position . The alt is a small series of 4/5 4/5 4/5 if this were the count we would then break ABOVE 6147 and then reach 6330 . I am waiting to confirm .Best of trades WAVETIMER
SPY/QQQ Plan Your Trade For 6-16 : Up-Down-Up PatternToday's Up-Down-Up Pattern suggests the markets will transition into a moderate upward trending price bar - which is quite interesting in the world we have today.
War and a big weekend of events, protests and other new items could drive market trends over the next few days.
Still, the SPY Cycle Pattern for today is an Up-Down-Up - which suggests last Thursday was an Up bar, last Friday was a Down bar, and today should be an Up bar.
The Gold/Silver pattern is a POP pattern in Counter-trend.
I believe the US markets are benefiting as a safe-haven for capital as the global turmoil drives global investors to seek safety and security for their capital.
That means as long as the world continues to spin out of control, the US markets and the US-Dollar will act as a moderate safe-haven for capital.
Gold and Silver should also benefit from this global chaos.
Bitcoin is benefiting from the strength of the US markets (and the technology sector) as well.
Let's see how this week start to play out. I'm waiting for some more news.
Could be very interesting this week.
Get some.
#trading #research #investing #tradingalgos #tradingsignals #cycles #fibonacci #elliotwave #modelingsystems #stocks #bitcoin #btcusd #cryptos #spy #gold #nq #investing #trading #spytrading #spymarket #tradingmarket #stockmarket #silver

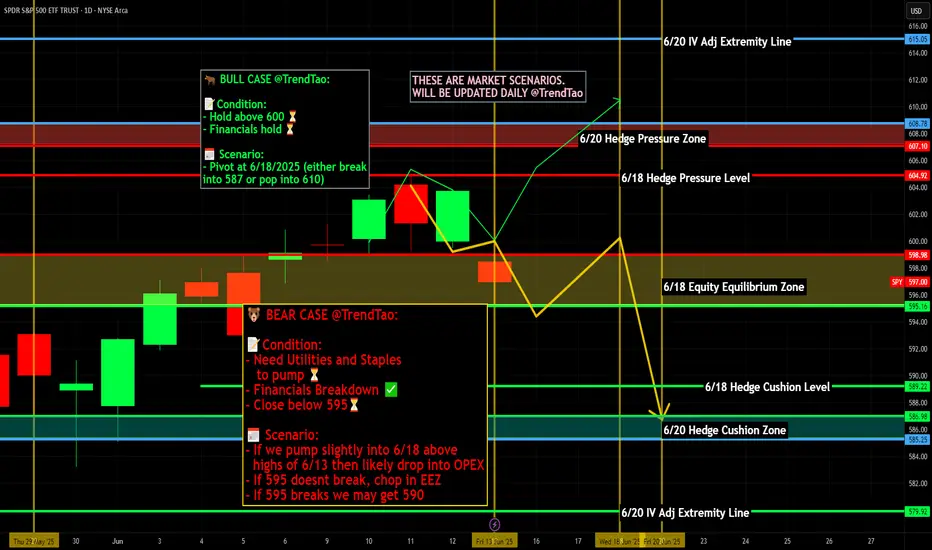
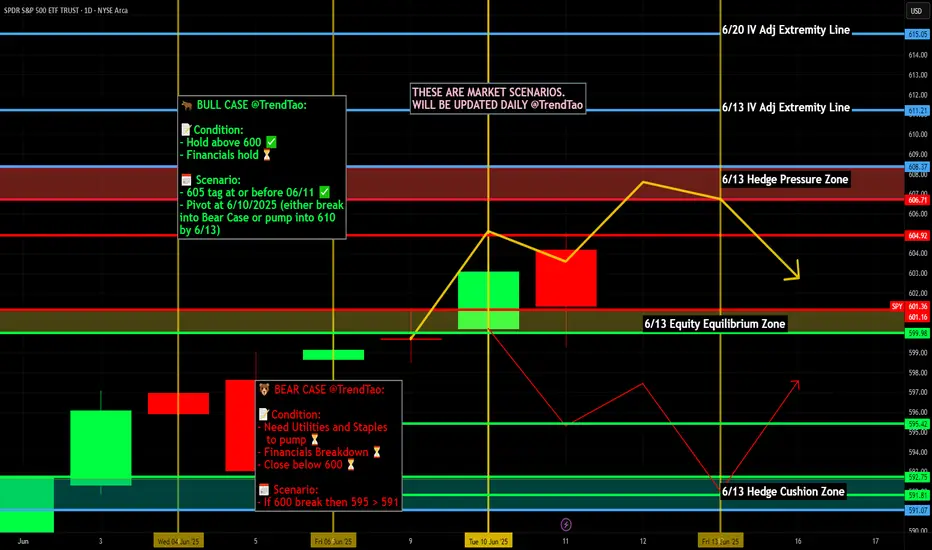
Weekly $SPY / $SPX Scenarios for June 16–20, 2025 🔮 Weekly AMEX:SPY / SP:SPX Scenarios for June 16–20, 2025 🔮
🌍 Market-Moving News 🌍
🏦 Fed Holds Rates, Powell Expresses Caution
The Federal Reserve is widely expected to keep rates at 4.25–4.50%, though Chair Powell likely won’t provide fresh guidance. Markets see limited upside without stronger inflation or growth cues
💱 Dollar Strengthens on Geopolitical Risk
The U.S. dollar rose slightly as investors flocked to safe assets amid global tensions with Iran. Treasury yields eased slightly on risk-off flows
🛢️ Oil Near Multi-Week Highs on Mideast & OPEC Dynamics
Oil held near seven-week highs (~$67–70/barrel), buoyed by Iran-Israel tensions and OPEC+ output hikes (411K bpd added from May–July), offset by demand concerns .
⚠️ G7 Summit Faces Heightened Stakes
G7 finance ministers meet in Canada under pressure from Middle East escalation. Watch for policy coordination and commentary on trade, inflation, and global economic risks .
📊 Key Data Releases & Events 📊
📅 Monday, June 16
Regular markets open after Juneteenth holiday
Quiet day; oil & geopolitical headlines dominate
📅 Tuesday, June 17
8:30 AM ET – Retail Sales (May): Signals consumer spending strength/duration
8:30 AM ET – CPI (May): Confirms inflation trend post-CPI cooler reading
10:00 AM ET – Housing Starts & Building Permits (May): Gauges housing market demand
Unexpected Tesla Robotaxi Demo (Austin): Watch for surprise developments this week
📅 Wednesday, June 18
Global Central Bank Day: FOMC, BoE, BoJ policy updates; U.S. Fed will most likely hold steady
📅 Thursday, June 19 – Juneteenth Holiday – U.S. markets closed
📅 Friday, June 20
8:30 AM ET – Existing Home Sales (May): Measures U.S. housing activity
10:00 AM ET – Leading Economic Indicators (May): Early snapshot of economic momentum
⚠️ Disclaimer:
This information is for educational and informational purposes only and should not be construed as financial advice. Always consult a licensed financial advisor before making investment decisions.
📌 #trading #stockmarket #economy #news #trendtao #charting #technicalanalysis
Buy OIL & GOLD, Sell Stocks Indices When Missiles Are Flying!In this Weekly Market Forecast, we will analyze the S&P 500, NASDAQ, DOW JONES, Gold and Silver futures, for the week of June 16-20th.
When missiles start flying in the Middle East, investors become reactively risk averse. Money goes from stocks to safe havens and oil. That's it. Expect oil prices to rise, Gold to reach new highs, and the equity markets to see more sellers than buyers.
This environment may last a few days or a few weeks. Keep an ear to the news.
Enjoy!
May profits be upon you.
Leave any questions or comments in the comment section.
I appreciate any feedback from my viewers!
Like and/or subscribe if you want more accurate analysis.
Thank you so much!
Disclaimer:
I do not provide personal investment advice and I am not a qualified licensed investment advisor.
All information found here, including any ideas, opinions, views, predictions, forecasts, commentaries, suggestions, expressed or implied herein, are for informational, entertainment or educational purposes only and should not be construed as personal investment advice. While the information provided is believed to be accurate, it may include errors or inaccuracies.
I will not and cannot be held liable for any actions you take as a result of anything you read here.
Conduct your own due diligence, or consult a licensed financial advisor or broker before making any and all investment decisions. Any investments, trades, speculations, or decisions made on the basis of any information found on this channel, expressed or implied herein, are committed at your own risk, financial or otherwise.

Stock Market Forecast | TSLA NVDA AAPL AMZN META MSFTStock Market Forecast | CME_MINI:NQ1! CME_MINI:ES1! SPY QQQ
Mag 7 Forecast | NASDAQ:TSLA NVDA AAPL AMZN META MSFT GOOG


SPY: Expecting Bullish Movement! Here is Why:
The analysis of the SPY chart clearly shows us that the pair is finally about to go up due to the rising pressure from the buyers.
Disclosure: I am part of Trade Nation's Influencer program and receive a monthly fee for using their TradingView charts in my analysis.
❤️ Please, support our work with like & comment! ❤️
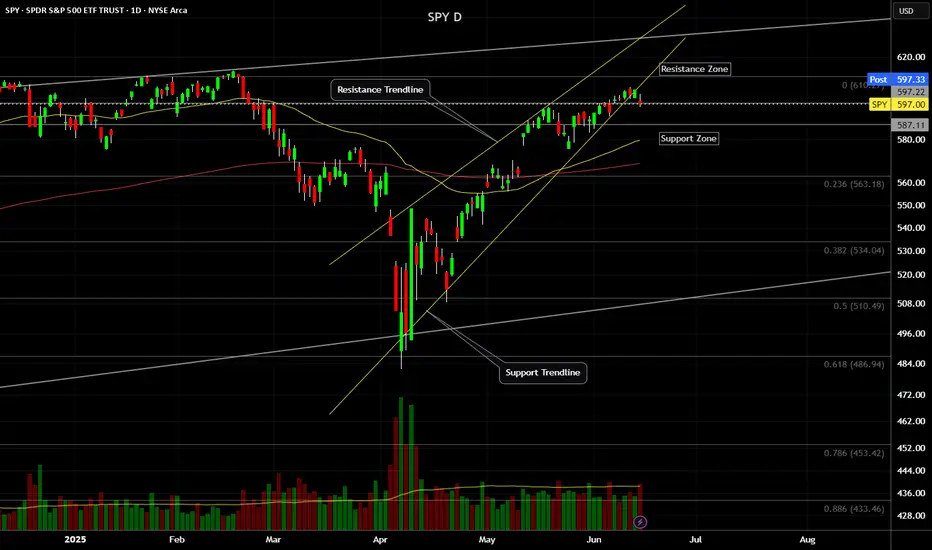
SPY (S&P500) - Price Testing Support Trendline - Daily ChartSPY (S&P500 ETF) price has just closed below $600 and is currently under a support trendline.
If price cannot breakout above the $600 and $605 resistance level this month, a pullback could occur down to the support zone.
SPY price could potentially pullback to various levels of support due to:
-USA domestic conflict
-International military conflicts
-Technical chart bearish divergence
-USA federal reserve interest rate news
-Government and corporate news
Support Levels: $595, $590, $585, $580.
Resistance Levels: $600, $605, $610, $615.
The 50EMA/200EMA Golden Cross is still on-going, and support prices of $580 and $568 have yet to be tested significantly.
06/13/25 Trade Journal, and ES_F Stock Market analysisEOD accountability report: +3825
Sleep: 5.5 hours (sleep is declining, will spend the weekend catching up)
Overall health: Good
What was my initial plan? I wanted to short 6016-6020 area in the morning but we didn't open up to that, so i just sat on sideline until we hit the 6025 , took a big short there and paid off really well.
Daily Trade recap based on VX Algo System from (9:30am to 2pm)
— 9:30 AM Market Structure flipped bearish on VX Algo X3!
— 10:30 AM Market Structure flipped bearish on VX Algo X3!
— 10:40 AM VXAlgo YM X1 Buy Signal
— 11:30 AM Market Structure flipped bullish on VX Algo X3!
— 12:21 PM VXAlgo ES X1 Sell Signal (double signal)
— 1:12 PM VXAlgo NQ X3 Sell Signal
— 1:30 PM Market Structure flipped bearish on VX Algo X3!
Next day plan--> Above 6010 = Bullish, Under 5965= Bearish
Video Recaps -->https://tradingview.sweetlogin.com/u/WallSt007/#published-charts

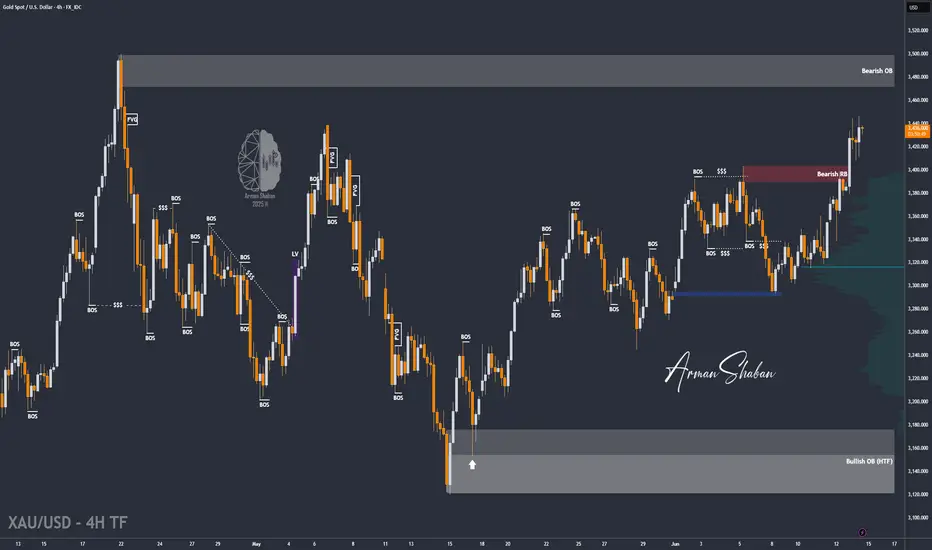
Gold Breaks $3400 – Targets $3500 Amid Tensions (READ)By analyzing the gold chart on the lower timeframe, we can see that today, following Israel's missile and airstrike attacks on Iran, gold experienced a sharp rally. As anticipated last night, gold finally managed to break through the strong $3400 resistance, surging over 600 pips to reach $3447.
Currently, gold is trading around $3438, and given the escalation in geopolitical tensions, I expect further upside movement.
The next potential targets are $3449, $3469, and possibly $3500.
⚠️ Due to ongoing conflict and extreme volatility, it's advised to avoid trading or proceed only with minimal risk exposure.
Please support me with your likes and comments to motivate me to share more analysis with you and share your opinion about the possible trend of this chart with me !
Best Regards , Arman Shaban
SPY/QQQ Plan Your Trade For 6-13 : Harami-Inside PatternToday's pattern suggests the markets may stall into a sideways price range.
After the news of Israel targeting Iran in a preemptive strike late yesterday afternoon, the markets moved dramatically lower while Gold & Silver moved higher on the news.
I, personally, see this market trend as a shift in thinking ahead of a long Father's Day weekend.
I see traders trying to position their accounts/trades for uncertainty.
I believe we could see a bit of a shift today - particularly in Metals and the QQQ/NASDAQ/BTCUSD.
Overall, I strongly suggest traders prepare for extreme volatility this weekend as any further news of a counter-strike or further military action in the Middle East could roil the markets.
Happy Friday the 13th - everyone.
Going to be an interesting day to say the least.
Get some.
#trading #research #investing #tradingalgos #tradingsignals #cycles #fibonacci #elliotwave #modelingsystems #stocks #bitcoin #btcusd #cryptos #spy #gold #nq #investing #trading #spytrading #spymarket #tradingmarket #stockmarket #silver

06/12/25 Trade Journal, and ES_F Stock Market analysisEOD accountability report: +437.50
Sleep: 6.5 hours
Overall health: Good
What was my initial plan?
market pumped heavily due to ppi data so I decided today was another oe of those days where you wait on the sideline for a better move.
1. until major levels are hit.
2. or a signal occur.
**Daily Trade recap based on VX Algo System from (9:30am to 2pm)**
10:57 AM VXAlgo ES X1 Sell Signal
2:00 PM VXAlgo NQ X3 Sell Signal
Next day plan--> Above 6010 = Bullish, Under 5950= Bearish
Video Recaps -->https://tradingview.sweetlogin.com/u/WallSt007/#published-charts

Nightly $SPY / $SPX Scenarios for June 13, 2025 🔮 Nightly AMEX:SPY / SP:SPX Scenarios for June 13, 2025 🔮
🌍 Market-Moving News 🌍
🚨 Israel Strikes Iran — U.S. Markets Sell Off
Israel launched airstrikes on Iran’s nuclear and military facilities, triggering a sharp risk-off move in global markets. U.S. stock futures slid over 1%, driven by a drop in equities and a surge in safe-haven assets
🛢️ Oil Prices Surge 7–8% on Supply Fears
Brent crude jumped over 7%, reaching ~$74.65/barrel, while WTI rose nearly 8%—the strongest move since early May. The sudden energy-price spike reflects heightened fears of supply disruptions in the Middle East
💱 Dollar & Safe Havens Climb
True to form, the U.S. dollar, Japanese yen, Swiss franc, gold, and Treasuries rallied as investors moved to the safety of low-risk assets amid escalating geopolitical uncertainty
📊 Key Data Releases 📊
📅 Friday, June 13
(No scheduled U.S. economic data)
Data flow will take a backseat as markets digest geopolitical developments and await the weekend.
⚠️ Disclaimer:
This information is for educational and informational purposes only and should not be construed as financial advice. Always consult a licensed financial advisor before making investment decisions.
📌 #trading #stockmarket #geopolitics #oil #safety #charting #technicalanalysis

Volatility Incoming - But Price Will Say WhenKey levels on SPX and NDX
5905 big gamma level and hedging level for June 30 monthly and quarter expiration
DXY watching for potential bear trap and range trade
Gold, Silver, Bitcoin and others all discussed
Thanks for watching!!!

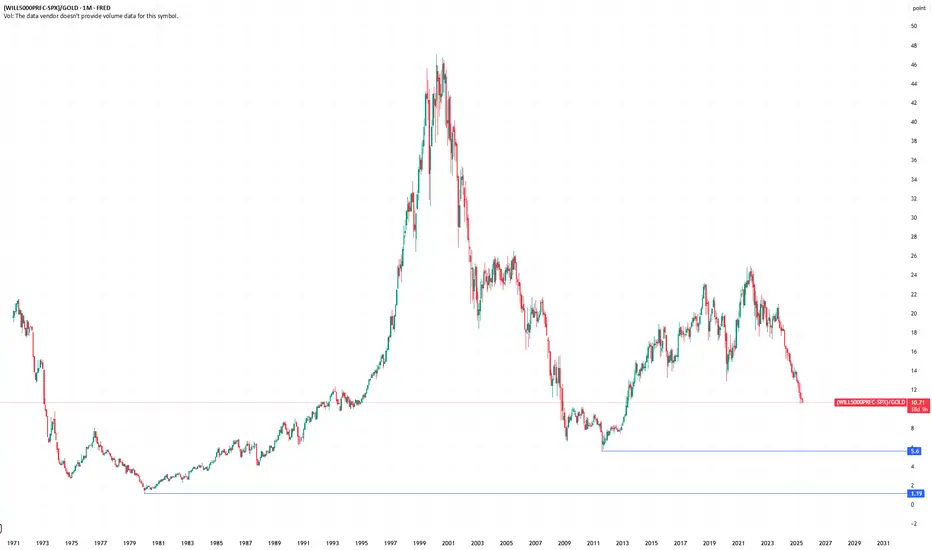
Small Stocks vs. GoldThis index represents small caps minus big caps, divided by gold. A good representation of how small companies in USA are doing related to gold (hard asset). You could argue that this is more representing of real economy and it's health.
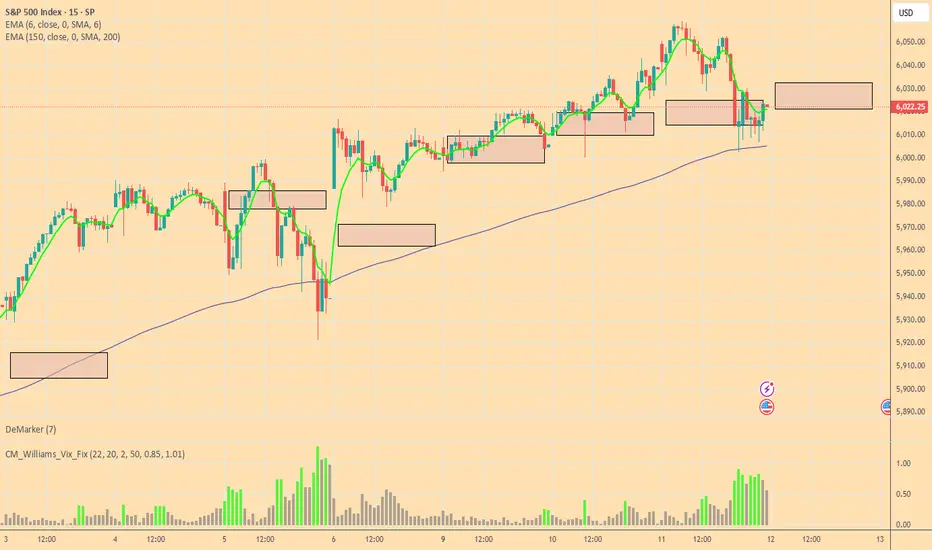
Bulls and Bears zone for 06-12-2025Overall market is continuing to rally in general.
However, market sold off during ETH session and it's trying to recover in the morning.
Level to watch : 6017----6019
SPY/QQQ Plan Your Trade For 6-12: BaseRally In Trend ModeToday's pattern suggests the markets may attempt to identify a base and move higher (rally) off that base level.
Given the overnight price activity, I suggest the process of identifying the base level could prompt a deeper early decline in price - possibly attempting to retest 595-597 lows before finding support and attempting to rally.
As I've been warning over the past few weeks/months, I'm still seeing the Excess Phase Peak pattern playing out as a Flag Termination - rolling into a downtrend and attempting to move back towards the $480 lows as a real possibility. I've been warning and watching for the breakdown in trend - but we've not seen it yet.
Thus, we are still BULLISH until we get a confirmation of a solid breakdown. That would be a move below the 580-585 level at this point. We need to see some type of solid breakdown in price, breaking away from the FLAG setup and moving downward, before I could confidently suggest the Flag Breakdown has happened.
Gold and Silver are making a big move higher. Gold is finally starting to move back above $3400 and I believe watching Silver, Gold, & Platinum rally suggests FEAR is elevating as we move into the end of June.
I still believe Gold has a chance to rally above $4k before the end of June. We'll see if it happens.
BTCUSD is moving into a DUAL-EPP pattern. This is very interesting. Watch the video as I highlight why this could prompt a dual-stage EPP breakdown in Bitcoin over the next 20 to 50+ days.
Get some.
#trading #research #investing #tradingalgos #tradingsignals #cycles #fibonacci #elliotwave #modelingsystems #stocks #bitcoin #btcusd #cryptos #spy #gold #nq #investing #trading #spytrading #spymarket #tradingmarket #stockmarket #silver

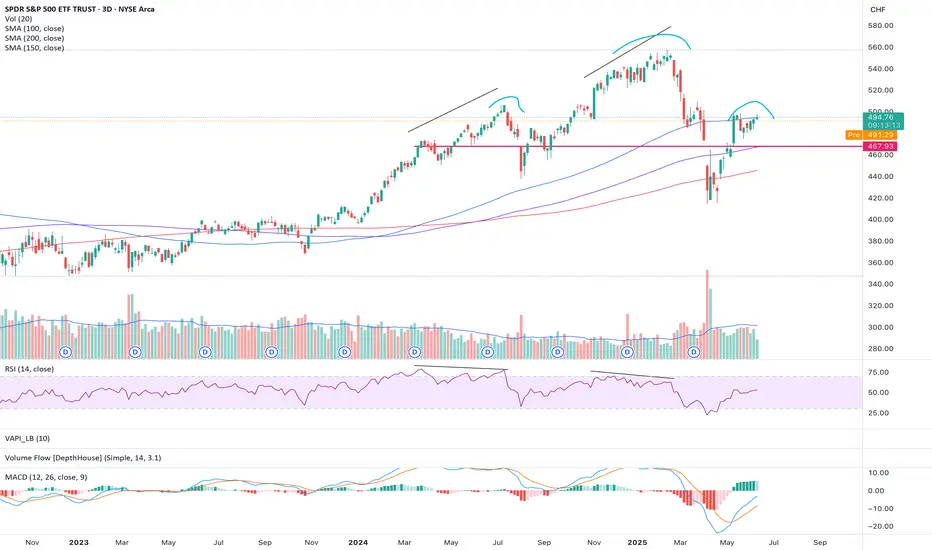
SP500 in CHF terms, bearish outlook- checking the SP500 in USD seems misleading these days
- therefore I checked it with CHF and earlier movements made more sense
- RSI bearish divergences were followed in earlier periods
- now we have a potential head and shoulders formation
- seems more likely to head south
Nightly $SPY / $SPX Scenarios for June 12, 2025🔮 Nightly AMEX:SPY / SP:SPX Scenarios for June 12, 2025 🔮
🌍 Market-Moving News 🌍
💱 Dollar Slides on Trade Truce Hopes & Fed Outlook
The U.S. dollar dropped 0.4%—its lowest level since April 22—after President Trump signaled flexibility on a July 8 trade deadline and U.S.–China talks showed renewed progress, boosting expectations for Fed rate cuts
📊 S&P Shiller CAPE Hints at Overvaluation Risk
Stocks and bonds rallied following rebound, but valuation metrics flash caution: the S&P 500 now sits in the 94th percentile of Shiller CAPE, and equity risk premium has dropped to zero. Analysts warn these levels often precede corrections
🛢️ Oil Holds at Seven-Week Highs
Oil prices remain near seven-week highs (~$66–67/barrel), supported by gradual OPEC+ output increases and hopes that easing trade tensions will aid demand
📈 CPI Cools Again, Bonds Climb
U.S. consumer inflation rose just 0.1% in May (2.4% YoY), easing expectations for tighter Fed policy. Consequently, Treasury yields softened and bond markets outperformed equities
📊 Key Data Releases 📊
📅 Thursday, June 12:
8:30 AM ET – Producer Price Index (May)
An early gauge of inflation at the wholesale level—may reinforce the cooling trend seen in CPI.
8:30 AM ET – Initial & Continuing Jobless Claims
Weekly updates on unemployment filings. Key to monitor for labor-market tightening or softening.
⚠️ Disclaimer:
This report is for educational and informational purposes only—it does not constitute financial advice. Always consult a licensed financial advisor before making investment decisions.
📌 #trading #stockmarket #economy #news #trendtao #charting #technicalanalysis
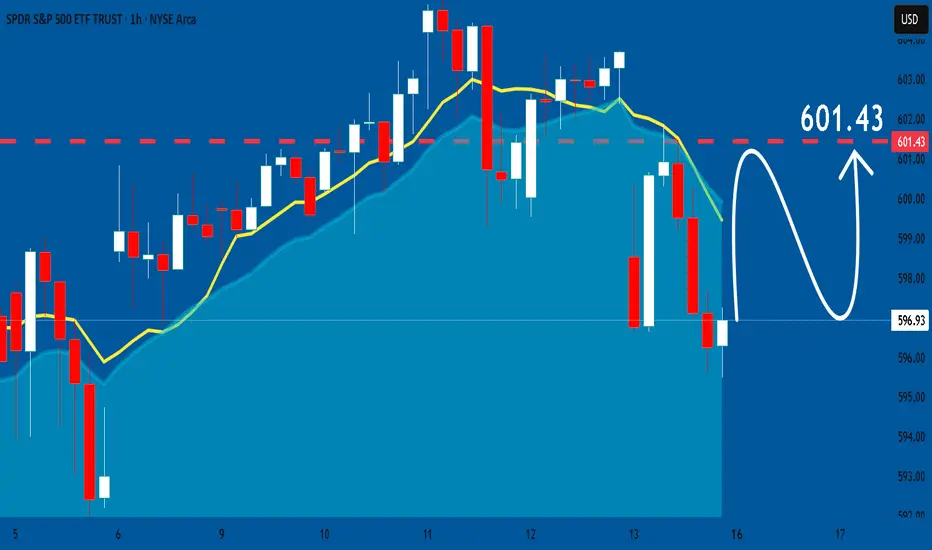
SPY SHORT FROM RESISTANCE|
✅SPY went up to retest
A horizontal resistance of 610$
Which is also an All-Time-High
So its a very strong level
Which makes me locally bearish biased
And I think that we will see a pullback
And a move down from the level
Towards the target below at 596.43$
SHORT🔥
✅Like and subscribe to never miss a new idea!✅
Disclosure: I am part of Trade Nation's Influencer program and receive a monthly fee for using their TradingView charts in my analysis.

06/11/25 Trade Journal, and ES_F Stock Market analysis
EOD accountability report: +1200
Sleep: 7 hours
Overall health: Good
What was my initial plan?
Did not wanted to trade the market today unless we had multiple signals and confirmations because CPI data had already moved the market so much.
Daily Trade recap based on VX Algo System from (9:30am to 2pm)
— 10:00 AM Market Structure flipped bearish on VX Algo X3!
— 10:00 AM VXAlgo NQ X1 Buy Signal,
— 10:30 AM Market Structure flipped bullish on VX Algo X3!
— 11:08 AM VXAlgo ES X1 Sell Signal (double signal)
— 11:48 AM VXAlgo ES X3 Sell Signal
— 12:00 PM Market Structure flipped bearish on VX Algo X3!
— 12:30 PM VXAlgo ES X1 Buy signal (double signal)
— 1:35 PM Market Structure flipped bullish on VX Algo X3!
Next day plan--> Above 6000 = Bullish, Under 5990 = Bearish
Video Recaps -->https://tradingview.sweetlogin.com/u/WallSt007/#published-charts

ES Futures Play – Long Bias Despite MACD Caution (June 11, 2025)📈 ES Futures Play – Long Bias Despite MACD Caution (June 11, 2025)
Ticker: NYSE:ES | Bias: ✅ Moderately Bullish
Setup Time: Market Open | Confidence: 65%
🔍 AI Model Consensus Breakdown
📍 Price: ~6,027.25
📊 Trend: Above 20-, 50-, and 200-day MAs
📈 RSI: 64.25 – bullish but nearing overbought
📉 MACD: Bearish crossover → possible short-term pullback
📎 Bollinger Band: Price near upper band – may act as resistance
✅ Majority Long Bias (3 of 4 Models Agree)
Grok/xAI, Llama/Meta, Gemini/Google:
• Solid technical structure (higher highs/lows)
• High open interest and positive momentum
• Slight MACD concern, but bullish setup intact
• R:R ≈ 1.5:1 with upside target in 6,100 area
⚠️ Contrarian View – DeepSeek:
• Warns of overextension after a 30-day rally
• Suggests bearish MACD could drive pullback
• Recommends short targeting 5,930
📌 Recommended Trade Setup
🎯 Direction: LONG
📥 Entry: 6,027.25 (at market open)
🛑 Stop Loss: 5,980.00 (below short-term support)
🎯 Take Profit: 6,098.00 (R:R ≈ 1.5:1)
📊 Size: 1 contract
📈 Confidence: 65%
⚠️ Risk Watch
• 📉 MACD crossover = potential short-term weakness
• 🧊 Near upper Bollinger Band = possible resistance
• 💨 Volatility at open can cause whipsaw → manage risk strictly
• 🌐 Monitor news/macro events for any directional shift
📣 Are you taking the NYSE:ES long today or fading it like DeepSeek?
Drop your view ⬇️ | Follow for more AI-powered market setups.