Calling all Range Traders...Good Evening Traders,
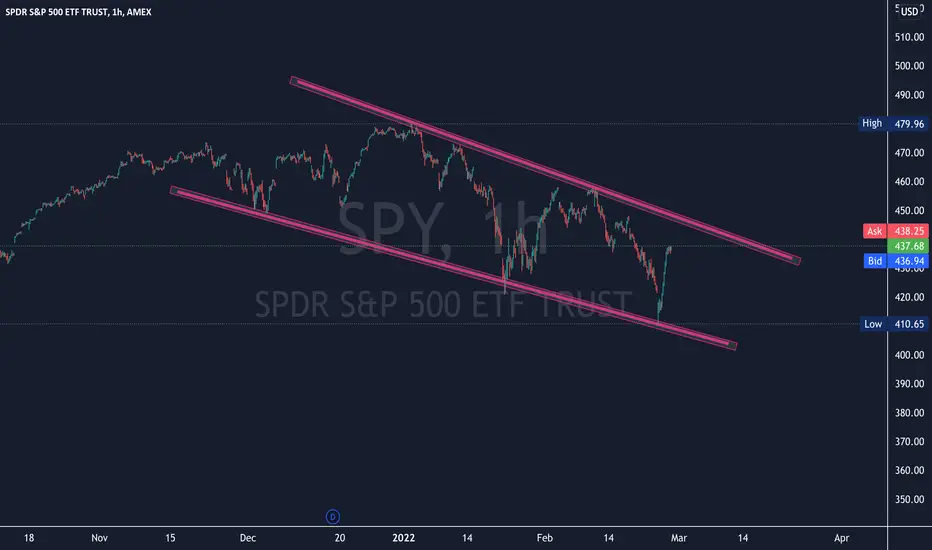
I hope you're doing well today. I wanted to give a quick update and clarification. As you can see in the chart above I had created 2 boxes. These are ranges I believe we will continue to stay in until the price discovery is more certain and market decides whether we're in a Bear or a Bull Market. Now, it's rarely talked about, because a lot of traders and investors see things in black and white, bull or bear, up or down; when really there's another direction and classification that I'd like to speak about. It has other names, but I call it a Ranging Market; this is when the market trades in ranges rather than trends; trends being uptrends (bull - HH & HL's) or downtrends (bear - LL & LH's) .
What is a Ranging Market?
Ranging Market's are opposite of Trending Markets (bull or bear), ones in which the price continues to move between higher prices and lower prices; the price action is range bound and moves mostly sideways. The range of prices can be small or large.
If it's small price movement, it's typically referred to as chop, consolidation, or more plainly, 'sideways action'. Most only consider it for a short period, such as hours or days, but in reality they can last weeks or months.
Now why the brief lesson on ranging vs trending markets? I believe we're in one, and they require a change to both analysis and trading techniques; we can skip the latter.Assuming I'm correct, which I could be wrong, knowing that we're in a Ranging Market (for likely a week or 2 more) should dampen the idea that a big breakout to the up or downside is right around the corner and any wave analysis may need some adjustments as well.
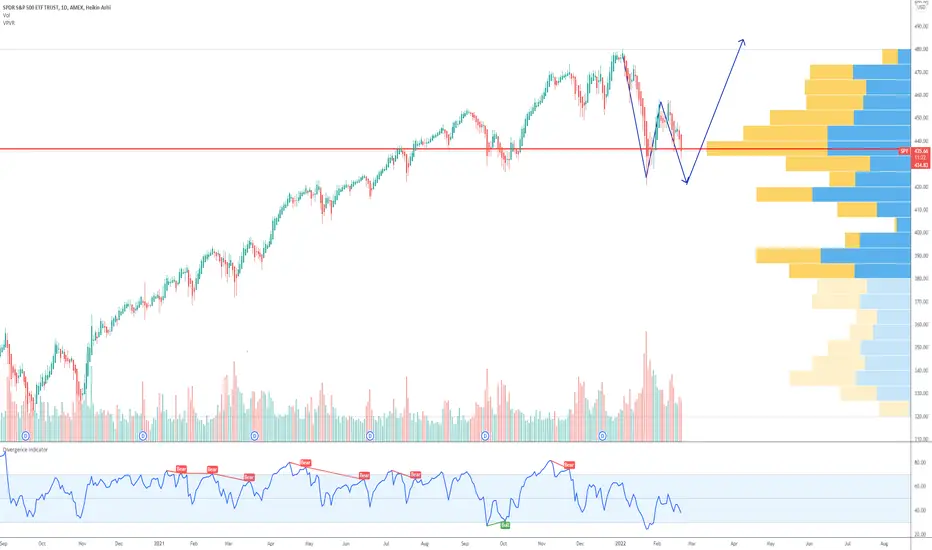
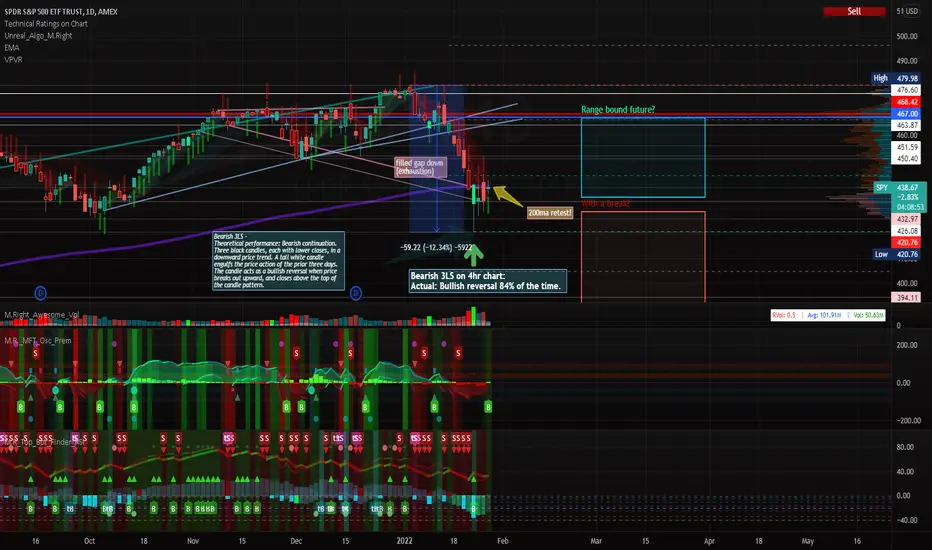
With all that said, the above chart, which is still just a continuation of my January chart , shows the levels I believe we're still ranging. Let the 200MA be your guide.
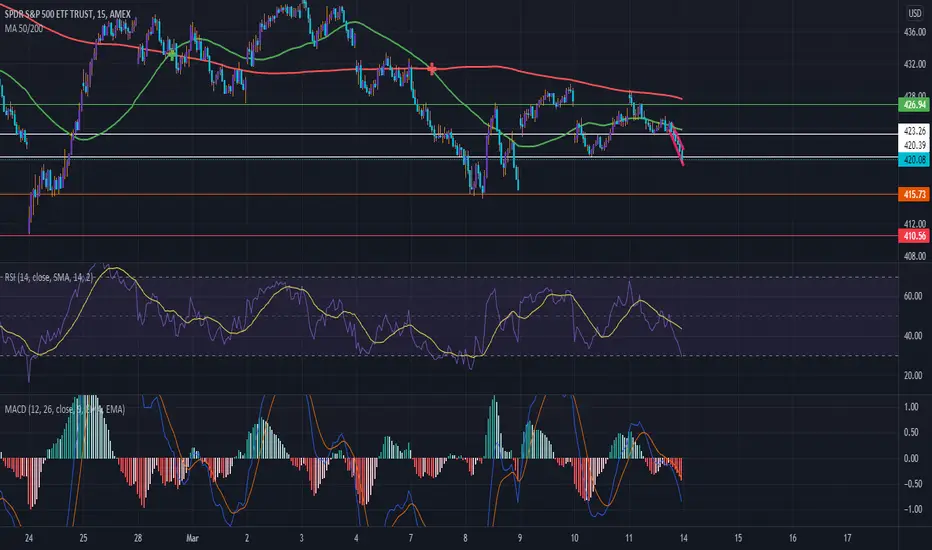
As the chart above shows , the H&S top (mid-candle right where the arrow down is on the left) that resulted in the 1st Lower Low (LL) shown, then moves up to hit a double top budding up against the 200MA resistance, then dropping to a recent Lowest Low around 410, bounced with high Relative Volume up... Went just above the trendline, pops back down quickly forming a double bottom... another weekly run up to the 200MA with a little more bullish confidence, moving just over the 200 to hit a fib/resistance for what looks like another bounce (although it is still hugging the 200MA, so we could see another try by the bulls, otherwise) toward the trendline around 439 or if that breaks 435-432.
Just looking at the PA one might think, well obviously, it's a bear market..20% pullback..Going to tank soon...While the Bulls see we just hit a recent lowest low, that must have been the bottom... Neither are what I see. I see a bullish runup to the double bottom almost identical to the breakdown that followed, then a bullish gap-up, bearish gap-down, and yet again another bullish runup... Are we seeing a pattern here?
Anyway, I hope you're doing well, whichever side of the trade you choose to be on.
Comment, like, share, support, follow, etc.
Cheers,
Mike
(UPRIGHT TRADING)
Referenced January chart:
Spy500
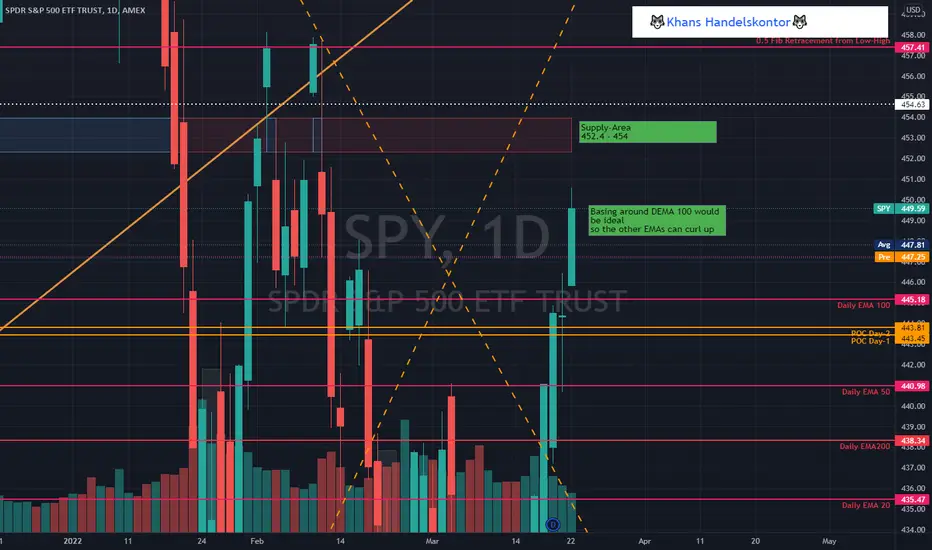
Khans SPY Outlook - 03/23/22We are heading into Day 6 of the reversal-squeeze. Futures are slightly red and i would assume that the price needs to consolidate a bit/re-test the DEMA 100 and form a new Base.
The next resistance above is a pretty strong one and i doubt that it will be broken today.
Possible little Bull-Trap in the morning, so watch out.
SPY the Bulls Are Back In Town...Hello Traders,
I hope you all are doing well. I just wanted to shoot a quick update for anyone a little shaken by the market or confused as to what's going on.
TLDR: Yes, there are still geopolitical concerns, but at the moment it's not important to the market, because we've already seen the response of the world and it has strengthened relations of NATO and basically blocked off Russia from World Trade and Financially. The Market's prefer hikes over inflation, and technical trading signals are still nearly perfect (as seen in above and below charts).
So we have our answer as to who's economy is really likely to crash.
Although the US would like to help more, there are limitations as to what we (the US) and other countries can do without sparking a Cold War or WW3, so the markets are pretty content that everyone is threading that needle.
Now, why did the market bounce off the fed announcements?
Many people without context assume that tapering and rate hikes are a bad thing for the markets; their thought process is that it makes valuations less attractive, due to more difficult borrowing for companies and consumers...
This idea isn't wrong, it's just that they're missing a few pieces of information in that logic.
First, the markets like policy that are good for the overall economy. Tapering and hikes will help fight inflation; monetary tightening is a signal that the Fed believes the economy is on firm footing. That is a good thing. The market easily prefers hikes over inflation worries.
Second, historically, while stocks tend to fall the month following rate hikes, they typically end the year up around 5%.
Lastly, there is progress on the geopolitical front. The World has condemned Russia's leader's actions; as we see a constructive movement in negotiations between Ukraine and Russia, signs from China that it will roll back its broad regulatory crackdown and play a little nicer with the rest of the world.
We do also predict gas prices to continue in a downward spiral and fall substantially in the coming months due to the panic buying subsiding, along with other geopolitical and psychological factors, which need not go into too much detail on.
(It's important to note for those unfamiliar, the US is the #1 producer of crude oil, with about 20% of global supply, Saudis at around 12%, Russia 11%, and Canada at 6%). As such, the US is not reliant on Russia for oil; unfortunately, some of our allies are, to some extent.
The Chart
As a technical trader, that was a lot of fundamental analysis. Sometimes it's good to have both, especially when catalysts are often the driver on big movers. As I mentioned in my previous posts, technical trading has been on-point. Almost to the penny.
On Weds, March 16th, SPY gapped up, perhaps on the positive geopolitical news mentioned. Now we're sitting on a trend reversal and (yet again) a retest of the 200MA. Honestly, I think we will hang around the 200MA even if we do break to the upside, at least for a month or two as I had predicted back in January (see below) .
Please see for references.
January.
If you appreciated this please: Like, support, share, follow.
Sincerely,
Mike
(UPRIGHT Trading)

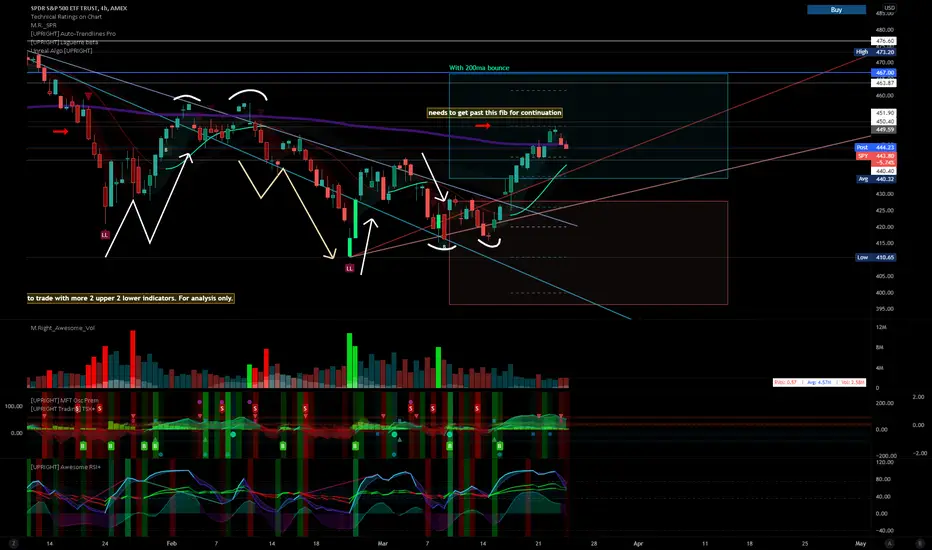
Spy game planpretty important level coming up imo. A lot of confluence for SPY to reject here, however, would ideally like to see a S/R flip for continuation.

Good to time to buyGood to time to buy. Look at almost 8 yerars back. Daily chart you can see we are capitalizing this Ukraine war.
I see we are in the same place as we where during covid and 2018 crash and 2016 crash. They are all similar and provide a pivot for the next bullish wave

THE STOCK MARKET IS BULLISH AGAIN... For now!Hey guys,
Utilising the S&P500, we can determine a very bullish response the Fed Funds Rate increase of 25 basis points. Jeremy Powell ensured the US to have a very strong economy and labour market which has placed trust in the overall stock market.
Have we seen the top of the market or will we be seeing another high to be made? I believe if we see another high, it will be 'fakeout' move to grab upper side liquidity, followed by a large push back to the downside. It seems absurd to me that the market can continue to make high highs with 7.9% inflation and interest rates of 0.25% coupled with insane oil/gas prices and supply chain disturbances. Not to mention the national debt and conflicts between Russia and the rest of the world.
I will do a post shortly on the business cycles and show why the Euphoric gains are now over.
Love, peace, Seb.
IBOVNow sucking up to my country. We have an index doing better than SPY! After we have broken through this lower channel, we come back to the surface. We are practically already activating a bullish pivot, we now need confirmation. Entering the fundamentalist part. Countries from abroad are coming to invest in our Brazil index as our index is doing better than others.
DISCLAIMER: Please note that my studies portray my personal opinion only and should be considered for educational purposes only. They should not be considered as a recommendation to buy or sell an asset!
I am not responsible for any damages to your capital. Your capital is at risk in the equity market.

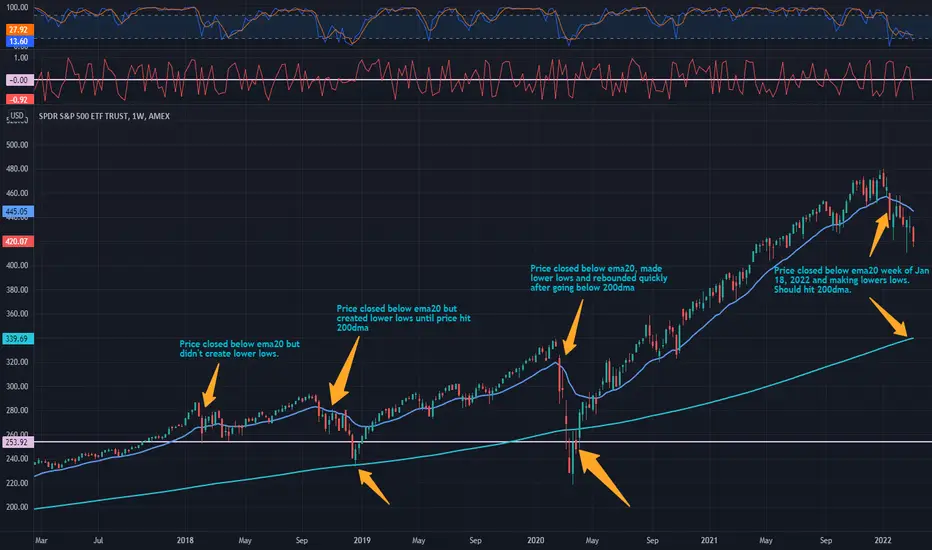
SPY Update! Looking attractive here. The trend is a good friend.SPY had been on this strong up trend since the COVID plummet in March 2020. On this chart you can see how it broke the regression trend to the downside.
How low... can you go...?
Notable things to watch:
- The gap that MAY! fill at $400 that can be seen on the daily & weekly time frames.
- FOMC this week; for shits n' giggles.
- Short term outlook - on the Daily time frame the 200 sma (in red) is sitting in the $400 area where the gap MAY! fill.
- Long term outlook - on the weekly time frame you can see that the 200sma (in red) is coming up on the 61.80% ($318.17). (chart attached below)
Just ride the trend & enjoy the ride but use proper risk management. Its all about the journey & the mulah is a by product of it all.
This is not financial advice. This is to be taken as my opinion only!

The FED will move the markets this week..probably.I'm favoring more downside as we are still in a downtrend. Although, given the events this week, we can also see a strong reversal above curved red downtrend line

SPY setup downtrends and reversal linesOrange lines are light potential for reversal and red line is the lowest it has been in month. White is what it is sitting round. Pink lines representing highs and lows of current downtrend.
SPY Prediction for 2022Please see chart. This is my views only based on previous trend that I notice.
SP 500 BUYING NOW TO 85% NET LONG ADDING AT 4298 We should be ending a wave C down now for an abc down I will move to a 90 % by adding a 5% on stop at4399
SPY in 200ma retest today as predicted.Hello Traders -
This will be an important day for technical traders. We need to see what happens with the price action around the 200ma before we can make a truly educated technical analysis, in my opinion. A lot of analysis, appear to be skipping ahead.. Unless they saw a pattern or are using more of a historical data technical analysis--are really just guessing. I saw a lot of these doom and gloom predictions make the front page and didn't see any of them mention a retest of the 200ma except one in the comments after... I guess sensationalism gets the most eyes, right?
Looking at you @TradingView "editor choice." ;)
I hope everyone is having a great day!
Cheers,
Mike
(UPRIGHT TRADING)
set up for spy for next weekwill be looking to take a put at 446.50 if we see selling power.
im not really liking calls on spy right now just because of everything going on
looking to hold some puts at 447.30 and 472.20. reason why is because those levels have some very aggressive selling.
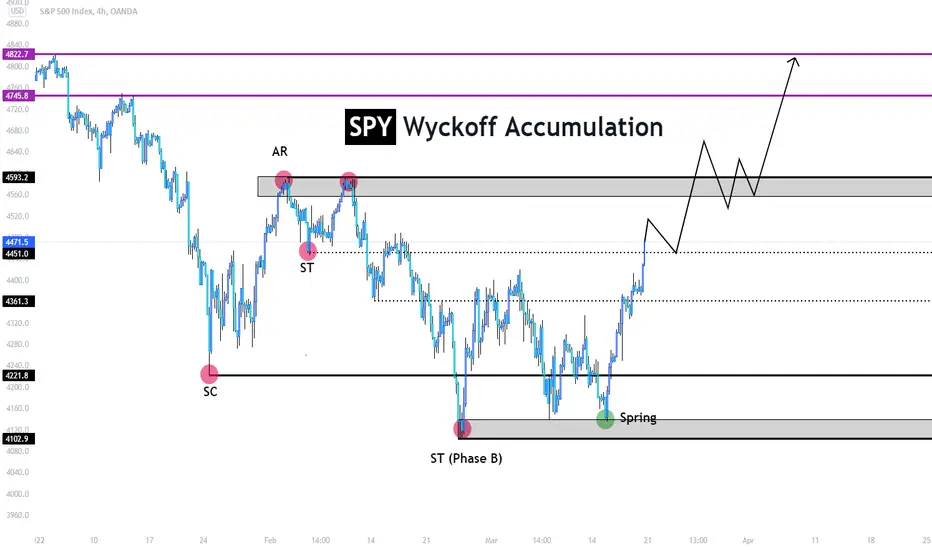
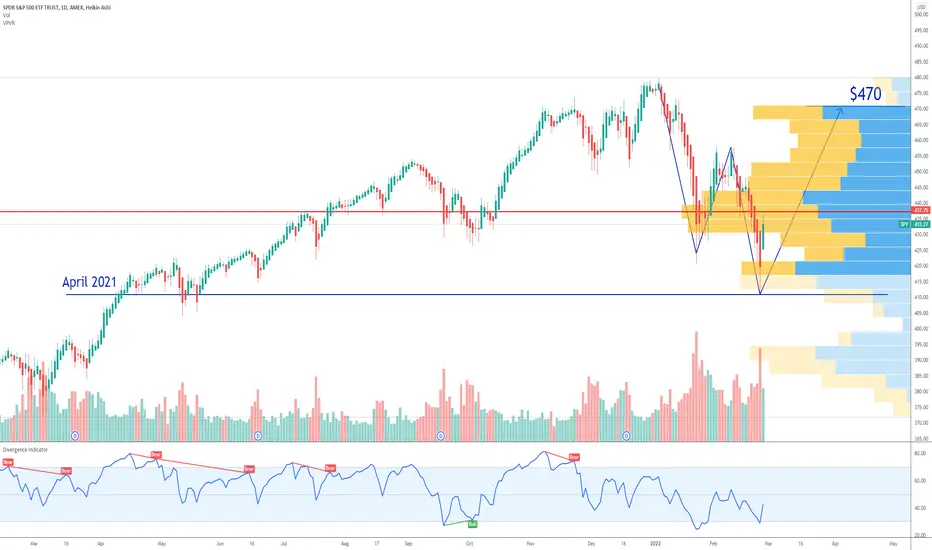
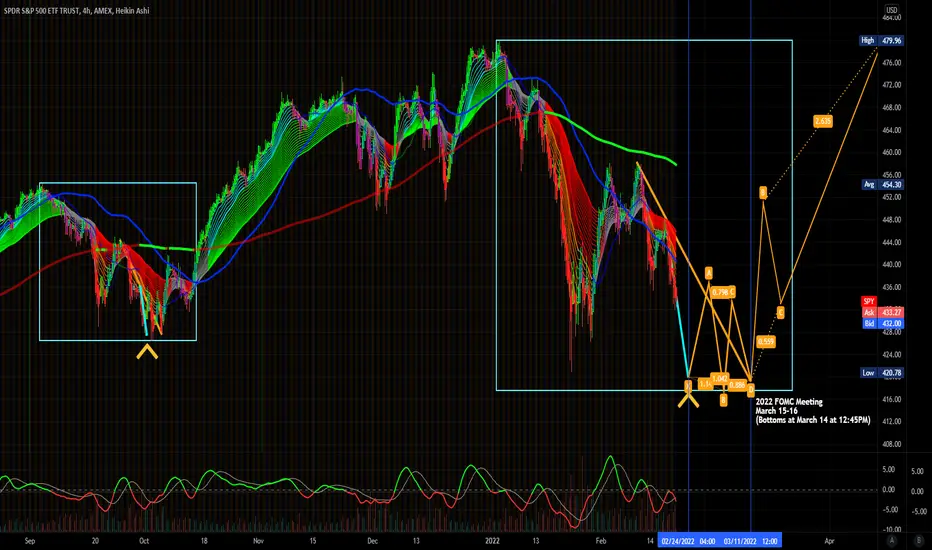
SPY S&P 500 ETF W-Shaped Recovery The SPY S&P 500 ETF wend down after the huge amount of puts that i noticed last week:
Now i am considering a W-Shaped Recovery to $470 by the end of Q2.
The Ukraine invasion was price in at $410 and the interest rates will be lower than expected due to the war.
Looking forward to read your opinion about it.
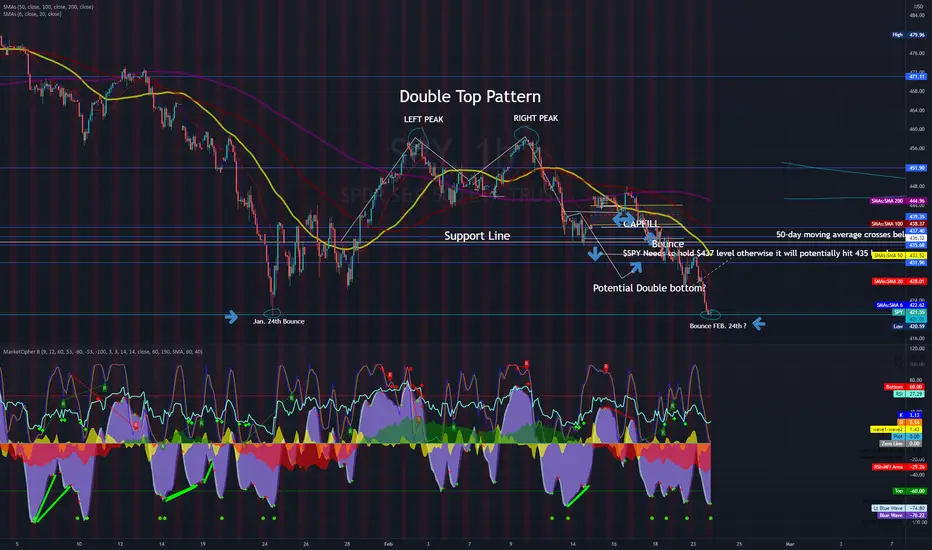
$SPY not looking good. Hello Traders,
I hope you all are doing well.
Notice the Head & Shoulder pattern on the chart. Good for Shorts though. If this H&S plays out we could see a significant drop, up to 6-10% from current levels. However, if there is some throwback on Monday, we could see a much weaker pullback. As I mention in the chart: If 431.25-431.75 support holds,we could see some throwback. Thus, weakening the pattern.
Either way, it doesn't look good. Everyone's saying "Putin's got Puts" on the market, well maybe so; I mentioned in my previous post that geopolitics hadn't yet been factored in, well now they are starting to. I would like to note, although geopolitics can affect the markets... In what we are seeing currently, the largest disruption would only be from 2 things: uncertainty (markets don't like) and potential disruption in crude oil distribution to our allies, which could be a good thing if you're bullish on gas/oil prices (bad for inflation).
Now is a great time to remember to practice good risk management. It'd be reckless to go all in on either side of the bull/bear coin, so as always.. know your levels, entry, exit, and stick to your strategy and rules .
Cheers,
Mike
(UPRIGHT TRADING)

$SPY Support areawe didn't hold our support above 421$, now we should see a bit of buying pressure above the 404$, cause if we didn't we will see the correction support above the 360$.

$SPY 1Hour Potential Bounce Play 2/24/21Spy currently hit it's previous low from January around $420.59 and has surpassed that in extended hours on 2/23.
What are your thoughts?
Thanks,
Kelly
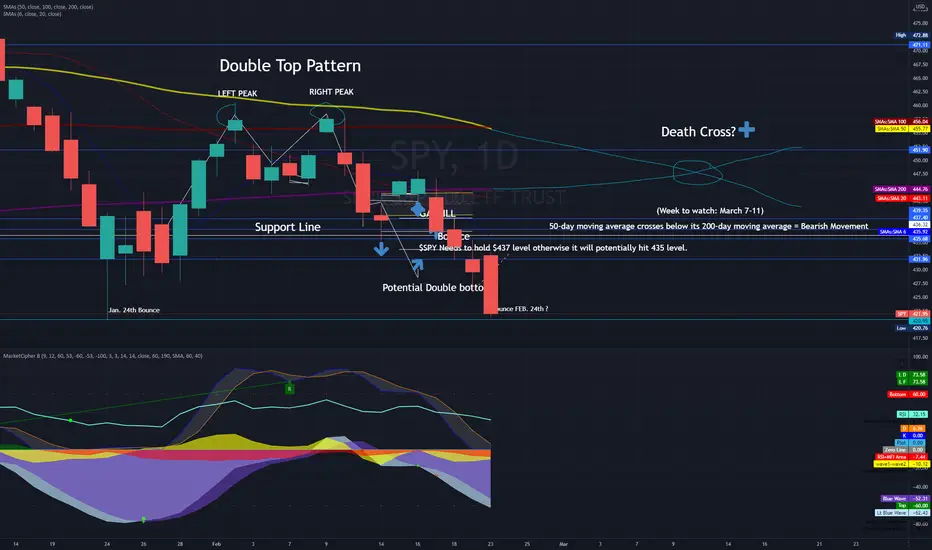
$SPY on Daily Potential Death Cross for March$SPY Daily Potential Death Cross for March
What is a Death Cross?
It's a technical pattern in which the 50-day moving average on a stock or index crosses BELOW its 200-day moving average.
The indicator is considered a bearish sign.
What are your thoughts?
Thanks,
Kelly
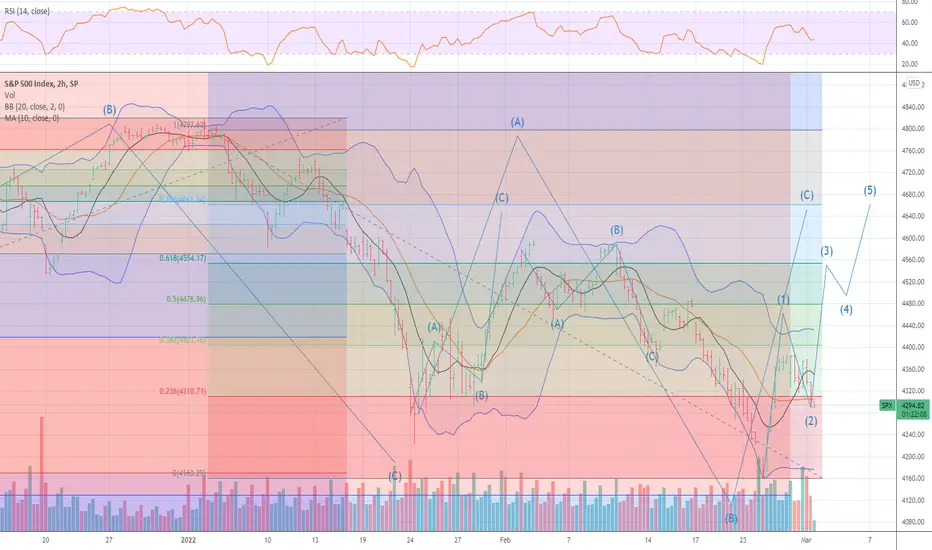
SPY: Bottom at 400-405Hello traders, here is my analysis for the SPY. Looks like a WXY correction to me. There is a gap that needs to be filled at SPY 400, and I believe that we will do this. Also, at that point W=Y, so it will be a beautiful symmetrical correction. Good luck traders.

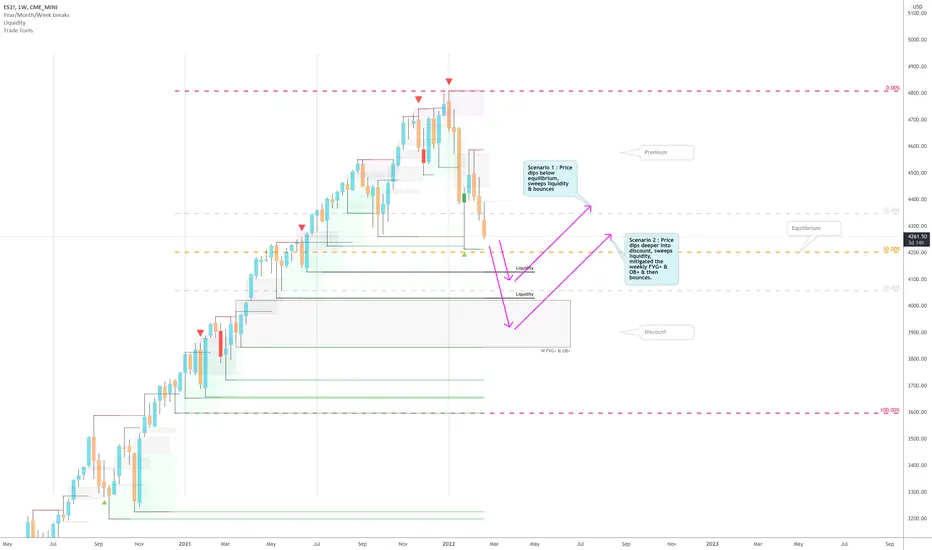
ES1! / Emini / SPY500 : Bullish move anticipationES1! / Emini / SPY500 is getting closer to 50% of the range since 2021 began - and can find buyers below 50% of the range (forced or willing) as shown on the chart.
Don't blindly trade the weekly chart, look for LTF confirmations.
Note : we are not predicting price, it can still drop like a rock. However we anticipate how it could play out.
GLGT
$SPYThe investment seeks to provide investment results that, before expenses, correspond generally to the price and yield performance of the S&P 500 Index. The Trust seeks to achieve its investment objective by holding a portfolio of the common stocks that are included in the index (the "Portfolio"), with the weight of each stock in the Portfolio substantially corresponding to the weight of such stock in the index.
SPY bearish options todayI was monitoring the SPDR S&P 500 ETF Trust (ETF) options market and the puts are dominating the options today.
2/3 puts, 1/3 calls and some important dark pool prints sells.
My expectation is for a retracement at the $422 area, followed by a W shaped recovery.
Looking forward to read your opinion about it.