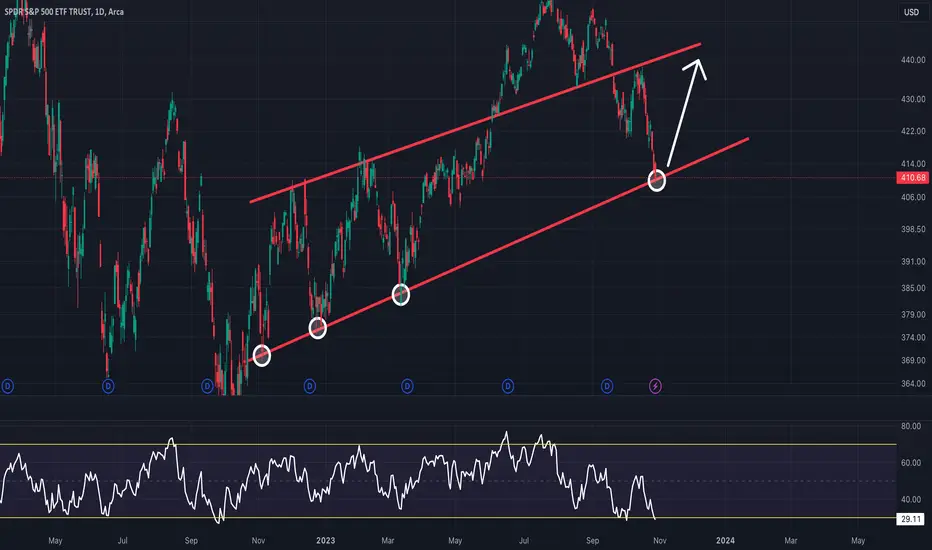
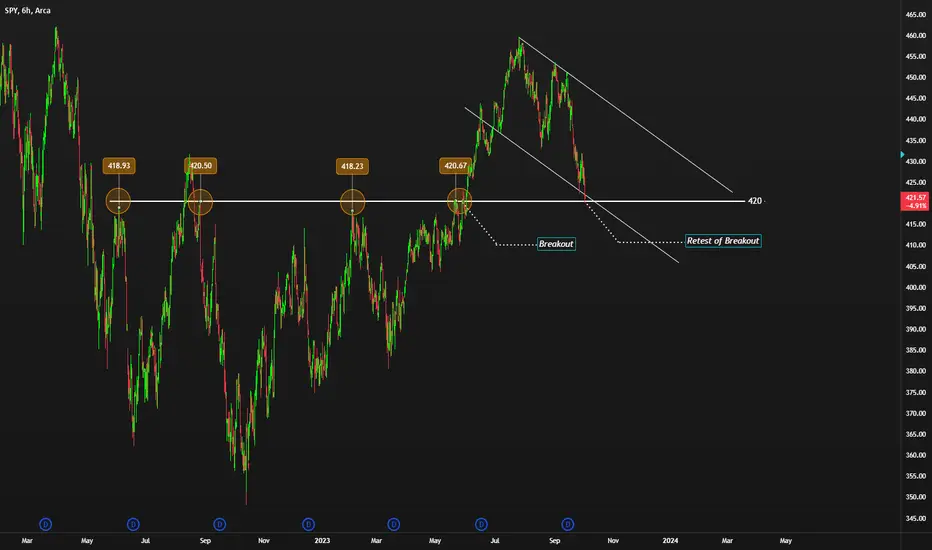
S&P500: Key Support Level for SPY Bulls to DefendThe S&P 500 been gradually breaking downwards since peaking in July. AMEX:SPY has reached the bottom of this red parallel channel last week. This is a key support level that has been providing strong support, and I think SPY bulls need to defend this price level this week. The RSI is oversold so the conditions are good for a rebound here.
Spyanalysis
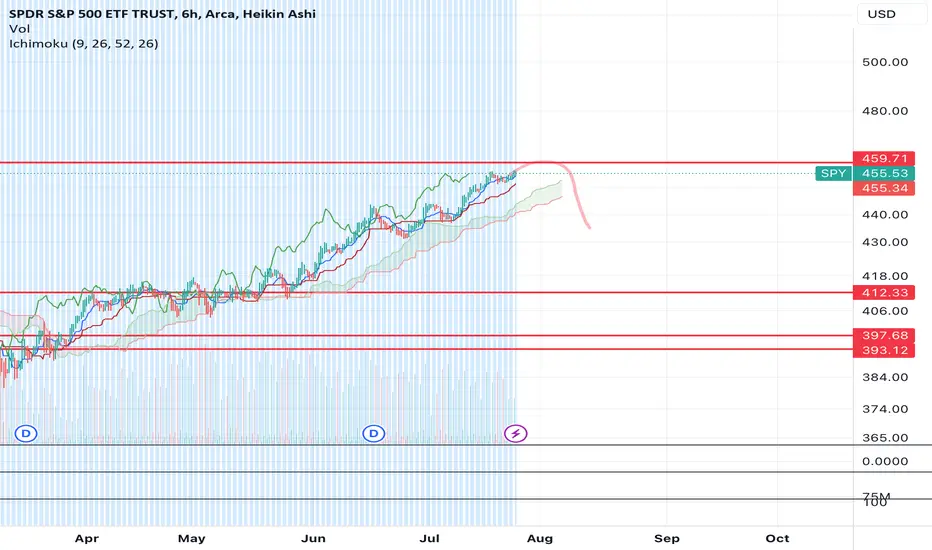
$SPY Market top playing outAs I've mentioned in my previous analysis, I believe we're at a market top (Despite Tom Lee calling for new highs).
There's nothing positive for markets looking forward, therefore I think markets will finally price in all of the raise hikes and the poor economy.
I think we may see one more high, however, if we do, I believe it'll result in a rug pull. I think the FOMC meeting tomorrow will largely be bullish for markets, but then after that, Thursday, Friday or into early next week, we'll see the market reverse.
I'm looking for the move to hit the targets laid out on the charts.
$412, $397 or $393 as the bottom. With hindsight, I think the move will mark the top of the market and we'll continue much lower. Bear market continuation targets shared here.
Let's see if it plays out.
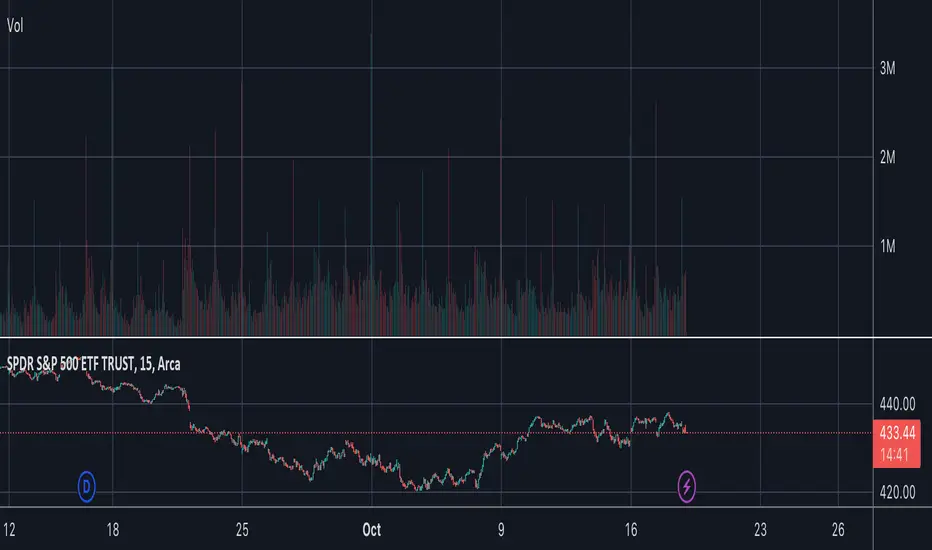
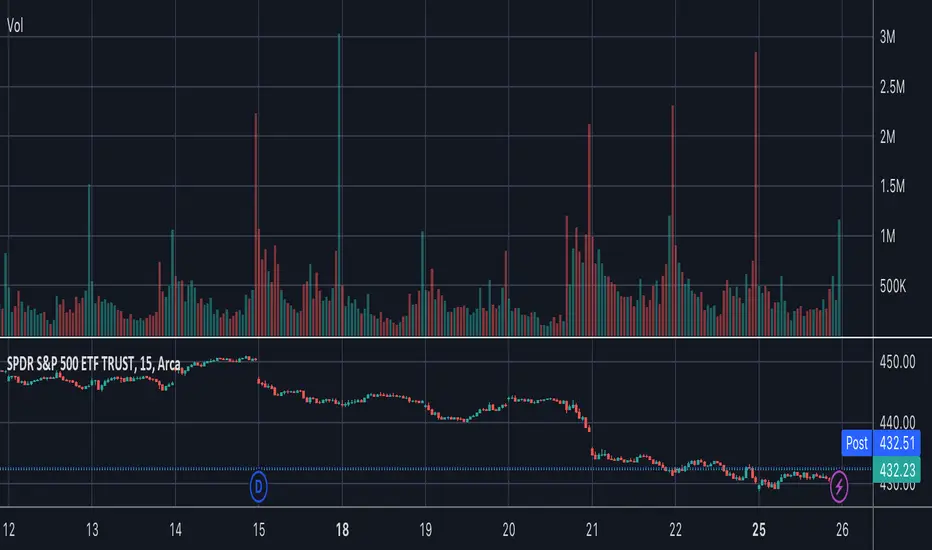
SPY Short Prediction - 10/15/2023Unqualified prediction: SPY looks to be rolling over on the 1hr with multiple historical zones of support and resistance overlapping in a concentrated range (specified in-chart.) This in a TA sense would indicate a potential fight between buyers and sellers for control of price action, but macroeconomic fundamentals and geopolitical concerns, as well as ER volatility make for turbulent waters with this amateur analyst biased towards the downside.

SPY WEEKLY OCT 20th,2023SPY weekly is here. Be careful when you are trading SPY. All levels have been discussed here.
NOTE: DO NOT TRADE OPTIONS IN SPY

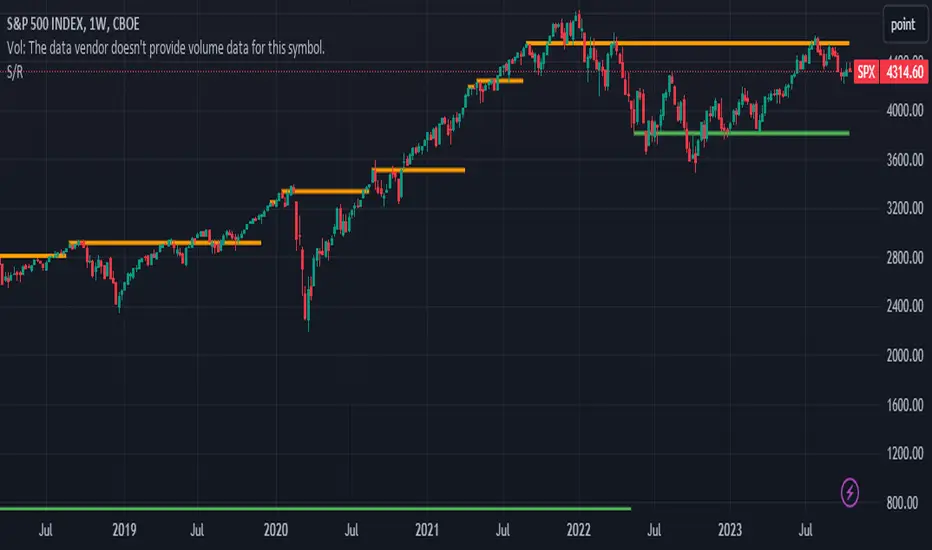
Observing SPX Range-Bound Move: Be Caution and Stay AlertToday, I wanted to draw your attention to the recent performance of the SPX, which has been exhibiting a range-bound behavior over the past year. As we navigate through these uncertain times, it is crucial to stay vigilant and monitor the market closely.
Over the last year, the SPX has shown a tendency to trade within a specific range, with price movements oscillating between key support and resistance levels. This range-bound behavior implies that the market has been lacking a clear direction, making it essential for investors to exercise caution and closely observe the price action.
Currently, the SPX is hovering around the $4569 level, which serves as a significant resistance point. Should the price break through this level decisively, it could potentially signal a bullish trend. In such a scenario, it may be prudent to consider long positions, taking advantage of the potential upside momentum.
On the other hand, it is equally important to be prepared for a potential downside move. If the price falls below the long-term support level of $3800, it could indicate a bearish trend. In this case, it may be wise to consider short-term positions or even adopt a more cautious approach in the long term.
Given the current market dynamics, I encourage you to closely watch the SPX's price movements, paying particular attention to the key support and resistance levels mentioned. By doing so, you will be better equipped to make informed investment decisions and navigate the market with prudence.
As always, it is essential to remember that investing involves inherent risks, and past performance is not indicative of future results. Therefore, I recommend consulting with a financial advisor or conducting thorough research before making any investment decisions.
Should you have any questions or require further assistance, please feel free to comment below.
Bearish on SPX500, GBPUSD, & AUDUSD. Bullish on Gold! Let's go!Just sharing some analysis on the above markets.
If you find the video helpful and/or informative, leave a LIKE and consider subscribing.
May profits be upon you.

Expired SPY Weekly outlook. 3rd WK OCT 2023Expired SPY Weekly outlook. 3rd WK OCT 2023
> NEUTRAL 📊 CORRECT
Closed Price: 431.50
Target Price: 432.06 | Strike Price: 436.82 OCT16
Upper Range: 448.80
Lower Range: 415.31
SPY ANALYSIS 16th Oct,2023This is my live analysis for SPY. Don't rush or push yourself into trades as market will hurt you mentally.
NOTE:WAIT FOR THE LEVELS DISCUSSED

Expired SPY Weekly outlook. 2nd WK OCT 2023Expired SPY Weekly outlook. 2nd WK OCT 2023
> NEUTRAL 📊 CORRECT
Closed Price: 429.54
Target Price: 428.42 | Strike Price: 427.36 OCT9
Upper Range: 445.03
Lower Range: 411.81

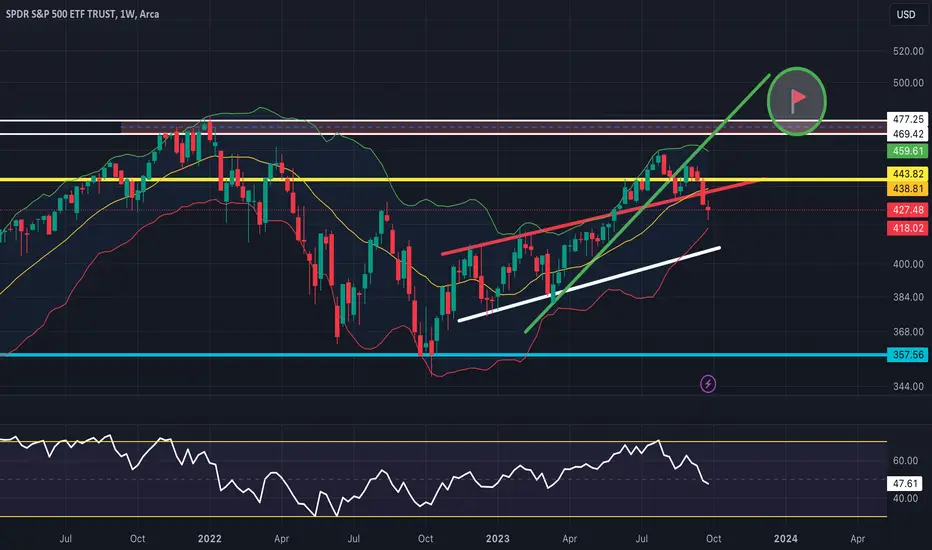
SPX is in an uptrend now Let's be honest. SPX is in an uptrend now. The price has been creating higher lows and higher highs. The downsloping trendline which was acting as a strong resistance in March 2023 was retested and confirmed as a support. Since then the price has been in the uptrend and in our opinion we are at the early stage of the new BULL MARKET.
Yes, you hear it right: BULL market.
The price remains above the ichimoku cloud and it looks like it's breaking the horizontal resistance.
It will take time for a price to recover but let's be clear here: we don't expect new lows on SPX. There will be more corrections and pullbacks but overall 4800 -5000 is a target which in our opinion we may see in 2024/2025
What do you think?
Do you agree? Leave your comment :)

SPY Weekly outlook. 2nd WK OCT 2023SPY Weekly outlook. 2nd WK OCT 2023
> NEUTRAL 📊
Closed Price: 429.54
Target Price: 428.42
Upper Range: 445.03
Lower Range: 411.81
Expired SPY Weekly outlook. 1st WK OCT 2023Expired SPY Weekly outlook. 1st WK OCT 2023
> NEUTRAL 📊 CORRECT
Closed Price: 427.48
Target Price: 426.13 | Strike Price: 420.48 OCT3
Upper Range: 442.65
Lower Range: 409.61

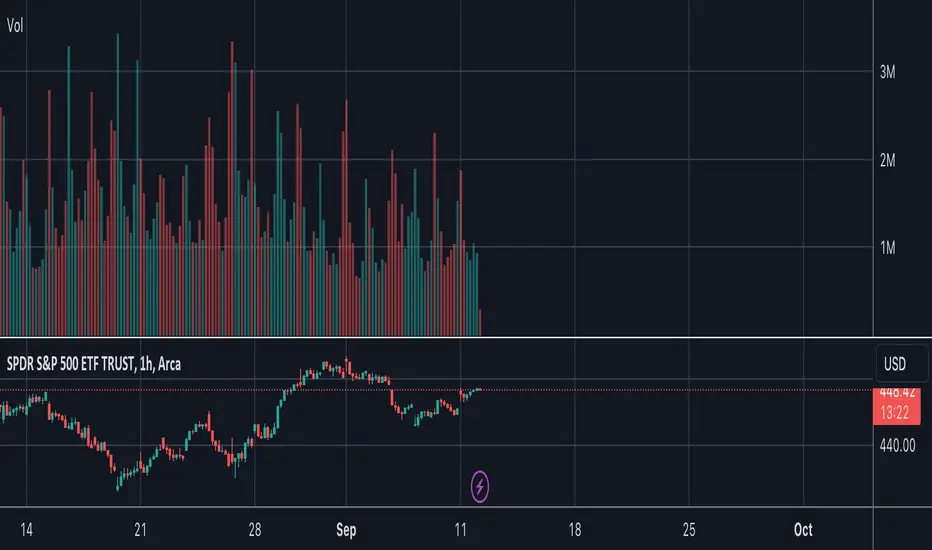
$SPY Quarter 3 (Q3) AnalysisThe S&P 500 had a correction in August and September that led to a correction back down into the EMA ribbon. I believe that SPY is trending for a strong Q4 and will make progress towards a new all-time high above $477 over the next few months (marked by the green circle). For now I would like to see a bullish bounce off the EMA ribbon.
Expired SPY Weekly outlook. 4th WK SEP 2023Expired SPY Weekly outlook. 4th WK SEP 2023
> BULLISH 📈 CORRECT
Closed Price: 430.42
Target Price: 432.19 | Strike Price: 432.27 SEP25
Upper Range: 448.94
Lower Range: 415.44
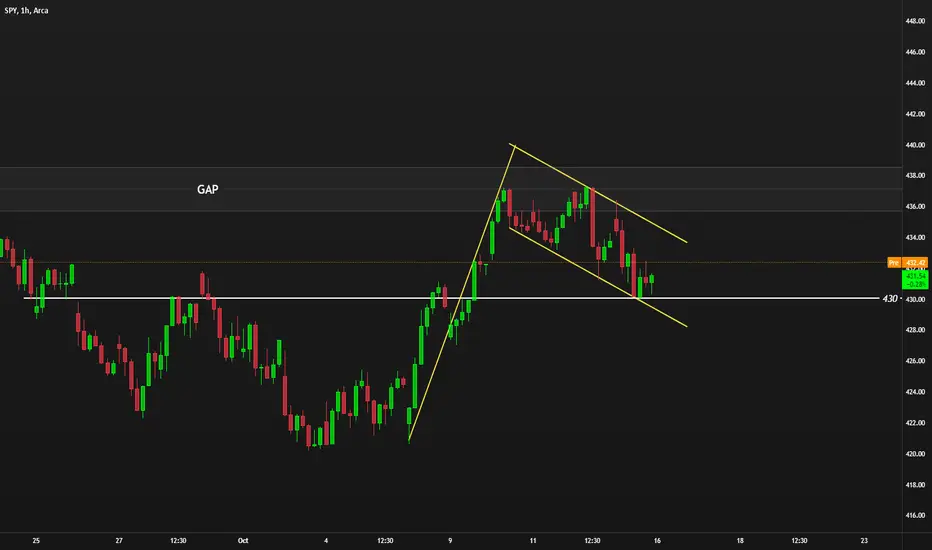
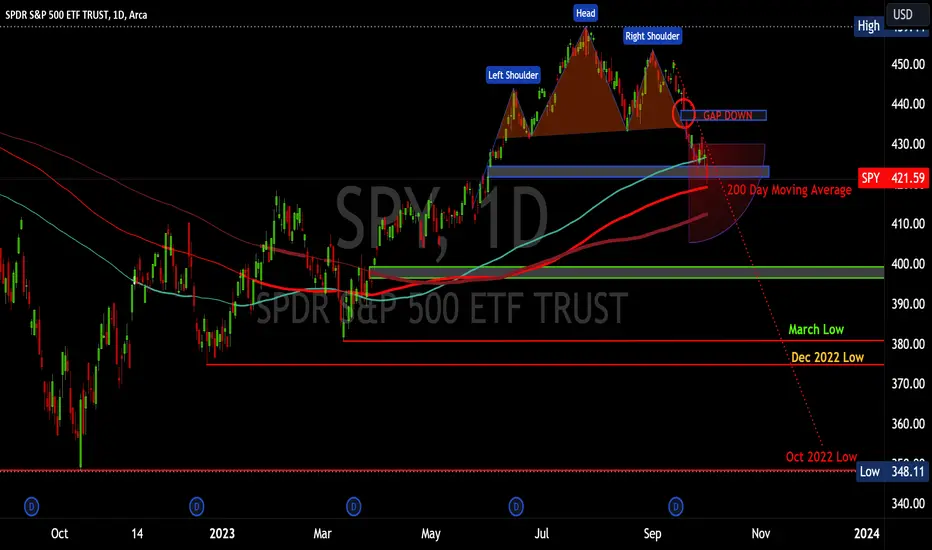
Short with Gap Fill as TargetAMEX:SPY is creating an intermediate top , with a lower high formed below the previous lower high ( which was at the bear gap below All Time High. We may see a deeper correction and a short trade with target as gap fill below is looking good

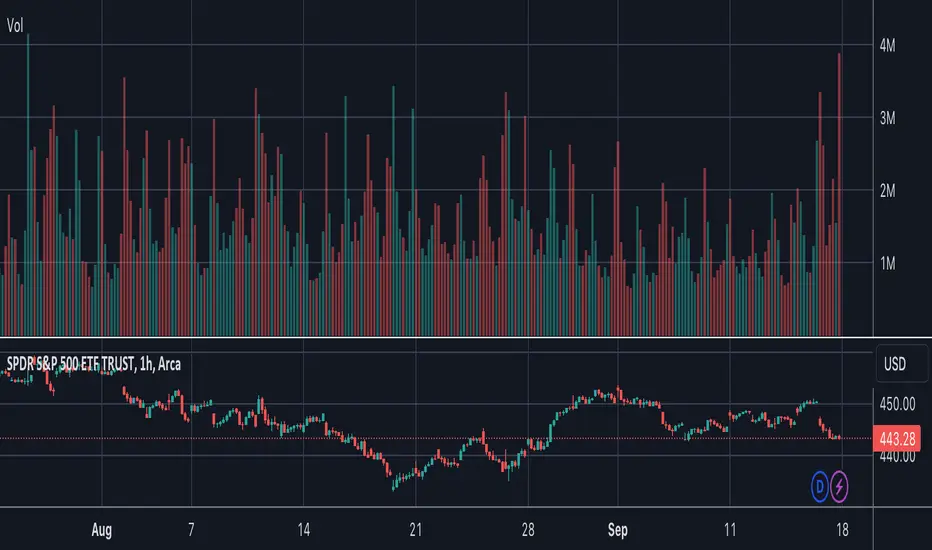
SPY WEEKLY ANALYSIS|18TH SEP,2023SPY looks bullish to me and I have discussed the levels and how the levels needs to be traded.
NOTE:DO NOT SHORT THE MARKET.

Active SPY Weekly outlook. 3rd WK SEP 2023Active SPY Weekly outlook. 3rd WK SEP 2023
> BULLISH 📈
Closed Price: 443.37
Target Price: 446.59
Upper Range: 463.85
Lower Range: 429.32
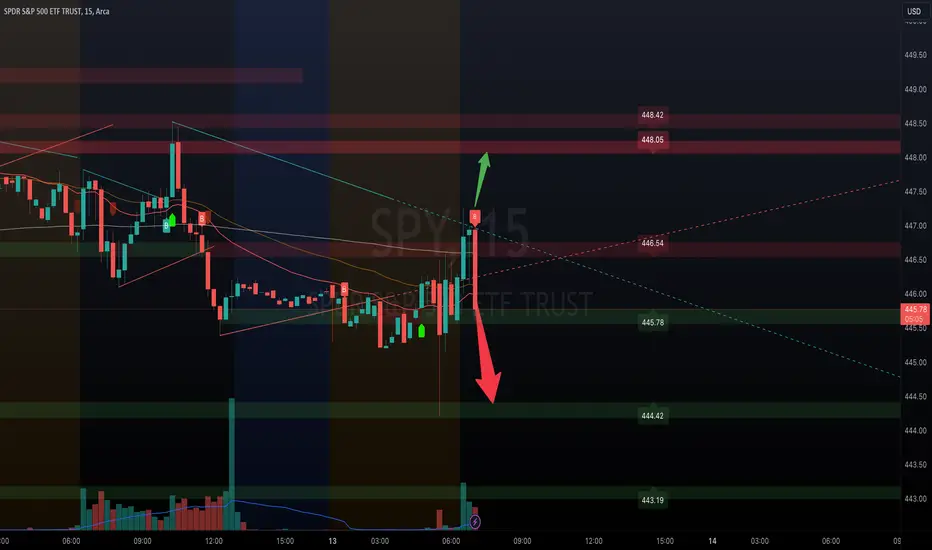
SPY Call/PutThinking if AMEX:SPY breaks out above, taking Call options to target at key level. If SPY breaks down below the triangle, taking Put options to target at key level below. Pay-tience!

SPY Put first target hitAMEX:SPY simple Put trade. hit 1st target immediately below the triangle. continue to watch
Expired SPY Weekly outlook. 2nd WK SEP 2023Expired SPY Weekly outlook. 2nd WK SEP 2023
> BULLISH 📈 CORRECT
Closed Price: 445.52
Target Price: 446.45 | Strike Price: 448.54 SEP11
Upper Range: 463.71
Lower Range: 429.19