Expired SPY Weekly outlook. 1st WK MAY 2024Expired SPY Weekly outlook. 1st WK MAY 2024
> NEUTRAL 📊 CORRECT
Closed Price: 508.26
Target Price: 509.87 | Strike Price: 510 APR29 24'
Upper Range: 518.30
Lower Range: 501.43
Spyidea

Active SPY Weekly outlook. 2nd WK APR 2024 (FREE SAMPLE) Active SPY Weekly outlook. 2nd WK APR 2024 (FREE SAMPLE)
> BULLISH 📈
Closed Price: 518.43
Target Price: 523.07
Upper Range: 542.41
Lower Range: 503.73

Expired SPY Weekly outlook. 4th WK MAR 2024Expired SPY Weekly outlook. 4th WK MAR 2024
> BULLISH 📈 CORRECT
Closed Price: 521.21
Target Price: 523 | Strike Price: 245.58 MAR28 24'
Upper Range: 543
Lower Range: 504

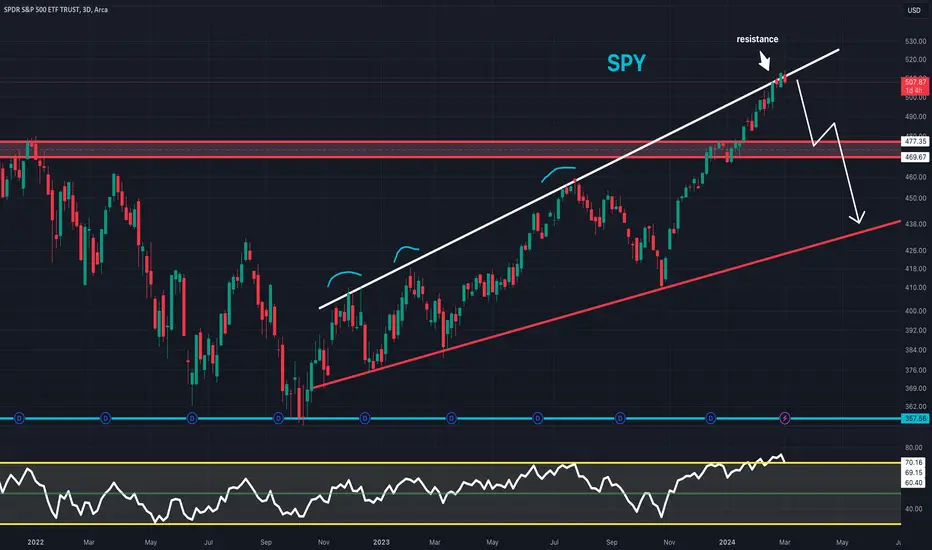
S&P 500 at Strong Resistance, Short Trade Setup for SPXSSPY is trading at a key resistance level, the white resistance line that has consistently provided strong rejections for the S&P 500. I am taking a short trade setup by going long on SPXS.
Price targets:
- Red support zone between $469 and $477
- Red trendline around $433 (price increases over time since the trendline is sloped upwards).
Expired SPY Weekly outlook. 2nd WK FEB 2024Expired SPY Weekly outlook. 2nd WK FEB 2024
> BULLISH 📈 CORRECT
Closed Price: 501.2
Target Price: 503 | Strike Price: 503.30 FEB16 24'
Upper Range: 510
Lower Range: 497

Expired SPY Weekly outlook. 1st WK FEB 2024Expired SPY Weekly outlook. 1st WK FEB 2024
> BULLISH 📈 CORRECT
Closed Price: 494
Target Price: 496 | Strike Price: 499.57 FEB9 24'
Upper Range: 511
Lower Range: 481
Expired SPY Weekly outlook. 5th WK JAN 2024Expired SPY Weekly outlook. 5th WK JAN 2024
> BULLISH 📈 CORRECT
Closed Price: 487
Target Price: 490 | Strike Price: 491.47 JAN30 24'
Upper Range: 496
Lower Range: 483

Expired SPY Weekly outlook. 4th WK JAN 2024 (JAN 22~26)Expired SPY Weekly outlook. 4th WK JAN 2024 (JAN 22~26)
> BULLISH 📈 CORRECT
Closed Price: 482.43
Target Price: 484.53
Upper Range: 491.20
Lower Range: 477.87

Active SPY Weekly outlook. 5th WK JAN 2024 (FREE SAMPLE)Active SPY Weekly outlook. (FREE SAMPLE)
5th WK JAN 2024
> BULLISH 📈
Closed Price: 487
Target Price: 490
Upper Range: 496
Lower Range: 483

Expired SPY Weekly outlook. 4th WK DEC 2023Expired SPY Weekly outlook. 4th WK DEC 2023
> BULLISH 📈 CORRECT
Closed Price: 473.65
Target Price: 475.95 | Strike Price: 476.14 DEC27
Upper Range: 579
Lower Range: 371

Expired SPY Weekly outlook. 3rd WK DEC 2023Expired SPY Weekly outlook. 3rd WK DEC 2023
> BULLISH 📈 CORRECT
Closed Price: 469.33
Target Price: 472 | Strike Price: 472.65 DEC18
Upper Range: 477
Lower Range: 467
Expired SPY Weekly outlook. 2nd WK DEC 2023Expired SPY Weekly outlook. 2nd WK DEC 2023
> NEUTRAL 📊 CORRECT
Closed Price: 460.20
Target Price: 461 | Strike Price: 473.36 DEC14
Upper Range: 532
Lower Range: 389

Active SPY Weekly outlook. 3rd WK DEC 2023Active SPY Weekly outlook. 3rd WK DEC 2023 (SAMPLE)
> BULLISH 📈
Closed Price: 469.33
Target Price: 472.44
Upper Range: 477.52
Lower Range: 467.36

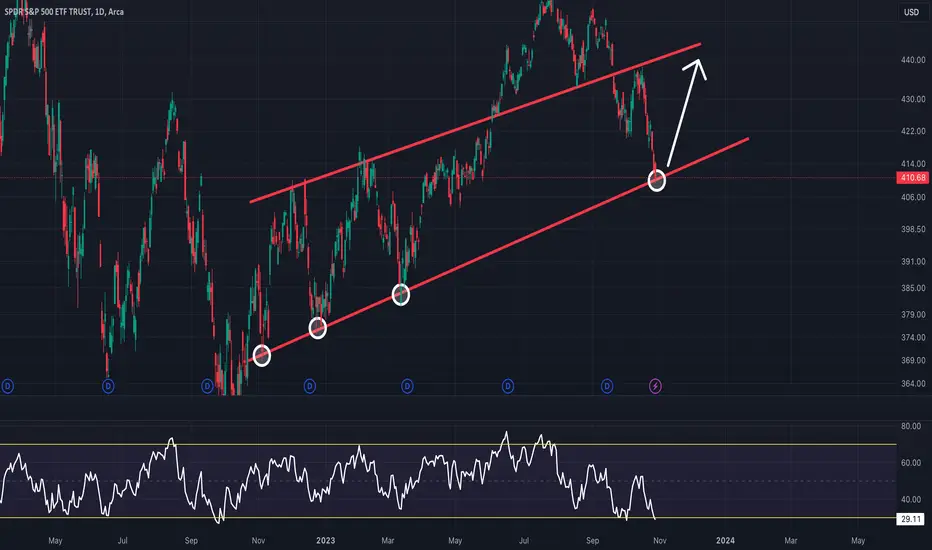
S&P500: Key Support Level for SPY Bulls to DefendThe S&P 500 been gradually breaking downwards since peaking in July. AMEX:SPY has reached the bottom of this red parallel channel last week. This is a key support level that has been providing strong support, and I think SPY bulls need to defend this price level this week. The RSI is oversold so the conditions are good for a rebound here.
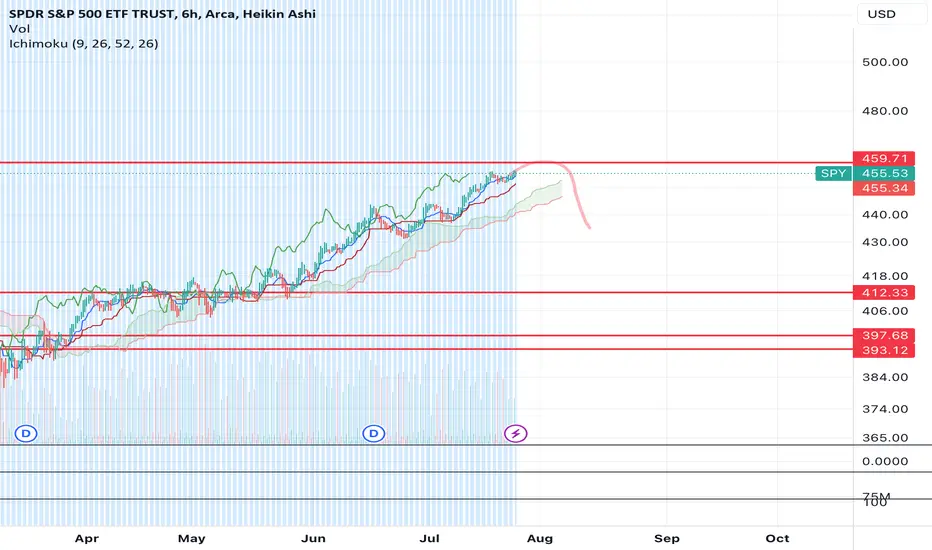
$SPY Market top playing outAs I've mentioned in my previous analysis, I believe we're at a market top (Despite Tom Lee calling for new highs).
There's nothing positive for markets looking forward, therefore I think markets will finally price in all of the raise hikes and the poor economy.
I think we may see one more high, however, if we do, I believe it'll result in a rug pull. I think the FOMC meeting tomorrow will largely be bullish for markets, but then after that, Thursday, Friday or into early next week, we'll see the market reverse.
I'm looking for the move to hit the targets laid out on the charts.
$412, $397 or $393 as the bottom. With hindsight, I think the move will mark the top of the market and we'll continue much lower. Bear market continuation targets shared here.
Let's see if it plays out.
Expired SPY Weekly outlook. 3rd WK OCT 2023Expired SPY Weekly outlook. 3rd WK OCT 2023
> NEUTRAL 📊 CORRECT
Closed Price: 431.50
Target Price: 432.06 | Strike Price: 436.82 OCT16
Upper Range: 448.80
Lower Range: 415.31
SPY - Wyckoff DistributionSPY potentially could be in the beginning stages of a Wyckoff Distribution phase. Predicting price to gravitate between golden Fib zone for the UT & eventual UTAD before price falls in line with trend line ~320-330

Current daily channel on spy hope it helps you understand the current volatility rnage of the asset.
keep in mind that he can change profiles quite easily (a good indication of this is a sudden increase in "speed" and volume).
I personally like the idea of looking for entries with confirmation at the bottom (aimed at the top of the channel), but also gives an idea of the area where more attention is needed

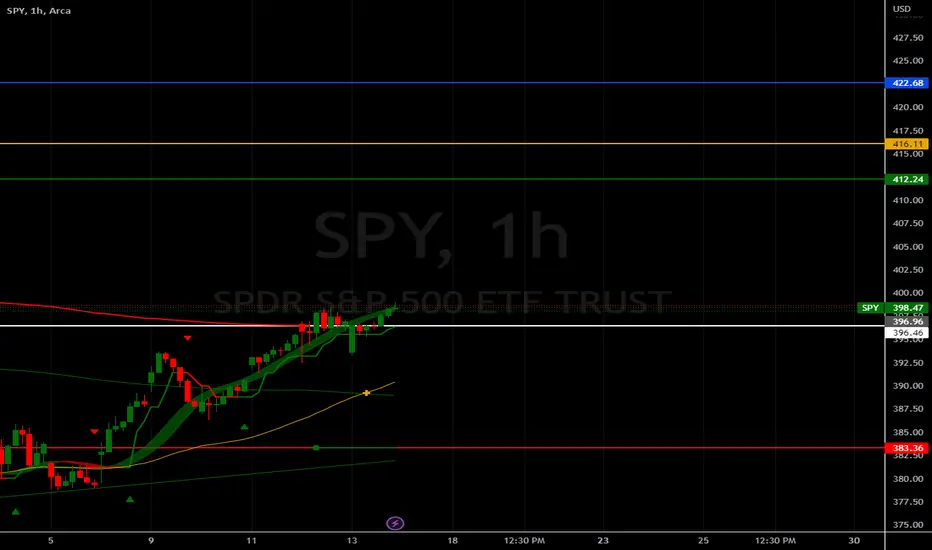
SPY - Price Targets & Stop Loss📈 What’s up investors! 📉
Welcome back to another one of
💡“Mike’s Ideas”.💡
I post as I find signals… these signals are based on the personal rules I have built and follow in order to make up what I call the “SST Strategy”. Follow for more ideas in the future!!
I have 4 levels marked and colour coded on the Chart.
These levels are:
⚪ White = Entry Point
🔴 Red = Stop Loss
🟢 Green = 1.2:1 Risk Reward Ratio
🟡 Yellow = 1.5:1 Risk Reward Ratio
🔵 Blue = 2:1 Risk Reward Ratio
👀 So what are we looking at today…!!!
🚨( SPY ) SPDR S&P 500 ETF Trust🚨
The Trust seeks to achieve its investment objective by holding a portfolio of the common stocks that are included in the index (the "Portfolio"), with the weight of each stock in the Portfolio substantially corresponding to the weight of such stock in the index.
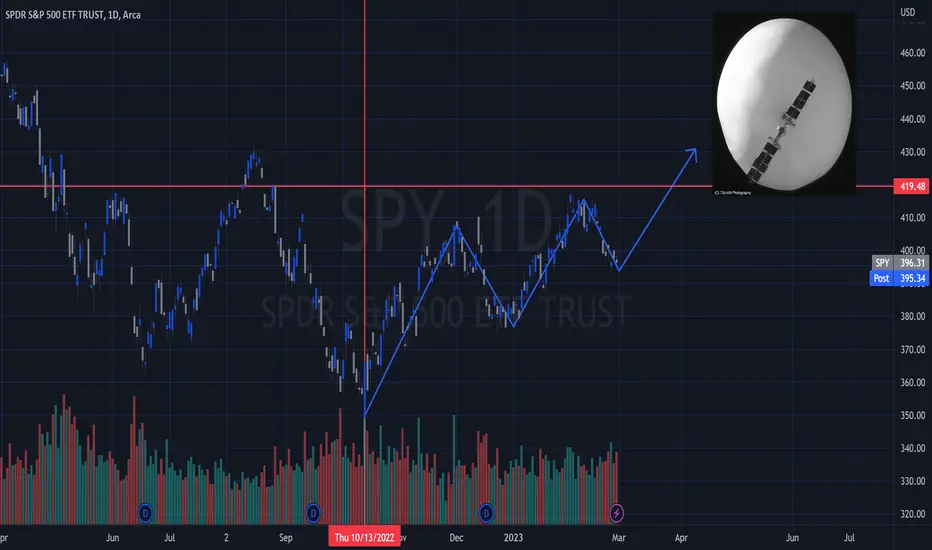
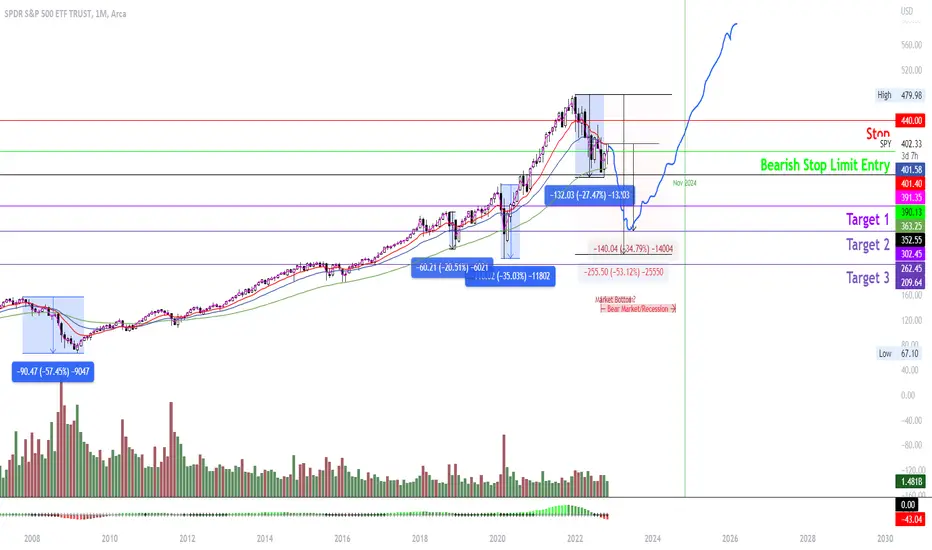
What a recession could look like.This is what I see if/when the recession kicks in completely and we reach that 2008 recession bear market. 50% pullback still leaves about 30% or so left from here to the downside.
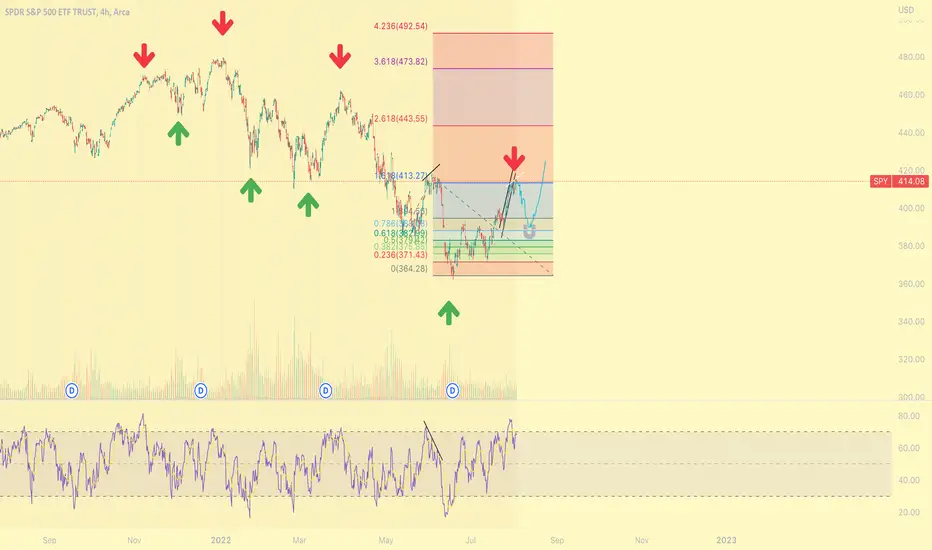
SPY Trade Idea (BULL TRAP)Here Im using the trend based fib ext.
SPY is currently at the June highs and the 1.618 Fib level.
Seeing deviation with price making a higher high and the RSI making a lower low on the 4HR. (Bearish)
In June fear turned to euphoria in an instant. Talks about the bear market being over started, just like it is now.
Spy fell out of an ascending channel after initially getting rejected from the 1.618. (Bearish)
In June it took about a week to finally sell off and bull market talks faded in the. background. I think we see a similar story in the next few days and weeks.
If you're bullish i would be patient, things dont go up in a straight line. The RSI on the daily is at levels not seen since March. VIX is on a strong support which has generally marked local tops. If you notice there has been 3 times we previously touched this support and every time has been a sell signal. Same goes with the top resistance, every time we touched resistance it marked a local bottom in the stock market as you can see with the red and green arrows.
In the coming weeks I am bearish on SPY and anticipate a retest of 390, a break below that and the next level is 380.
However coming off one of the best months in a long time the medium to long term future looks bright for the stock market.
We look to be forming a possible inverse head and shoulders pattern on higher time frames and if this is the case we should see strong support in the 380-390 range. (This is where Im swinging long if the market gives us these levels). I would also like to see VIX at resistance to further confirm the trade.
I wouldn't be surprised if VIX broke out of this wedge, and give us the 40+ everyone has been calling for which if in fact we do reach those levels on VIX i think that would be the max opportunity to go long on the market. We will cross that bridge when/if we get there.
Ill soon be posting ideas on individual stocks, let me know if you guys agree or disagree!
SPY Short TargetI believe we will drop to atleast $400 in the coming weeks/months. Be careful as volatility is at an extreme. Goodluck everyone!
