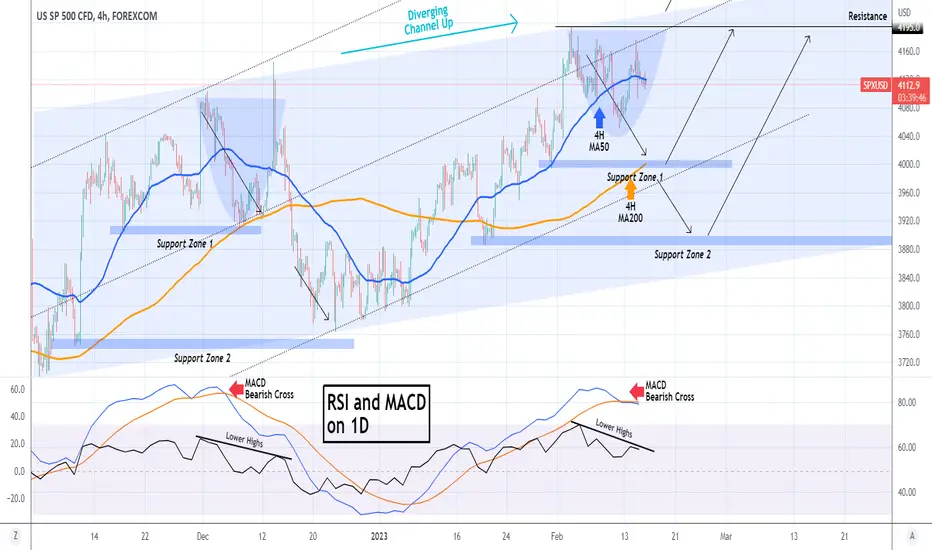
S&P500 Short-term correction about to start.It appears that the Diverging Channel Up we spoke of last week eventually prevailed and the S&P500 index (SPX) is printing a Higher High formation similar to December 01 - 13. The pattern that carries this top formation is a Cup, which is now trading around the 4H MA50 (blue trend-line).
Based on the December fractal, the first target is the 4H MA200 (orange trend-line). A break below Support Zone 1 will extend our selling towards Support Zone 2, where near the bottom of the Channel Up we will place our long-term buys.
See how the 1D MACD Bearish Cross as well as the Lower Highs formation on the 1D RSI, also match those of the December peak.
-------------------------------------------------------------------------------
** Please LIKE 👍, FOLLOW ✅, SHARE 🙌 and COMMENT ✍ if you enjoy this idea! Also share your ideas and charts in the comments section below! **
-------------------------------------------------------------------------------
💸💸💸💸💸💸
👇 👇 👇 👇 👇 👇
Standardandpoors5000
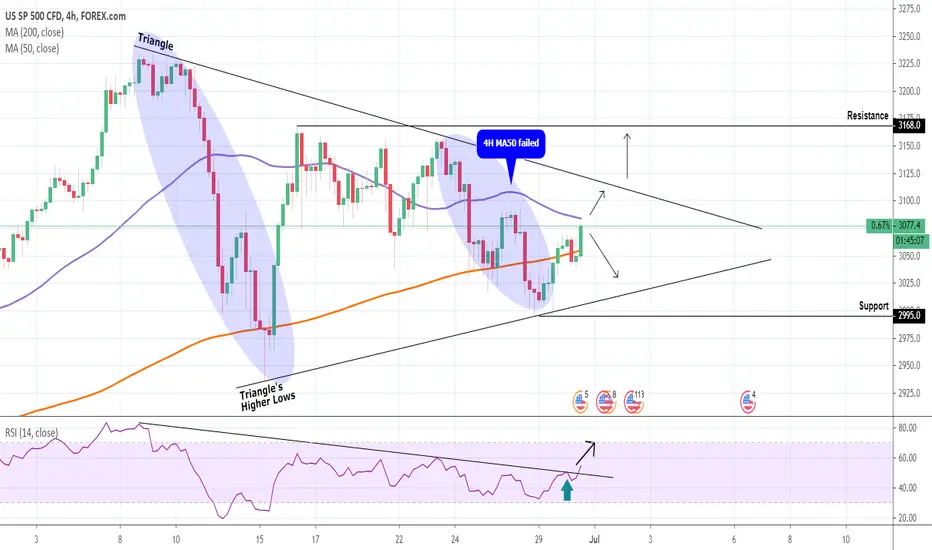
S&P500: Neutral within the Triangle.S&P500 is trading within a Triangle on the 4H chart (RSI = 53.651, MACD = -10.000, ADX = 26.709). The price is now testing the 4H MA50 and if broken we expect it to reach the Lower High trend-line. The RSI broke above a 20 day bearish trend-line so we are expecting a break above the Triangle towards the 3,168 Resistance.
** If you like our free content follow our profile to get more daily ideas. **
Comments and likes are greatly appreciated.