Trading as a Probabilistic ProcessTrading as a Probabilistic Process
As mentioned in the previous post , involvement in the market occurs for a wide range of reasons, which creates structural disorder. As a result, trading must be approached with the understanding that outcomes are variable. While a setup may reach a predefined target, it may also result in partial continuation, overextension, no follow-through, or immediate reversal. We trade based on known variables and informed expectations, but the outcome may still fall outside them.
Therefore each individual trade should be viewed as a random outcome. A valid setup could lose; an invalid one could win. It is possible to follow every rule and still take a loss. It is equally possible to break all rules and still see profits. These inconsistencies can cluster into streaks, several wins or losses in a row, without indicating anything about the applied system.
To navigate this, traders should think in terms of sample size. A single trade provides limited insight, relevant information only emerges over a sequence of outcomes. Probabilistic trading means acting on repeatable conditions that show positive expectancy over time, while accepting that the result of any individual trade is unknowable.
Expected Value
Expected value is a formula to measure the long-term performance of a trading system. It represents the average outcome per trade over time, factoring in both wins and losses:
Expected Value = (Win Rate × Average Win) – (Loss Rate × Average Loss)
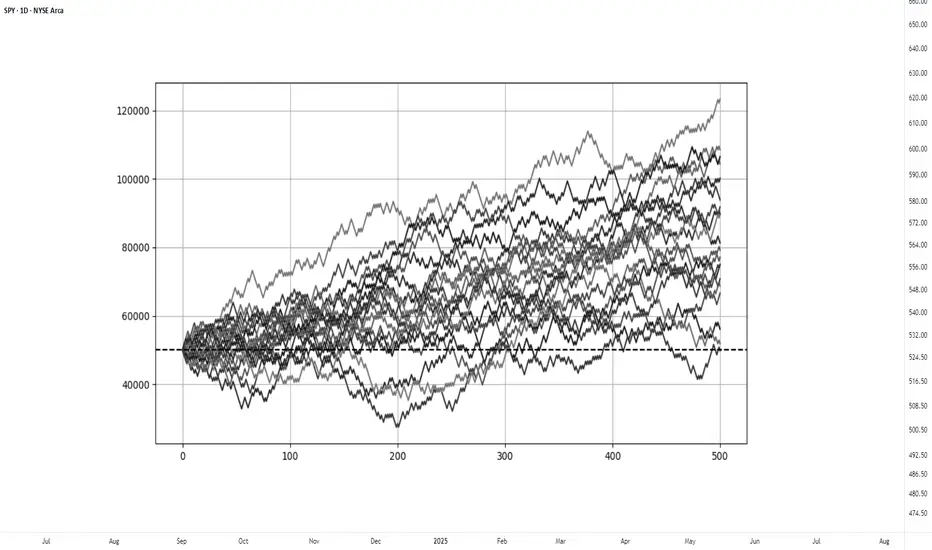
This principle can be demonstrated through simulation. A basic system with a 50% win rate and a 1.1 to 1 reward-to-risk ratio was tested over 500 trades across 20 independent runs. Each run began with a $50,000 account and applied a fixed risk of $1000 per trade. The setup, rules, and parameters remained identical throughout; the only difference was the random sequence in which wins and losses occurred.
While most runs clustered around a profitable outcome consistent with the positive expected value, several outliers demonstrated the impact of sequencing. When 250 trades had been done, one account was up more than 60% while another was down nearly 40%. In one run, the account more than doubled by the end of the 500 trades. In another, it failed to generate any meaningful profit across the entire sequence. These differences occurred not because of flaws in the system, but because of randomness in the order of outcomes.
These are known as Monte Carlo simulations, a method used to estimate possible outcomes of a system by repeatedly running it through randomized sequences. The technique is applied in many fields to model uncertainty and variation. In trading, it can be used to observe how a strategy performs across different sequences of wins and losses, helping to understand the range of outcomes that may result from probability.
Trading System Variations
Two different strategies can produce the same expected value, even if they operate on different terms. This is not a theoretical point, but a practical one that influences what kind of outcomes can be expected.
For example, System A operates with a high win rate and a lower reward-to-risk ratio. It wins 70% of the time with a 0.5 R, while System B takes the opposite approach and wins 30% of the time with a 2.5 R. If the applied risk is $1,000, the following results appear:
System A = (0.70 × 500) − (0.30 × 1,000) = 350 − 300 = $50
System B = (0.30 × 2,500) − (0.70 × 1,000) = 750 − 700 = $50
Both systems average a profit of $50 per trade, yet they are very different to trade and experience. Both are valid approaches if applied consistently. What matters is not the math alone, but whether the method can be executed consistently across the full range of outcomes.
Let’s look a bit closer into the simulations and practical implications.
The simulation above shows the higher winrate, lower reward system with an initial $100,000 balance, which made 50 independent runs of 1000 trades each. It produced an average final balance of $134,225. In terms of variance, the lowest final balance reached $99,500 while the best performer $164,000. Drawdowns remained modest, with an average of 7.67%, and only 5% of the runs ended below the initial $100,000 balance. This approach delivers more frequent rewards and a smoother equity curve, but requires strict control in terms of loss size.
The simulation above shows the lower winrate, higher reward system with an initial $100,000 balance, which made 50 independent runs of 1000 trades each. It produced an average final balance of $132,175. The variance was wider, where some run ended near $86,500 and another moved past $175,000. The drawdowns were deeper and more volatile, with an average of 21%, with the worst at 45%. This approach encounters more frequent losses but has infrequent winners that provide the performance required. This approach requires patience and mental resilience to handle frequent losses.
Practical Implications and Risk
While these simulations are static and simplified compared to real-world trading, the principle remains applicable. These results reinforce the idea that trading outcomes must be viewed probabilistically. A reasonable system can produce a wide range of results in the short term. Without sufficient sample size and risk control, even a valid approach may fail to perform. The purpose is not to predict the outcome of one trade, but to manage risk in a way that allows the account to endure variance and let statistical edge develop over time.
This randomness cannot be eliminated, but the impact can be controlled from position sizing. In case the size is too large, even a profitable system can be wiped out during an unfavorable sequence. This consideration is critical to survive long enough for the edge to express itself.
This is also the reason to remain detached from individual trades. When a trade is invalidated or risk has been exceeded, it should be treated as complete. Each outcome is part of a larger sample. Performance can only be evaluated through cumulative data, not individual trades.
Statistical
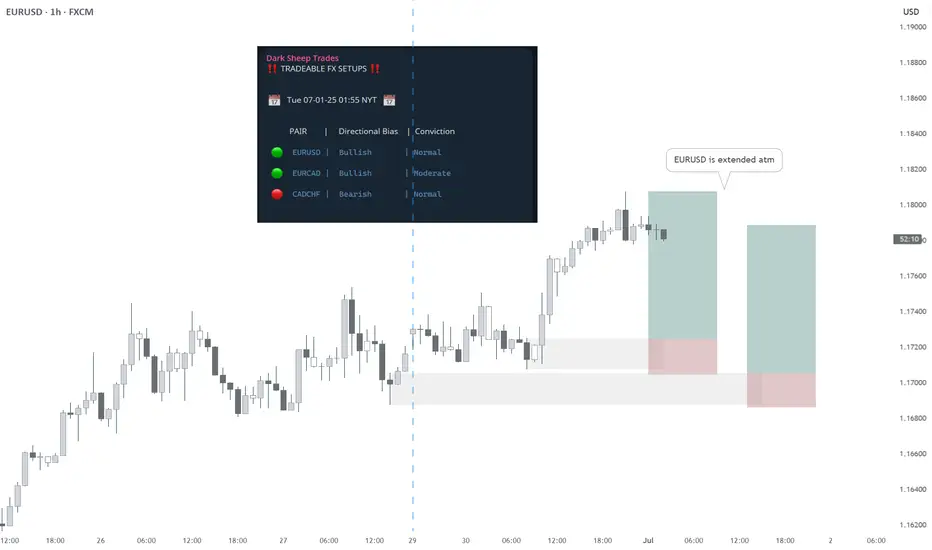
EURUSD BUY - Statistically-backed FX shortlistEURUSD BUY
Daily Outlook: Statistically-backed FX shortlist
@darksheeptrades
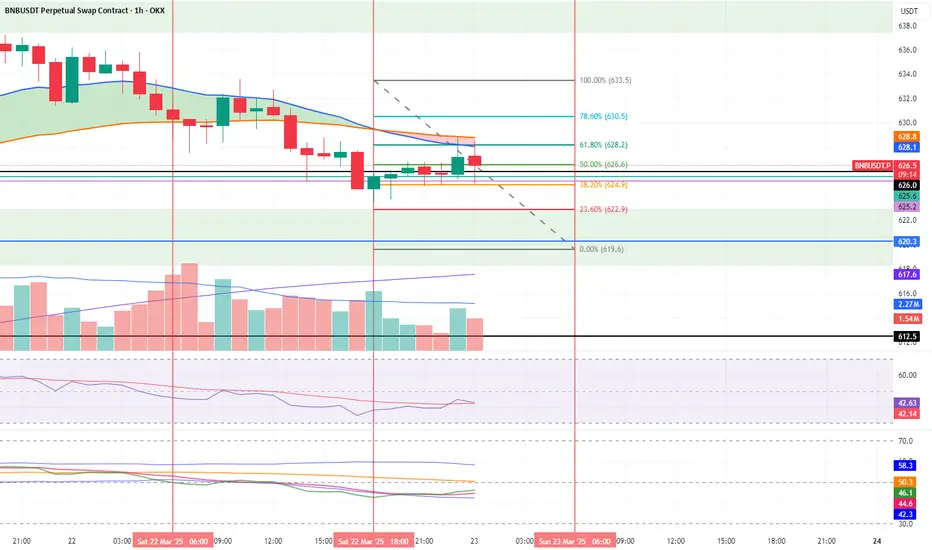
Witness Magic of Statistical Models in Harmony with FibonacciWitness the Magic of Statistical Models in Harmony with Fibonacci Levels! ✨📊
Have you ever seen mathematical beauty unfold right before your eyes? 🤯 Imagine the elegance of statistical models perfectly aligning with Fibonacci levels—it's like witnessing a symphony of numbers! 🎶🔢
Fibonacci sequences, deeply rooted in nature and financial markets alike, provide a powerful tool for identifying key price levels. 📈✨ When combined with robust statistical models, they unveil patterns that might otherwise go unnoticed. The result? A mesmerizing blend of logic and intuition, precision and prediction! 🎯🔮
📌 Why is this combination so fascinating?
✅ Predictive Power – Fibonacci levels help anticipate market trends, while statistical models refine those predictions. 📊🔍
✅ Data-Driven Accuracy – Instead of relying on guesswork, this approach leverages solid mathematical foundations. 🏗️📈
✅ Aesthetic Elegance – There's something truly captivating about seeing numbers align so seamlessly! ✨🔢
So, what do you think of this remarkable harmony? 🤩 Let’s discuss in the comments! ⬇️
How key markets have performed either side of a US electionI wanted to see how major markets have performed in the days before, during and after US elections. So I coded up a new spreadsheet. Here are the results...
Please note:
- Price data supplied by Refinitiv
- Most markets go back 8 elections
- US futures and VIX are the exception, which go back 6 elections
MS

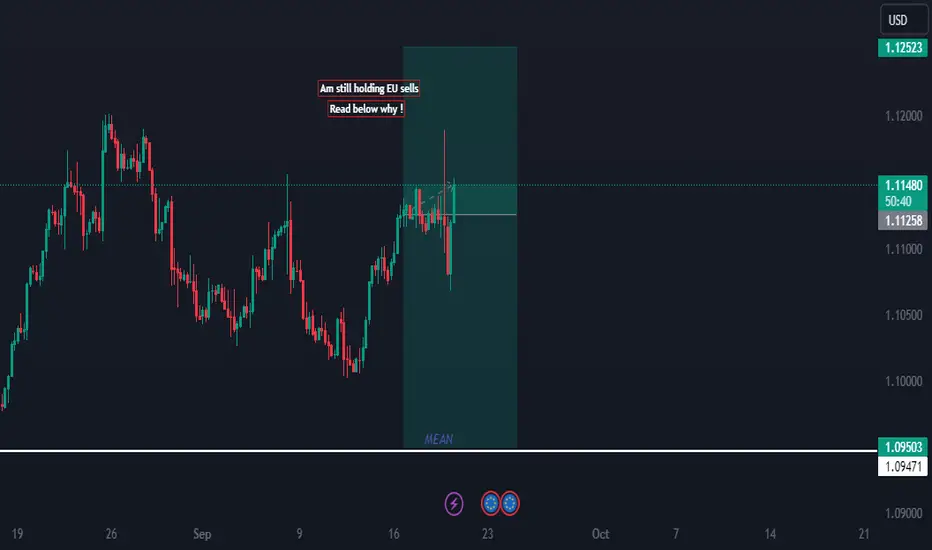
My EURUSD Sells update after FOMC meeting !! - Who's holding ??EURUSD Weekly Outlook (19/09/2024): Slight Bearish Bias
The EURUSD pair appears to be leaning towards a bearish bias this week, driven by several key macroeconomic factors and market dynamics. Let’s break down the main drivers shaping this outlook:
1. US Federal Reserve’s Hawkish Stance
The Federal Reserve's upcoming meeting is in sharp focus, with markets anticipating a potential reaffirmation of its "higher-for-longer" interest rate policy. Recent commentary and data suggest that inflation is still a concern in the U.S., and the Fed remains vigilant in maintaining a restrictive policy stance. The hawkish outlook for US rates bolsters the USD, placing pressure on EURUSD.
Expectations for future rate hikes or at least prolonged elevated rates support the dollar, as the interest rate differential between the U.S. and Europe continues to widen in favor of the USD.
2. European Central Bank (ECB) Dovish Tilt
Contrasting with the Fed, the ECB has shown signs of softening its hawkish tone. Last week, the ECB decided on what many view as a "dovish hike," raising rates but signaling that the peak of the hiking cycle may be near. The Eurozone's economic growth outlook is deteriorating, with concerns over a recession in key economies like Germany.
This dovish stance is weighing on the euro, as markets are pricing in fewer rate hikes going forward. With interest rate differentials playing a crucial role in FX markets, this is a key bearish driver for EURUSD.
3. Eurozone Economic Weakness
Recent economic data from the Eurozone has been disappointing. Manufacturing activity remains sluggish, and service sector growth has shown signs of stalling. Germany, the bloc’s largest economy, is particularly concerning, with its manufacturing PMI in contraction territory for months.
Furthermore, rising energy costs could add pressure on European economies, potentially reigniting inflationary concerns but also hindering growth. This weaker growth outlook could deter investors from taking long positions in the euro.
4. US Economic Resilience
On the other hand, the U.S. economy continues to show resilience. Robust labor market figures, strong consumer spending, and better-than-expected GDP data indicate that the U.S. economy is outperforming the Eurozone. This contrast in economic performance provides further support for the USD.
Moreover, the U.S. bond market continues to offer attractive yields relative to European bonds. Higher U.S. Treasury yields, especially on the long end of the curve, are a key factor driving demand for the dollar.
5. Geopolitical Risks & Energy Concerns
Geopolitical tensions, particularly surrounding the war in Ukraine and ongoing disputes over energy supplies in Europe, pose an additional downside risk for the euro. While energy prices have stabilized in recent months, any renewed supply disruptions as Europe heads into the winter season could reignite concerns over inflation and economic stability in the region.
If energy prices surge again, it could lead to further economic strain in the Eurozone, potentially pushing EURUSD lower.
Technical Outlook
From a technical perspective, EURUSD is currently testing key support levels around 1.0650–1.0700. A sustained break below these levels could open the door for a move towards the 1.0500 region, especially if the dollar continues to strengthen on Fed-related optimism.
On the upside, resistance lies near the 1.0800–1.0850 zone. Bulls would need to see a clear catalyst, such as dovish Fed signals or improved Eurozone data, to challenge these levels.
Conclusion
Given the hawkish Fed, dovish ECB, and weaker Eurozone economic data, EURUSD is likely to maintain a bearish bias this week. Traders should keep an eye on key U.S. data releases and any unexpected geopolitical developments that could impact market sentiment.
My personal Key levels to watch:
- Support: 1.0650, 1.0500
- Resistance: 1.0800, 1.0850
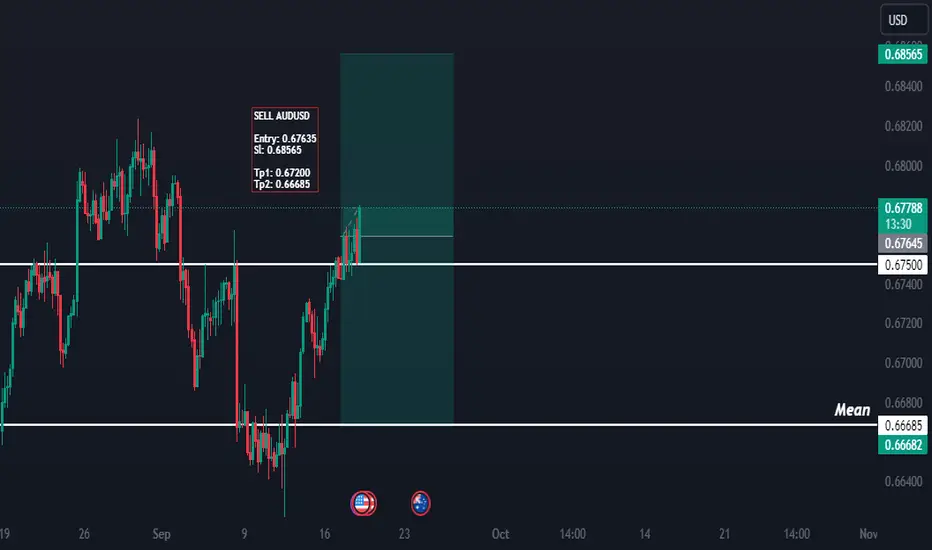
Still holding AUDUSD sells - Who's with me ?AUDUSD is likely to maintain a slightly bearish bias for the remainder of the week due to a combination of fundamental factors:
1. China’s Economic Slowdown: Australia’s economy is heavily tied to China due to its exports of raw materials like iron ore and coal. Recent weak economic data from China, including softer industrial production and ongoing concerns about its property market, have weighed on commodity currencies like the Australian dollar.
2. US Dollar Strength: The USD has remained strong, supported by expectations that the Federal Reserve may keep interest rates higher for longer. While the Fed is not expected to raise rates this week, the ongoing resilience in US economic data, particularly in the labor market and retail sales, is keeping the USD in demand.
3. RBA’s Dovish Outlook: The Reserve Bank of Australia (RBA) has adopted a more cautious tone recently, with inflationary pressures easing slightly and domestic economic growth showing signs of moderation. This has reduced market expectations of further rate hikes, weakening AUD.
4. Commodity Prices: Softness in commodity prices, particularly in key Australian exports such as iron ore, has added downside pressure to the AUD. Global risk sentiment remains fragile, and lower commodity demand amid concerns about global growth, especially in China, has further dampened the outlook for the Australian economy.
These factors suggest a continuation of bearish pressure on AUDUSD, although potential rebounds in risk sentiment or unexpected shifts in central bank policy could provide short-term relief for the pair.
A Merry Bitcoin Xmas 12 statistics for 12 historical Decembers:
December Marks pretty pivotable points in Bitcoin history. Typically the 19th-31st of December marks some decent moves, with either a slight pause for continuation or a major reversal.
12 statistics for 12 historical Decembers:
- AVG. Overall Returns +15.26%
- AVG. Positive Returns +52.73%
- AVG. Negative Returns -28.45%
- 7/12 saw Red candle closes, 5/12 saw Green. (2023 will likely be 6/12)
- 6/12 saw January close lower than Dec, whilst 6/12 did not.
- 4/12 we never saw Dec low prices again.
- 4/12 proceeded with a Jan-Feb monthly retraces (didn't close < Dec), whilst 4/12 continued higher.
- 4/12 saw lower prices proceeding more than 6 months.
- 3/12 were in mid bull markets (wave 3)
- 2/12 marked ATH's and to date 2/12 marked ATL's.
- 1/12 saw sideways action for 4 consecutive months
- 1/12 marked false low reversal signal (COVID)
In summary, for the 13th December close given the timing of cycles, this does mark a midterm turning point between cycles. Generally, at this point, it is more probable for a slight -25% retrace before continuation. Statistics on lower Dec ratios (<4/12) would suggest that in Q1 2024 we may just get the dip, but for how long will the Santa Rally continue? $48-50k high seems very likely but a close < FWB:31K in the coming months on the retrace would prove something else is at play.
Sorry for rez, here is a better screenshot

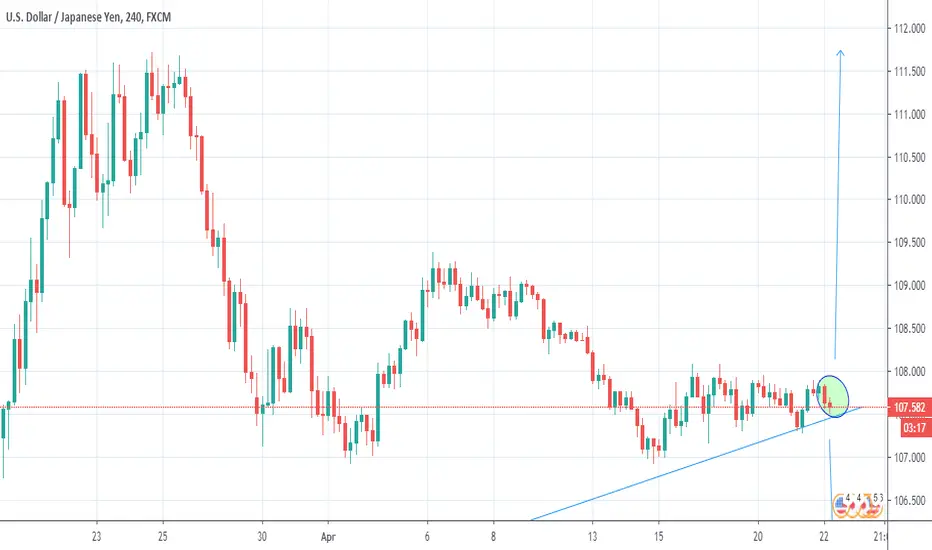
multi timeframe analysisIn our previous analysis we said that this pair its probability was at 50% now the probability of the pair is 47.71% this represent the probability of a sell trade. There is still a chance for this pair to drop considering the current situation. Which is favoring the jpy. To get the full analysis visit our website www.peenzorg.com to view the statistical analysis of usdjpy.
Good luck
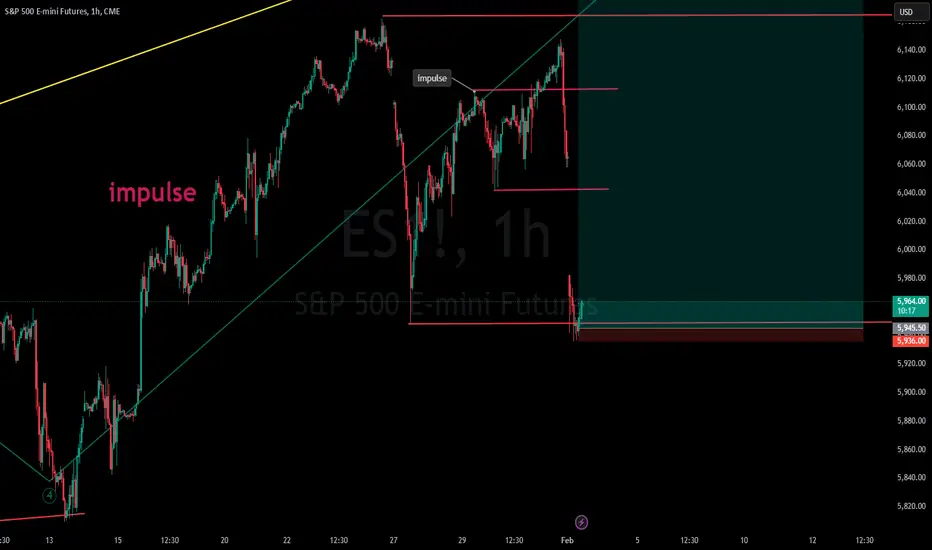
S&P 500 E-mini Futures Weekly Closing ProbabilitiesHere's the results from my statistical analysis for S&P 500 E-mini Futures on the weekly chart.
S&P 500 E-MINI STATISTICAL RESULTS
DATES:
02 Sep 19 / 06 Sep 19
CLOSING BETWEEN (at 06 Sep 19):
2877 - 2933: 75% Probability
2849 - 2960: 93% Probability
2821 - 2989: 98% Probability
P.S. This indicator is not for sale and will not be published.
DISCLAIMER: This is not financial advice
Trade safe,
Atilla

Dax Daily: 13th of May 2019Welcome to a new trading week. After the initial chop on Friday, the price descended towards the support level at 12036, which was well respected on the first attempt. During the second retest, the level was slightly broken. Following was the entry of buyers who took the price all the way to retest the resistance of 12 194 where Dax closed the week. Over the weekend, we open with a really significant gap.
Important zones
Resistance: 12 141
Support: trend line
Statistics for today
Detailed statistics in the Statistical Application (which you can find at ftmo.com/en/statistical-app)
Macroeconomic releases
NIL
Today’s session hypothesis
After price broke the trendline support and taking out the Fridays low, we can expect to test the trendline from the opposite side as resistance and continuation lower to approximately 11864.0 with potential filling of the gap from 3rd of April 2019.

+1@6390,-2934$(-45%) &+1@3690, -234$(-3.6%) - it's not working..Recently learning more about "statistical" arbitrage, will let you know when I've it ready..
Anyway got to keep hustlin.. you know..
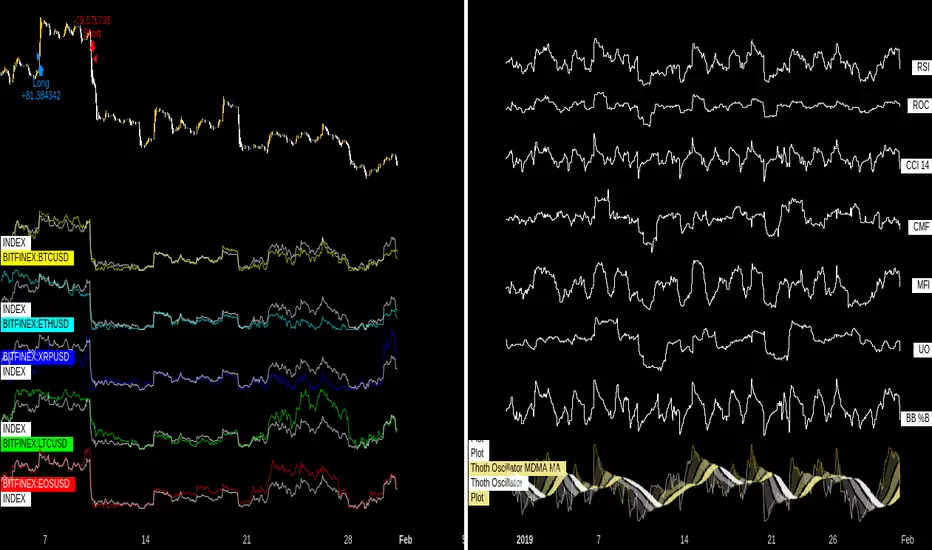
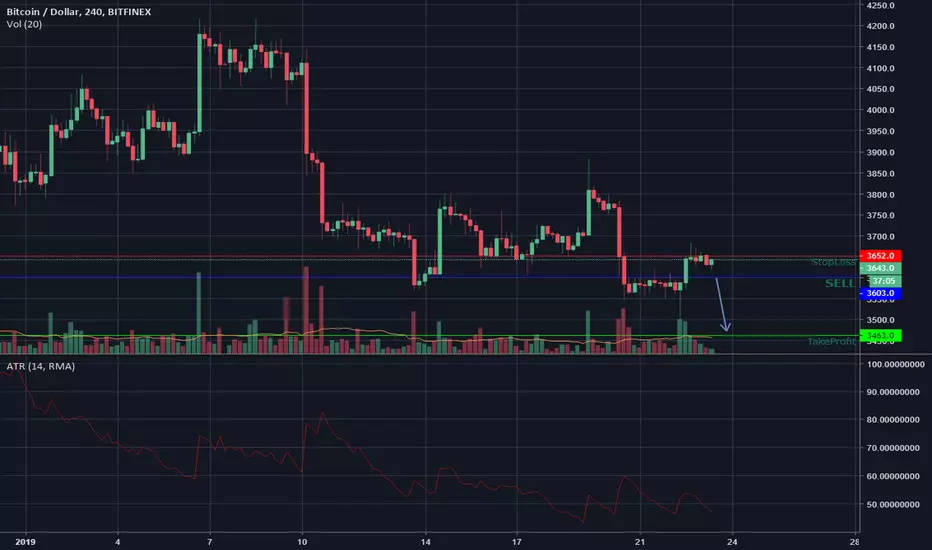
BTCUSD H1 Clear short-term downtrendHello, world.
This page is describing statistical analysis for BTCUSD.
This time we have a call for a fast down movement, which has been defined in 60% of cases similar to past 2 days price movement.
Robot opened a pending order:
BTCUSD SELL
3603
StopLoss 3652
TakeProfit 3463
Take care of risk management, and have a safe ride!
EURUSD H4 SELL: Statistically approved down-trend continuationHello, world.
This page is overlooking a statistical analysis, and I maintain work of a group of robots on Forex and Crypto.
Today we have another call for EURUSD.
As you could see, we already have a short order at 1.14726.
Currently, the same robot made another shot for a downward movement. From its perspective, we can shortly spot a sequel.
If we don't, we will close both orders in a nice profit from selling on high.
The robot's order:
EURUSD SELL
1.13891
StopLoss 1.14203
TakeProfit 1.12799
Keep your flight safe, and maintain strong risk management!
--
You can see our Crypto trading robot live at the free signal:
www.mql5.com

EURUSD SELL H4: Statistical, Counter-TrendHello, world.
This profile is focused on a statistical analysis, and our robot found out there is a 60% probability that we will reverse currently on EURUSD.
While candlestick patterns may show a good trending plot and we have support at 1.14591, if we look on data, there is a great possibility to reverse, as the robot sees a bull trap here last 2 days, and a consolidation which turns out to a decline.
It opened order:
EURUSD
1.14726
SL 1.15043
TP 1.13621
Enjoy your sailing, and keep stable risk management!

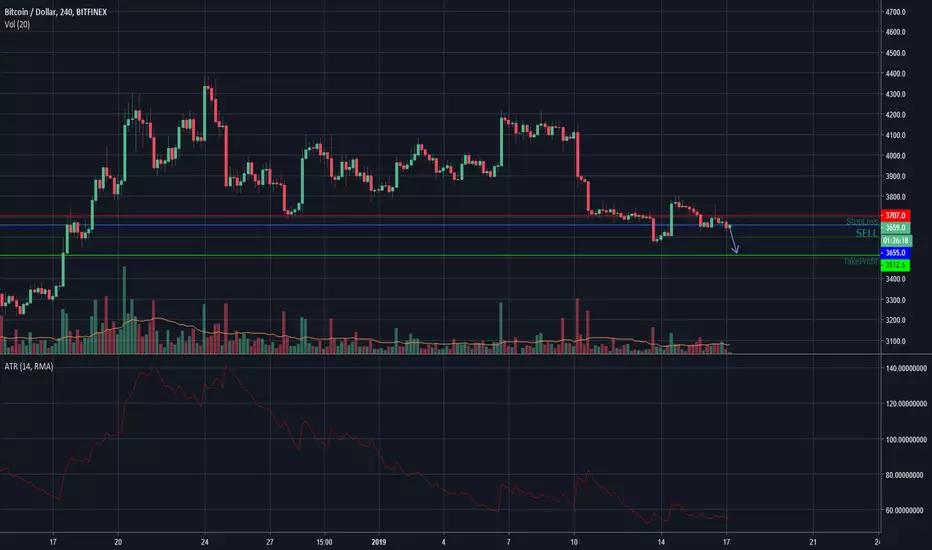
BTCUSD H1 SHORT: Short-term downside trendHello, world.
As this page focus on a statistical design for trading, our robot shows there is currently a lack of demand at BTCUSD.
It oversees in a 60% of such scenarios its lead for a short-term down movement in 2018.
Keep stoploss tight as in the wrong case we could see a fast alteration.
The robot's opened order:
BTCUSD SELL
3655
StopLoss 3707
TakeProfit 3504
Keep a smooth sailing, and hold on good risk management!
--
You can look for our robot's live trading at a free signal:
www.mql5.com
BTCUSD LONG H1: ROLLBACK TO 3900, statistical counter-trendHello, world.
This page is overviewing quantitative analysis, and I manage several robots trading crypto right now.
BTCUSD is currently looking bearish, meanwhile, from a statistical point of view, it should have another push-up today, heading towards 3900, until we see any other continuation.
Our robot has opened a buy stop position at 3762.
BTCUSD BUY
3762
StopLoss 3709
TakeProfit 3915
Have a safe flight, and take care about risk management!
--
We have all our trades live at educational robot profile:
www.mql5.com

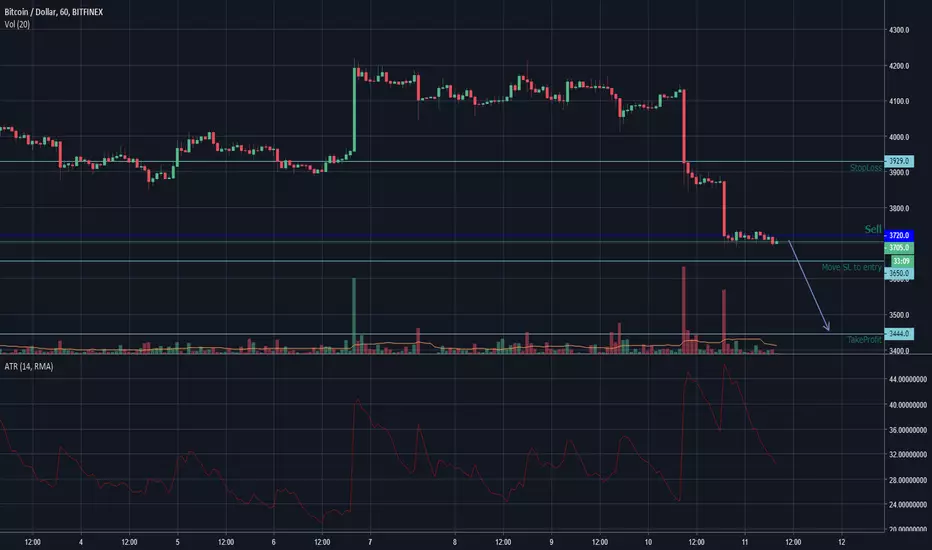
BTCUSD Short H1 for trend-followingHello, yesterday drop came unexpected, we just had to keep a stoploss tight, and fix drawdown at 3790 levels.
Today, two of our robots opened about the same short order on BTCUSD.
It means there are double chances and we distribute risk management properly.
This time it's a trend-following strategy, where we catch a wave which is not finished yet.
Open a sell order in between 3720 - 3690.
BTCUSD SELL
3720-3690
StopLoss: 3929
TakeProfit: 3444
When the price comes to 3650, move stoploss to an entry point.
Remember to keep your money management for the whole account. Don't take a risk larger then you could lose.
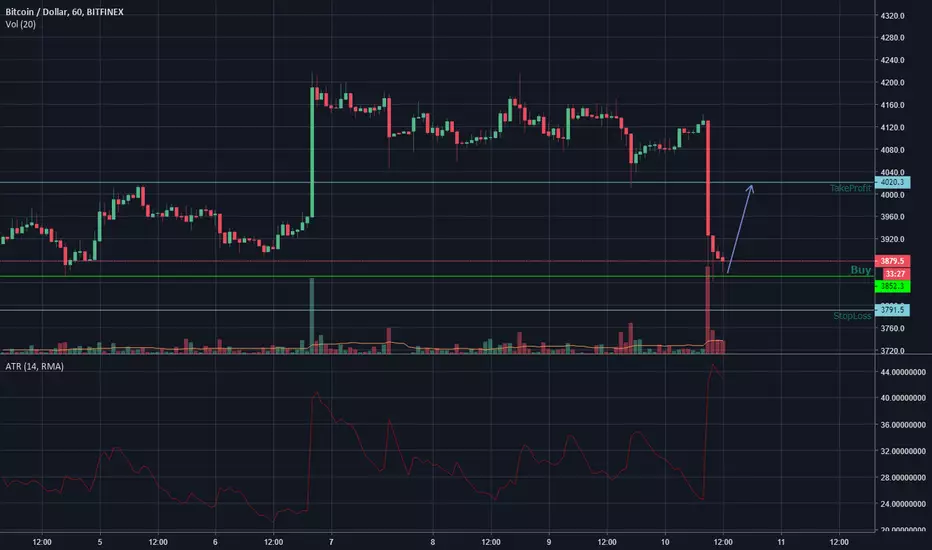
Bitcoin long on H1: follows counter-trending approachHello, world.
This page follows a statistical approach to a currency trading. I personally manage 6 robots on a master account which trades crypto and fiat currencies.
I will redirect preferred trades to TradingView as an endeavor of collaboration with the community and bringing awareness to a data-mining community of traders.
Wish you all the best takes in this journey!
--
The first our trade is the bearish trap. According to a robot's hypothesis, BTCUSD will recover soon, and it placed a trade on a scalping position in the very base of the last panic bar.
You may place an order according to your money management strategy, it could be anywhere between 3850-3890.
BTCUSD Long position:
3850-3890
StopLoss: 3792
TakeProfit: 4020
S&P 500 - Long Term Bear TrendThis chart represent the bull and bear markets in the S&P 500 during the last two decades. According to this analysis and based on statistical inference, we could have started the bear trend that might during until March 2020. On average bear markets length approximately 18,5 Months ((28+17+11 )/3) and depreciate close to 41% ((50%+58%+15%)/3) since the life time high (from 2940 to 1735). On the other hand, completed the depreciation period, the bull market reveal a huge potential providing on average 129% gains ((103%+221%+63%)/3) with a duration of 56 Months ((63+74+31)/3).
For active investors some caution is recommended with the crystallization of gains, while some opportunities arise from the correction.

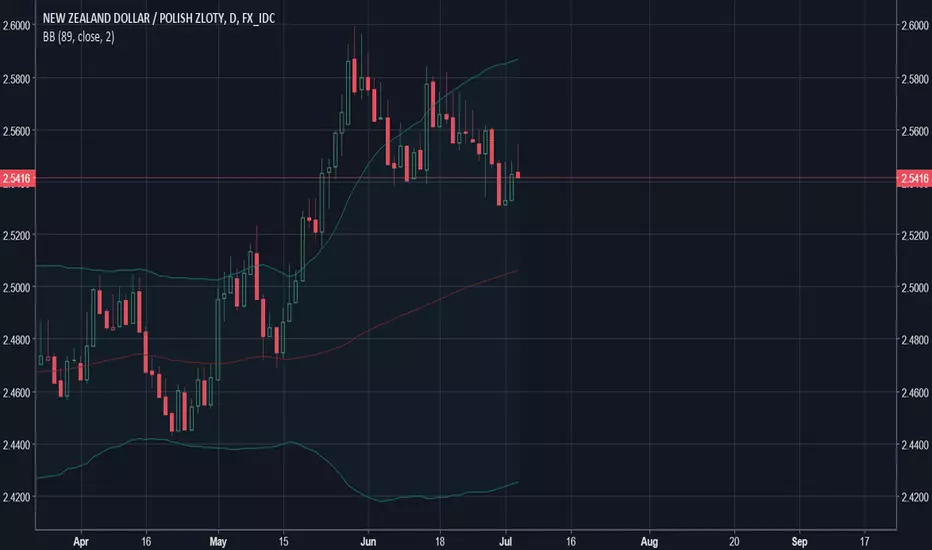
Kiwi-Zloty - market neutral hedge #3NZDPLN performing ahead of G10 exchange rates.
Shorting a bit late from 2 standard deviations of
SMA in price on the daily chart but expecting a target
near the mean.

it is time to long USDJPY 110.40 ;ITis time to long USDJPY 110.40 ;
SL:109.00 TL:111.80 FX_IDC:USDJPY
THIS is statistical transaction.
This week is expected to reach the profit point
