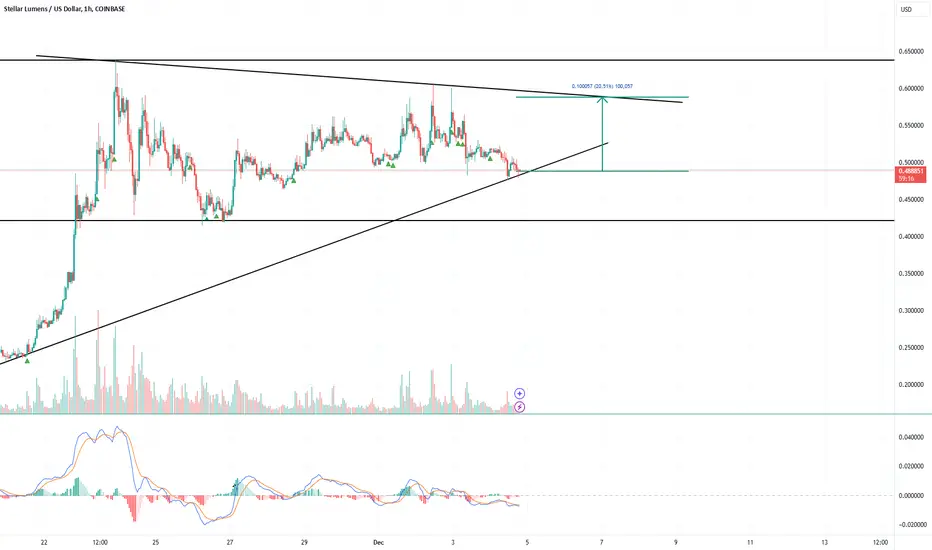
Bullish on XLMUSDTStellar / XLM turns bullish again, retracement is over. We have an EMA cross, we have passed an high volume node and now we try to move above EMA200. As soon as we manage to stay above we will head for the targets around 0.46$ and 0.52$.
For more trade ideas check and insights check our profile.
Disclamer: only entertaining purpose, no financial advice - trading is risky.
Stellarlumens

Stellar (XML) Price Ends 2-Week Downtrend As Inflows SpikeBINANCE:XLMUSDT price is currently trading at $0.41 1, just under the resistance level of $0.424. Breaking this resistance will be key for XLM to recover the recent losses and continue its upward trajectory. The Parabolic SAR moving below the candlesticks after two weeks signals that the downtrend is coming to an end.
Ethereum’s technical indicators also suggest a return to bullish momentum. The Relative Strength Index (RSI) has moved back into the positive zone, above the neutral 50.0 mark, after briefly dipping into bearish territory. This reversal from the prior downtrend shows that BINANCE:XLMUSDT is regaining strength.
The RSI indicates that investor sentiment is improving . The brief period of bearishness was likely caused by broader market uncertainty and skepticism. However, with the RSI back in the positive range, the likelihood of further price increases has increased.
If Stellar can flip $0.424 into support , it could pave the way for a rise past $0.445 and possibly reach $0.470 . This would allow BINANCE:XLMUSDT to recover a significant portion of the losses it sustained over the past two weeks and continue its uptrend.
However, if broader market conditions fail to remain bullish and investor sentiment turns negative, BINANCE:XLMUSDT could face a decline. A failure to maintain support at $0.424 could lead XLM to drop to $0.393 , with further bearish momentum pushing the price to $0.359, invalidating the bullish outlook.

Stellar (XLM) Shoot Up 11%, Aims To Cross This Barrier
BINANCE:XLMUSDT price has increased by 11% over the last 24 hours , positioning it among the top-performing altcoins. Trading at $0.4077 , the altcoin remains under the resistance of $0.4245. This indicates potential for a breakout if broader market conditions stay favorable and support the bullish trend.
The 50-day exponential moving average (EMA) provides strong support, signaling that the broader market momentum is bullish. This support could propel BINANCE:XLMUSDT towards $0.4450 , with further gains potentially pushing it to $0.4701, confirming the continuation of its positive trajectory in the market if conditions remain favorable.
However, if market conditions worsen , especially with the upcoming August 7 announcements, XLM might fail to breach $0.4245 . In this case, the price could fall to $0.3597 , and losing this support would invalidate the bullish outlook for BINANCE:XLMUSDT , signaling potential downside risks in the coming days.


XLM To $0.74I'm looking for XLM to continue to the downside followed by a move up. I will place a buy at the 50% fib level or in between the 50% and 61.8.

STELLAR LUMENS - DOLLAR COST AVERAGE FOR LONG TERM GAINSSTELLAR LUMENS (XLM) has taken off late 2024 from under .10 cents and now trading at .40 cents for a 400% Gain in 6 months so far, and there is much more upside to come potentially. It hit all time highs around .50 cents and now the token seems to want to test those highs in the near term 2025, we can easily see XLM approach $1.00 towards 2026 for a 100% gain and even higher longer term. Overall, XLM moves with XRP and we all know XRP is a blue chip project, it has all the funds and institutional backing, and so does XLM.
Both projects share a common creator in Jed McCaleb, however they have different focuses. Ripple, and its native token XRP, was initially designed to facilitate cross-border payments for financial institutions. Stellar, on the other hand, focuses on financial inclusion and aims to provide accessible financial services for individuals, including remittances and access to banking services.
CAN WE SAY BULLISH?! TO THE MOON!!!

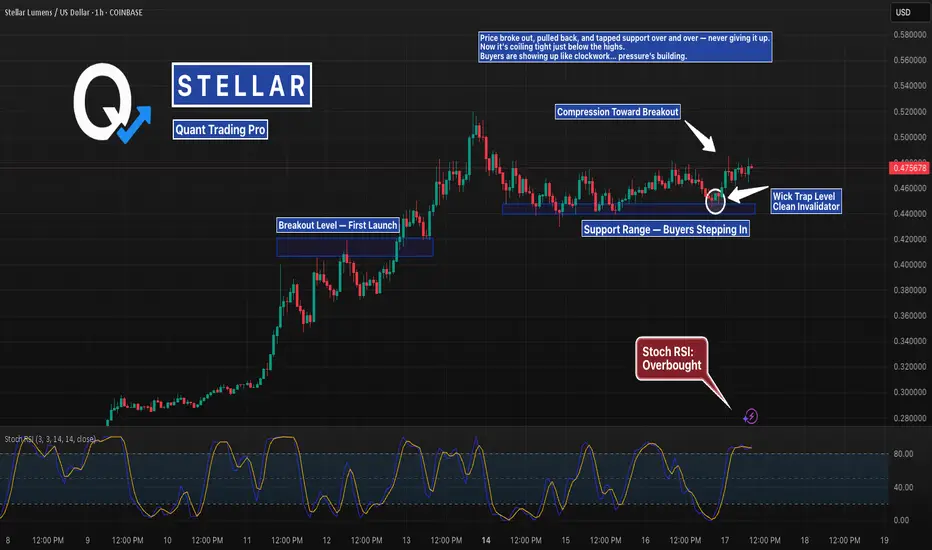
XLM Coiling at the Highs After Holding Support PerfectlyStellar broke out, then printed the cleanest support range you’ll find.
Wicks into demand, fast rejections, and now it’s compressing just under resistance.
If it breaks from here, there’s room to stretch.
But don’t forget — the longer it coils, the harder it snaps.
#XLM #StellarLumens #XLMUSD #SupportAndResistance #BreakoutSetup #CryptoCharts #TradingView #QuantTradingPro #BacktestEverything
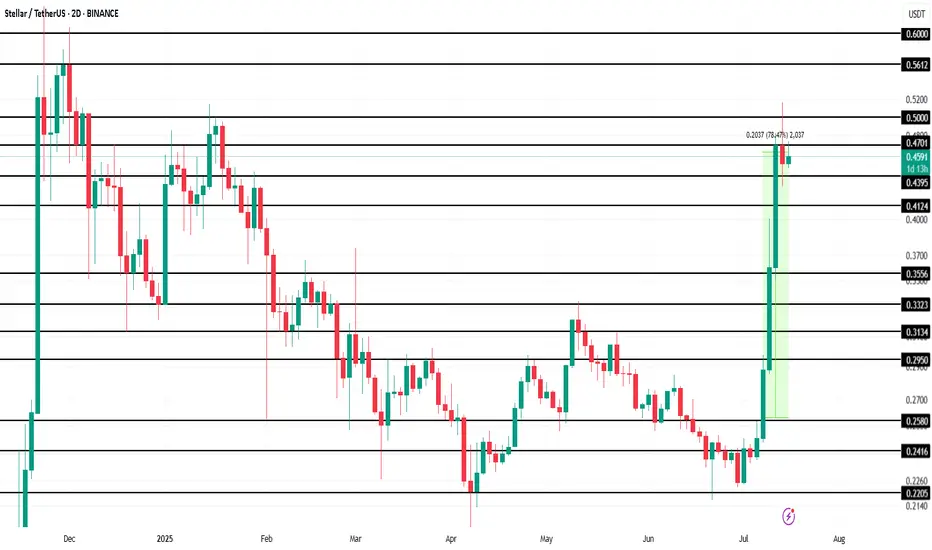
Stellar (XLM) Makes History Amid 78% Price Surge This WeekBINANCE:XLMUSDT is currently trading at $0.46, up 78.5% over the past week . However, the altcoin faces resistance at $0.47, a level it has struggled to breach in recent days. The ability to break this resistance is crucial for continued growth, as it will determine whether XLM can push higher.
BINANCE:XLMUSDT futures market activity has also surged, with Futures Open Interest hitting an all-time high of $520 million in the last 24 hours. This indicates that traders are increasingly interested in the asset's derivatives, which are capitalizing on its rise.
Given the strong sentiment from futures traders and the technical indicators, it is likely that BINANCE:XLMUSDT will push past the $0.47 resistance and target $0.50 in the coming days . A successful breakthrough could lead XLM toward its next target at $0.56, marking an eight-month high. This would signify continued strength for the asset.
However, if the broader market sentiment shifts or investors begin to sell their holdings, BINANCE:XLMUSDT could face a significant pullback. If the price falls below the key support levels of $0.43 and $0.41 , it could slide further to $0.35, which would invalidate the current bullish outlook.
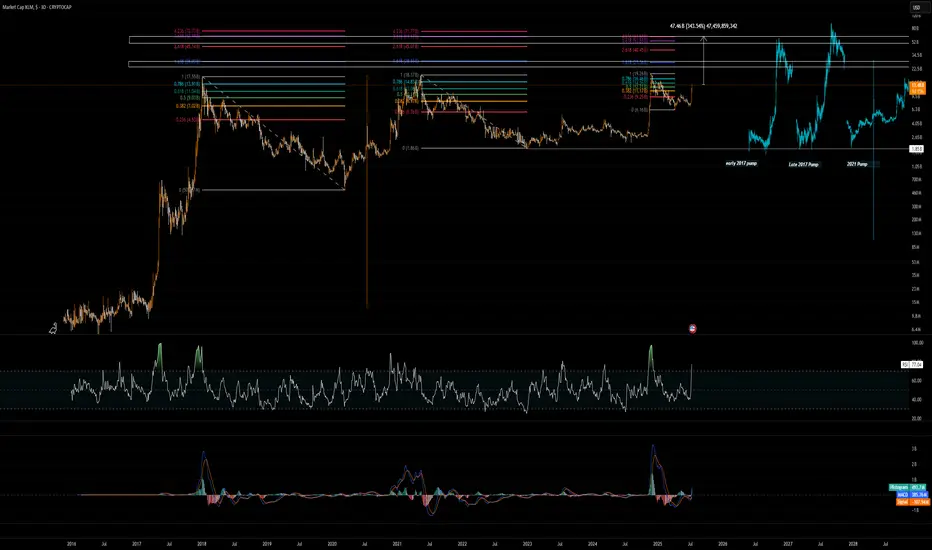
XLM potentialXLM shows a great performance this cycle so far and it finally show some independency from XRP and lead without XRP getting pump.
Some might think it will go for ever, I am sorry to break your heart it won't be more than $70B market cap. best case scenarios.
Around $15B to $19B there will the first resistance.
1.618 fib in all timeframes will be the next, which will be $20B - $28 Market cap I think safe bet for final exit will be $53B market cap which is 350% from here.
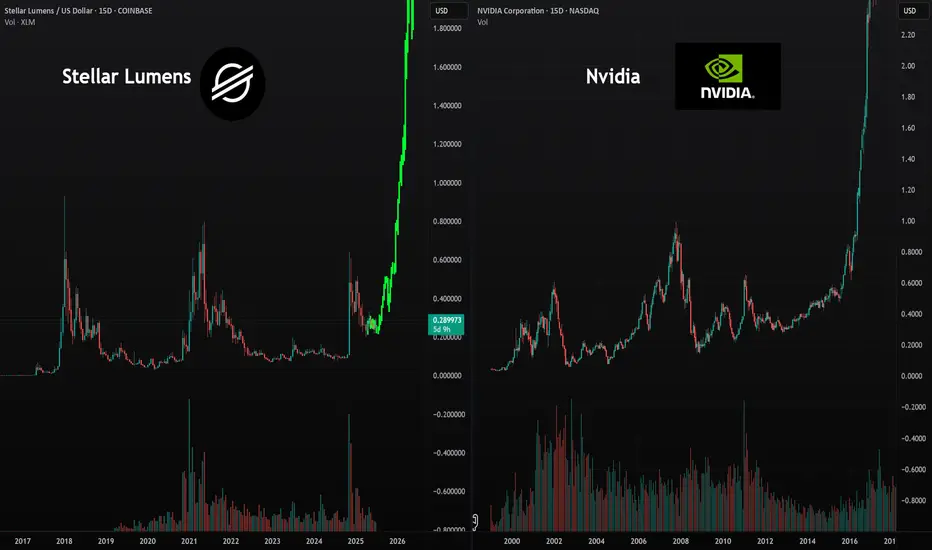
Stellar Lumens Looks Ready for Blast-Off!There is a very similar trend happening with the technology of the internet and computing as what we’re seeing now with AI and crypto. The early accumulation cycle for Nvidia would have shaken out many investors simply because of how long it took before going parabolic. Stellar Lumens is showing the same pattern—but the wait could be over. I see a large parabolic run coming for Stellar Lumens very soon, one that could take us to new all-time highs and spark a mass adoption cycle similar to what happened with internet and computing technology.
As always, stay profitable.
- Dalin Anderson
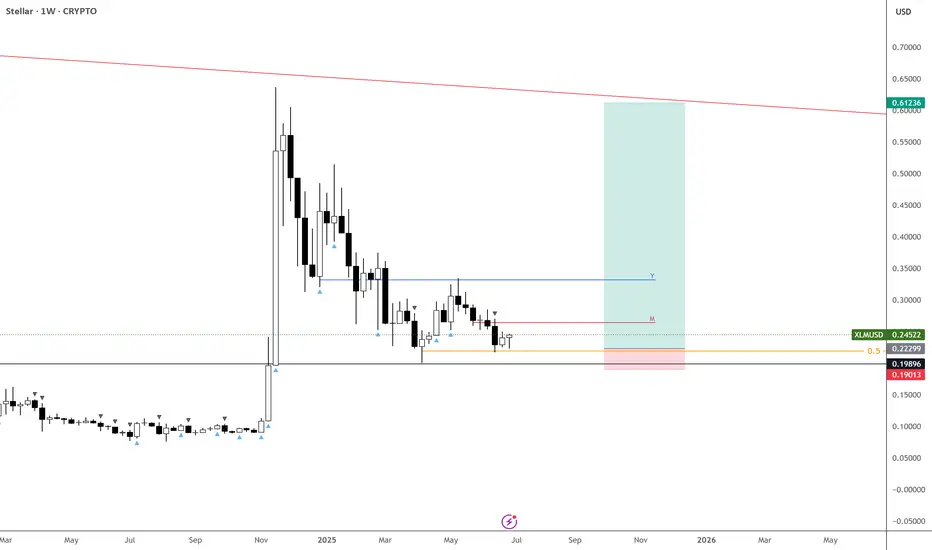
XLM – Bottom In, Eyes on $1+
XLM looks bottomed—hard to ask for a better setup than this.
Invalidation is clear: new lows. But as it stands, this is a clean weekly block retest that looks ready to launch.
From here, I’m expecting the move to begin.
See you above $1 CRYPTOCAP:XLM $XLMUSDT.
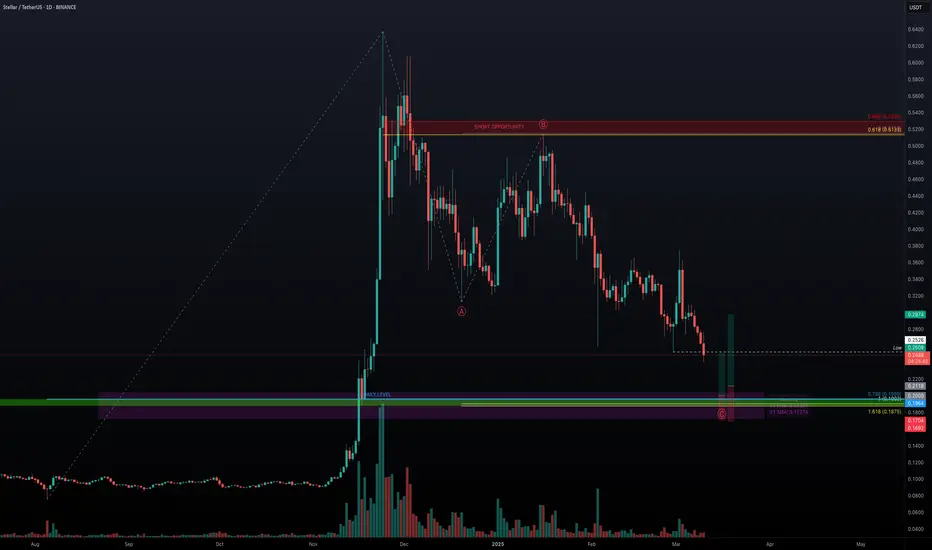
XLM Crashes Below Key Support – Is a Reversal Near?XLM has broken its previous low, raising the question: where is the next major support zone? To determine this, we will focus on fibonacci, moving averages, and order blocks to find a high-probability bounce area for a potential long position.
🔍 Fibonacci Retracement – Locating the Next Support Level
Using the Fibonacci retracement tool from the low at $0.0757 to the high at $0.6374:
0.618 Fib Retracement → $0.2903 (Already Lost) ❌ Current Price: $0.248
Next Major Fib Level – 0.786 Retracement at $0.1959
Since the 0.786 Fib level is a key retracement point, we need further confluence factors to confirm its strength as a potential support zone.
🔗 Confluence Factors Strengthening the Support Zone ($0.1959 – $0.17179)
1:1 Trend-Based Fibonacci Extension
High: $0.6374
A: $0.3179
B: $0.515
1:1 extension aligns at $0.1902 → Strong confirmation near 0.786 Fib retracement ✅
Wave A-B Fibonacci Extension
1.618 Fib extension from wave A to B is at $0.1875 → Aligns with the 1:1 trend-based extension ✅
Daily Support Level at $0.1962
Sits almost exactly at the 0.786 retracement ($0.1959) ✅
21 EMA & 21 SMA for Moving Average Support
21 EMA at $0.20338
21 SMA at $0.17187
Order Block Between $0.2208 – $0.1964
Demand area aligns with the major support zone ✅
Key Takeaway:
A high-probability support zone is now identified between $0.1959 and $0.17179, with multiple confluences suggesting a strong potential bounce.
Trade Plan – Scaling Into a Long Position
Given the strong confluence at the support zone, the best approach is scaling into a long trade.
DCA Entry Strategy:
Start scaling in at $0.22, as an order block exists between $0.2208 – $0.1964
Main focus remains on the support zone ($0.1959 – $0.17179)
Stop Loss:
Below the 21 SMA ($0.17187) for invalidation
Take Profit Levels for Optimal R:R:
First TP at $0.25 → Resistance area
Next TP at $0.30 → Strong psychological & resistance level
R:R Approximation:
2:1 R:R for first TP ($0.25)
3:1+ R:R if targeting $0.30
High-Probability Support Zone Identified
✔ Multiple confluences confirm a strong support zone at $0.1959 – $0.17179
✔ Scaling into a long from $0.22 to $0.17179, with stop loss below the 21 SMA ($0.17187)
✔ Take profit levels set at $0.25 & $0.30 for a solid R:R trade
Alternative bullish scenario: A reclaim of lost key low at $2526 with rising volume could signal a long opportunity, only on confirmation.
💬 Will XLM bounce from this key support? Let me know your thoughts in the comments! 🚀🔥
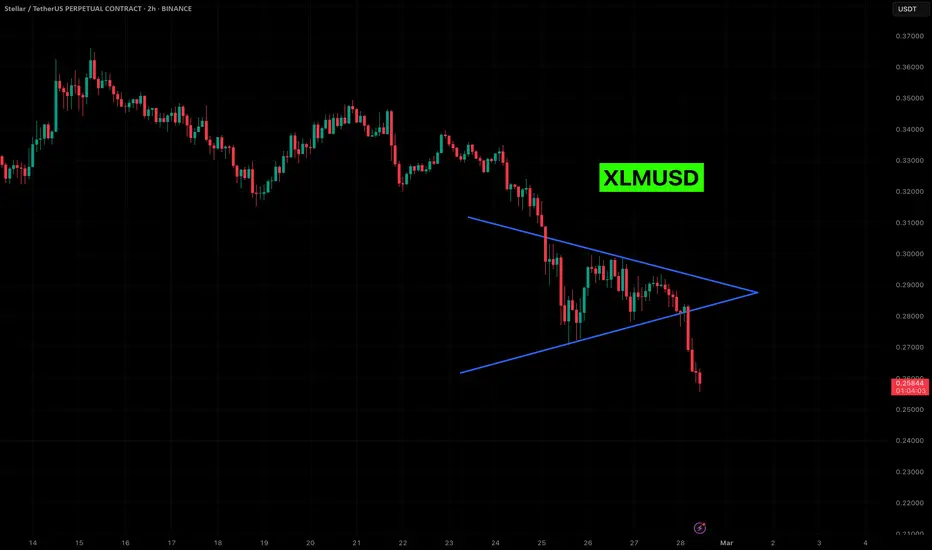
XLMUSD - SHORT SETUPCoin: #XLM/USDT
Short Set-Up
Leverage: 5-10x
#XLM already breaked down the symmetrical triangle and looking bearish.
Entry: 0.278 - 0.284$(Enter partially)
Targets: 0.272 - 0.266 - 0.260 - 0.254 - 0.242 - 0.230$(Short term)
Stop-loss: 0.290$
Please support with a like/boost and follow for more useful crypto updates!
To Thine Own Shoe be True - $BTC's Other Foot is About to FallBitcoin’s Floor Must Be Lower – Chart Physics and Market Psychology at Work
In this video, I explain why Bitcoin has no choice but to find a lower floor, despite many traders believing the worst is behind us. While price is briefly going to appear to confirm support, this is just part of the process before it comes back down and breaks through it on the third test. The real focus here isn’t whether this level holds for another day or two—it’s about why Bitcoin must go lower before it can establish true support.
For a long time, Bitcoin has been floating over clear air with no real structural support. When price climbs too high without building a strong foundation, it eventually has to fall back down to fill the gaps. Right now, the market is in denial, desperately trying to hold Bitcoin in the $90,000 range, but this isn’t about what traders want—it’s about chart physics and liquidity. When there’s nothing left to hold the price up, it must seek a lower equilibrium.
Psychologically, traders don’t want to accept that Bitcoin might have to revisit $70,000 or lower to reset before moving higher. But markets don’t move based on hope—they move based on supply, demand, and liquidity positioning. Right now, there are no meaningful buyers willing to absorb the sell pressure at this level, which means Bitcoin has nowhere to go but down. Once it finally breaks through, it will likely move quickly, as there’s no real support structure beneath it.
Know thy shoe.
The shoe will find the ground.
(My sincerest apologies about the volume ladies and gentlemen. The problem which I thought I had corrected from a prior video still exists in this video. It is an issue I'm hoping Trading View can correct before too long on their end… The problem originated on my end, but there was nothing I can do after it was recorded, and I had to get this video up there - I believe it contains important time sensitive information…
Please try listening with the volume turned all the way up or perhaps with headphones until the problem can be corrected.
My system issue has been corrected for the future, but Trading View if you can, please tweak this on your end and amplify it. This video is extremely worthwhile..)

XLM may bounce here #XLM #stellar is now sitting on a major support zone (red box) and may likely have a bounce here for short term movement.

XLM will have a decision#stellar #xlm price is now testing a major resistance zone, now. This zone is also the bearish retest zone of where CRYPTOCAP:XLM broke the support. So, this retest will be very important.

XLM UPDATE VIDEO UPDATE COMING SOON!XRP has hit a new all-time high, shifting its pattern to one previously seen in XLM—a topic I’ll cover in my upcoming XLM update in the next few days.
This development could have major implications for the future of both cryptocurrencies. While I see significant headwinds in the near term, I’m closely monitoring these patterns before releasing my next video.
Global markets are getting increasingly interesting, and I believe 2025 will be a pivotal year.

XLM - Will XLM Find Strength or Stumble?XLM has been in a downtrend for the past 10 days after rejecting from the 0.618 Fibonacci retracement resistance. The price action shows lower highs and lower lows with no significant volume, signaling a potential continuation of the trend. Let’s identify the key support and resistance zones and possible trade setups.
Support Zone
A strong support zone lies between $0.3725 and $0.3695 based on multiple confluences:
Monthly Level: At $0.3725
Anchored VWAP: From the very low, the VWAP aligns with the monthly level
Fibonacci Retracement: Drawing the fib retracement from the year’s low to the recent high, the 0.75 Fibonacci level lies at $0.3695
Resistance Zone
Key Level: Price data highlights $0.435 as a significant S/R zone
Fibonacci Retracement: The 0.618 Fibonacci retracement from the current wave aligns with the key level
Short Trade Setup
Entry: 0.618 Fibonacci retracement/key level at around $0.435
Stop Loss: Above the previous high
Take Profit: Target the support zone at round $0.3725
Risk-to-Reward (R:R): 4.5
Long Trade Setup (on confirmation)
Entry: Long position between the support zone of $0.3725 and $0.3695
Stop Loss: 3% SL
Take Profit: around 0.39/0.4
Risk-to-Reward (R:R): 2 or better

Stellar (XLM) Price Breakout Fuels 30% Surge Hopes
Stellar Lumens (XLM), the cryptocurrency designed to facilitate fast and low-cost cross-border payments, has recently shown signs of a potential breakout, sparking speculation about a significant price surge. After a period of relative stagnation, XLM has demonstrated renewed momentum, capturing the attention of traders and investors alike. This article delves into the factors contributing to this potential breakout, examines technical indicators, and explores whether a 30% surge is a realistic possibility.
Stellar’s core mission is to provide an efficient and inclusive financial ecosystem, particularly for underserved populations. It aims to streamline international transactions, making them faster, cheaper, and more accessible than traditional banking systems.1 This focus on real-world utility has always been a strong foundation for XLM, and recent developments suggest this utility is beginning to translate into market action.
Factors Driving the Potential Breakout:
Several factors contribute to the current bullish sentiment surrounding XLM:
• Increased Network Activity: A key indicator of a healthy blockchain network is its level of activity. Recent data suggests a significant uptick in transactions on the Stellar network. This increased usage indicates growing adoption and demonstrates the platform’s real-world utility. This increased activity could be attributed to new partnerships, integrations with existing financial institutions, or the organic growth of its user base.
• Growing Institutional Interest: While not as prominent as Bitcoin or Ethereum, Stellar has been quietly attracting institutional interest. Its focus on regulated financial services and its compliance-friendly approach make it an attractive option for institutions seeking to explore the potential of blockchain technology. Increased institutional involvement often translates to larger trading volumes and can significantly impact price action.
• Favorable Regulatory Landscape: The regulatory landscape for cryptocurrencies is constantly evolving. Positive regulatory developments, particularly those related to cross-border payments and digital assets, can create a favorable environment for projects like Stellar. Clearer regulations can foster greater confidence among investors and encourage wider adoption.
• Technical Indicators: From a technical analysis perspective, XLM has shown promising signs. Recent price action has seen XLM break through key resistance levels, suggesting a shift in momentum.2 Trading volume has also increased, further supporting the bullish narrative. Several technical indicators, such as moving averages and relative strength index (RSI), point towards a potential upward trend.
• Focus on Decentralized Finance (DeFi): While Stellar isn't primarily known for DeFi, the network has seen increasing development in this sector. The growth of DeFi applications on Stellar could attract new users and capital to the ecosystem, further driving demand for XLM.
Technical Analysis and Price Prediction:
Analyzing XLM's price charts reveals a potential breakout pattern. The price has been consolidating within a defined range for a period, and the recent break above this range suggests a potential shift towards an upward trend. This breakout is further supported by increased trading volume, indicating strong buying pressure.
Several technical indicators suggest a bullish outlook:
• Moving Averages: The price of XLM has crossed above key moving averages, such as the 50-day and 200-day moving averages, which are often interpreted as bullish signals.
• Relative Strength Index (RSI): The RSI, a momentum indicator, is showing increasing strength, indicating growing buying momentum.
• Volume: The increased trading volume accompanying the price breakout provides further confirmation of the bullish trend.
Based on these technical indicators and the current market momentum, a 30% surge is a plausible scenario. However, it’s crucial to remember that the cryptocurrency market is highly volatile, and price predictions are not guaranteed.3 Several factors could influence XLM’s price action, including overall market sentiment, regulatory developments, and competition from other cryptocurrencies.
Is a 30% Surge Realistic?
While the technical indicators and fundamental factors suggest a potential for significant price appreciation, a 30% surge should be considered a potential target rather than a certainty. The cryptocurrency market is known for its volatility, and unforeseen events can quickly change market sentiment.4
Conclusion:
Stellar’s XLM is showing promising signs of a potential breakout. Increased network activity, growing institutional interest, favorable regulatory developments, and positive technical indicators all contribute to the bullish sentiment. While a 30% surge is a realistic possibility based on current trends, investors should exercise caution and conduct thorough research before making any investment decisions. The cryptocurrency market is highly volatile,5 and it’s essential to manage risk effectively.6 However, the current momentum surrounding XLM suggests that the project is well-positioned for future growth and could offer significant potential for investors. The focus on real-world utility and the development of the Stellar ecosystem continue to be key factors to watch in the coming months.

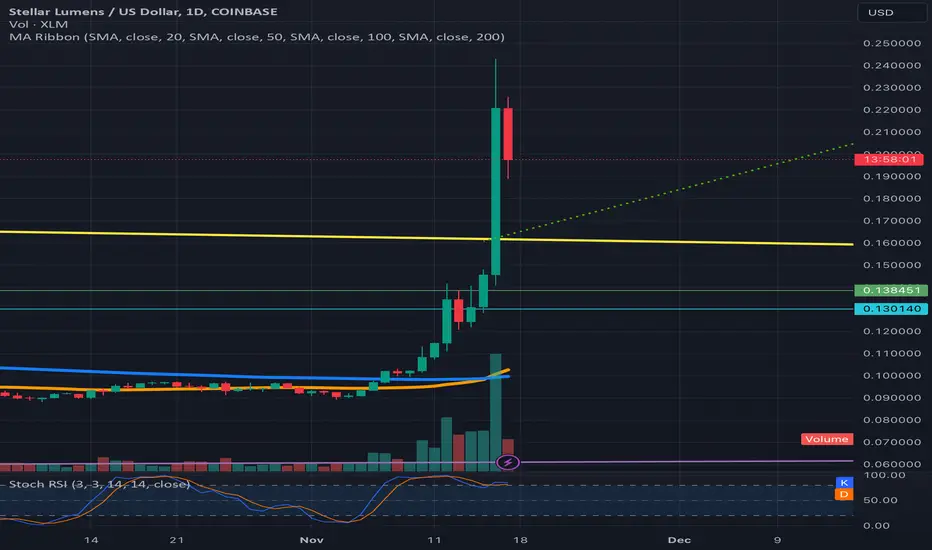
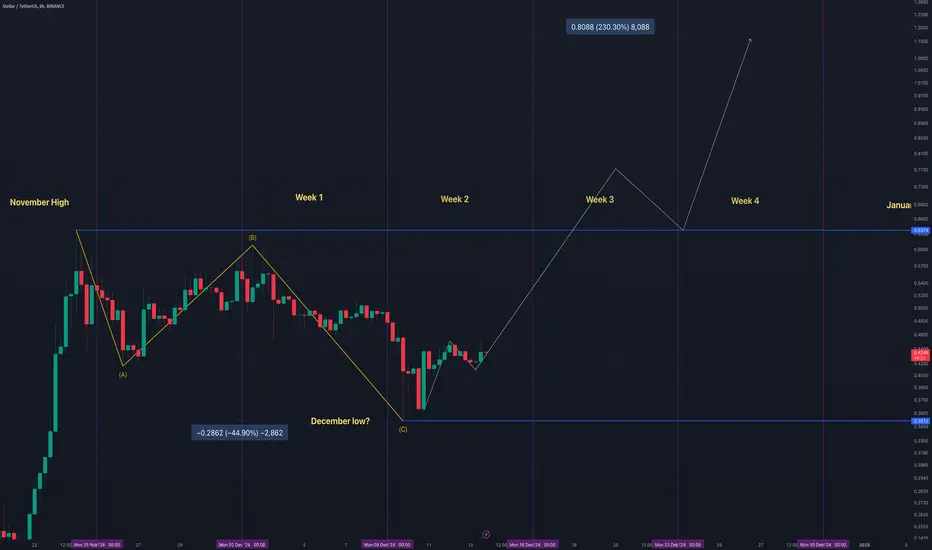
XLM's Correction Complete? Targeting $1.10 with Strong MomentumContext and Recent Price Action
XLM has been one of the standout performers in recent months, showcasing impressive bullish momentum:
The November Surge: Starting from $0.084 in early November, XLM skyrocketed to a peak of $0.63 by the end of the month. This remarkable 613% rally highlights intense buying pressure and growing market interest.
The Correction: Following this explosive move, XLM entered a natural consolidation phase, retracing about 40% of its gains. This correction has formed a classic ABC pattern, with the price finding support at $0.35. Such retracements are common after parabolic moves and often set the stage for the next leg higher.
The Bullish Reversal: On Friday, December 13th, XLM has begun to show signs of renewed strength. After revisiting the $0.35 low, the price has rebounded to $0.43, forming a solid bullish engulfing candle on the 6-hour timeframe. This is a strong indication that buyers are regaining control.
Outlook and Target Projection
XLM's structure suggests the corrective phase is nearing its end, paving the way for the next impulse wave. Considering the prior momentum and market conditions, a price target of $1.10 is highly probable within the next 2 weeks.
Key Levels to Monitor
Entry Point:
Current price at $0.43 provides an attractive entry zone for buyers anticipating the next move higher.
Profit Targets:
$0.65 – Retest of the November high.
$1.10 – Extended target based on historical momentum and potential wave projections.
Stop Loss:
Below $0.35 – A breach of this support would invalidate the bullish thesis and could lead to further downside exploration.
Risk-to-Reward Analysis
With the price currently at $0.43:
Downside Risk: Stop loss at $0.35 results in a risk of ~18.6%.
Upside Potential: Targeting $1.10 offers a reward of ~155%.
This gives a compelling risk-to-reward ratio of approximately 8:1.
Conclusion
XLM's recent surge, healthy correction, and current bullish signals create an excellent opportunity for traders. With clear profit targets at $0.65 and $1.10, and a well-defined stop loss at $0.35, this setup offers a strong blend of technical reliability and favorable risk-to-reward dynamics. As XLM completes its consolidation, it seems poised to resume its upward momentum.
Let me know if you’d like further refinements!
XLM back to .58XLM back to .58
XLM can bounce to the .55 level which has more than 15% upside.
Idea would be invalidated if XLM sustains below .47 for more than 24-36 hours
More proof Goldencross works immediately in this phase of bullJust like the char I posted before this one, I’m posting this simply to lllustrate how the golden cross (orange line crossing above the blue line) immediately resulted in a very pivotal bullish pump that coincided with a major fulcrum point on the chart recently on multiple different charts. More times than not in the other market cycles, when a golden cross occurs it usually takes a few weeks afterwards to know whether that cross will have its desired outcome or instead end up being a fakeout but lately I’ve noticed multiple charts have seen an instantaneous pump on the exact day of the golden cross, which is making me think that once we enter the 2nd parabolic phase of a bull market that that is when you can anticipate a golden cross to have its immediate intended effect its suppose to have with much much higher probability than all the other market phases including even the 1st half of the bull market. Anyways I wanted to illustrate that hypothesis here with the XLM chart as you can clearly see it’s a text book example, and I will try to put a link below to the previous example where this occurred as wel a link to the total2 chart which will have its golden cross in the next 102 daily candles.l One major reason I want to illustrate this is because within the next 1-2 daily candle closes the Total2 (aka altcoin market) chart is going to have its golden cross and it is currently trying to confirm the breakout upward from a cp and handle pattern which is a huge fulcrum point for it. So should the trend of instantaneous golden cross pump effects occurring the same daily candle as the cross itself, this could clue us into exactly when the real full on alt season will be about to kick off (which if correct, will be ignited by a big confirmation breakout pump within the next 1-3 daily candles). *not financial advice*