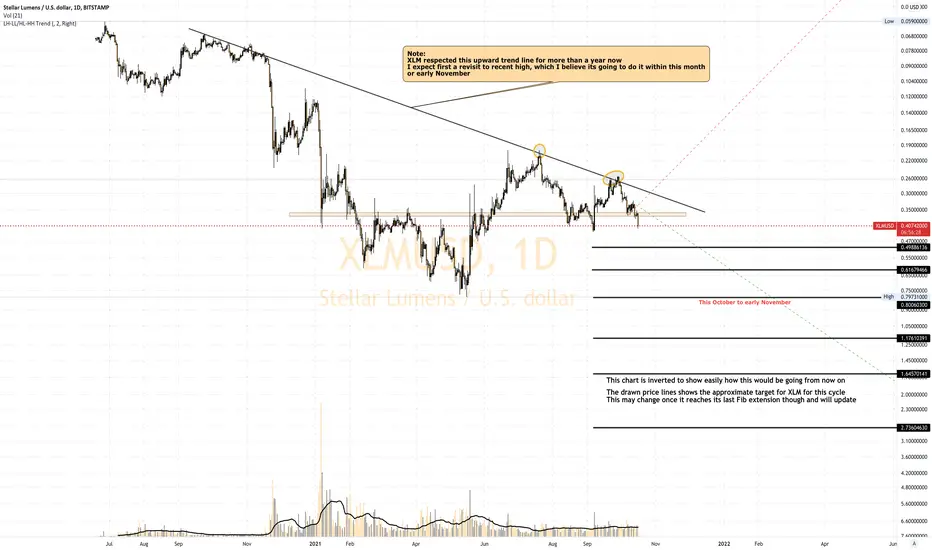
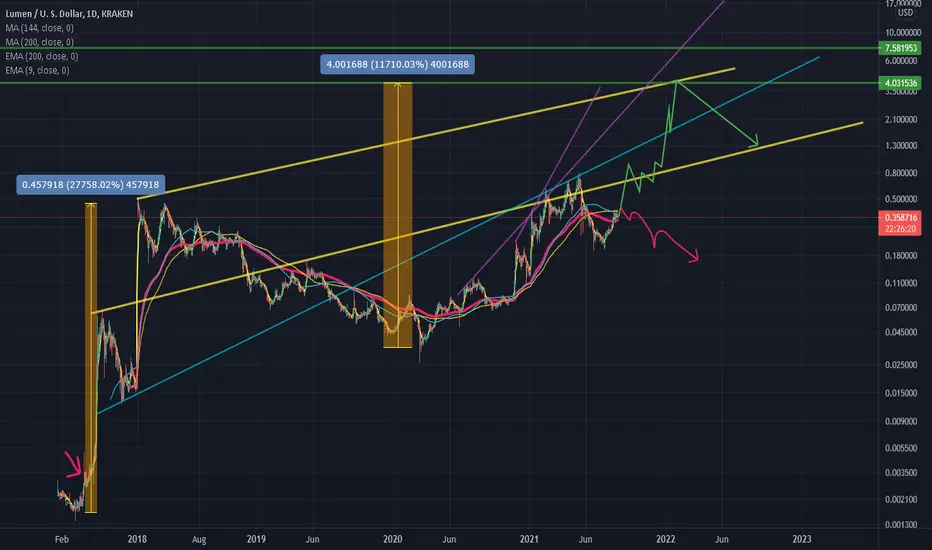
My take on Stellar Lumens (XLM) Price predictionAs a holder of XLM, I have set my targets from mid 2020 after the March crash due to C-19 assuming it was the bottom, bought it October 2020.
This is my take on its price and current situation which I believe its going up in the price from now, the only condition I see a dip if the B wave of BTC finishes soon and C wave takes it lower from the 60-68K in which XLM and the other assets will go hard with it. but I think its unlikely now IMO
Fundamentally XLM is solid project and positive for price action to the upside. Technically once it breaks 0.47$, I don't see any thing can stop it from continuation except for the BTC condition mentioned above
Stellarlumens
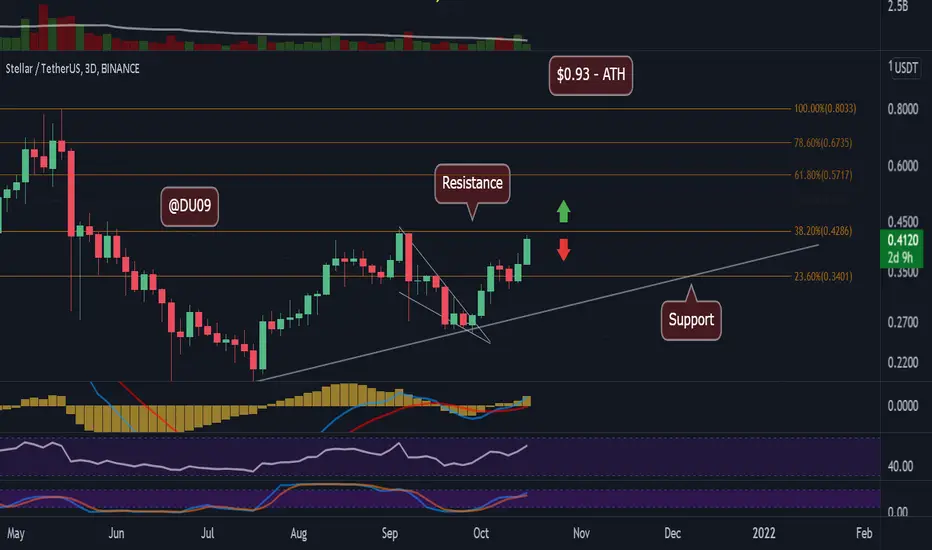
XLM/USD - Is Stellar waking up? Stellar day may lead to rally!Stellar Lumens pumped today with a lovely green candle on the daily which has now pushed us right below a major resistance line at $0.42 cents.
The indicators seem primed to take us much higher and break above this key resistance. Can XLM do it?
My bet is on the bulls, as the overall market is heating up. BTC and ETH are just about to break their own ATH... so XLM and the overall altcoin market will start to heat up.
Just a matter of time. If you look for an entry, get in when XLM makes the $0.42 resistance support and ride the pump to $1... which is our current ATH for XLM.
Like and follow if you liked this idea!
XLM looks good on daily for now!Stellar $XLM (Idea)
Timeframe: Daily
Adam and eve pattern ? Or Cup and handle?
Anyways let's see if this works or not.

XLM waiting for big growthXLM is one of those cryptocurrencies which are quiet but which are appreciated by influential lobbies in several countries, they cooperate with the biggest ones and develop very well, I think for a LONG time, it is one of the best investments

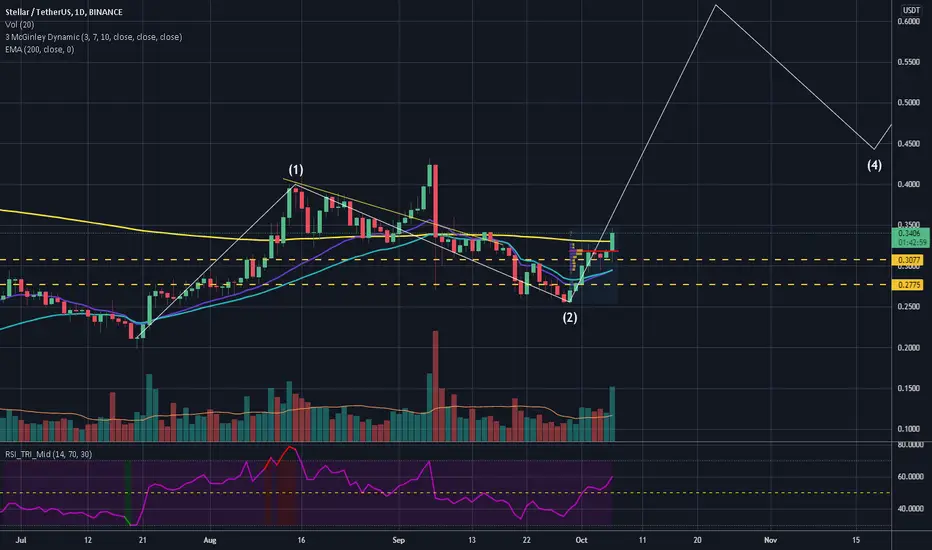
XLM support heldI had pubblished (I think) this idea I had for XLM, basically an elliot wave, however I changed the bottom of wave 2 various time during the weeks because, as you can see it broke down two supports. Currewnt bounce was on the 0.786 Fib line though so, it ok.
SMI shows a bearish DIV (not shown here) however you can see the EMA 200 being pierced by price at daily time frame. Off course this means that at 4h price is already over EMA 200 (finally). Combined with VLPR control line being at the base of current candlestick, but more importantly, with the daily candle of the 4th of October which clearly bounced on my support I feel confident that XLM has tested this support and it holds.
From now on I expect a rise of XLM price... after all it hasn't delivered much, even in Q1 it had one great pump and stopped.
I think that if you wanna enter, now it's a good moment, use that support as stop loss. When XLM starts pumping it's like XRP, it moon very quickly.
Good luck
XLM -Stellar You old dog. You tricked me. Will Jed save the day?XLM -Stellar You old dog. You tricked me. Will Jed save the day?
Old idea was complete failure. Seemed poised for historical fractal rocket boost pump... but then exploded on the launchpad.
Sucks as I should have just gone for new popular tokens like blah blah blah
I still have my eye on this old dog though. Similar to NANO I think it will unexpectedly go right back to about rank #6 in a couple explosive moves. Timing it though...
If it starts running up I will fomo.
glhf

XLM range tradingThird time XLM/BTC is touching the bottom of this channel it is trading in since mid-june. It took a while after the first touch, namely a second touch, but after that we got a nice 25% move up. This seems an interesting opportunity.
I'm not counting the third as that wick is definitely false price action or maybe even a shake-out. Anyway, setting a stop loss below the previous low and my target at 20%. Let's see how this goes!

XLM is being pressured to the MAXXLM/USDT is currently holding a long term support line in the uprising channel. It can drop with a wick to 0.26 and still be OK. However, breaking and closing below 0.26 is bearish.
In my view, now is a good time and price to start accumulate for targets above $2.
Also, remember that RSI is leading indicator. so watch for RSI break to be more confident.
Good Luck and Trade Smart.

LONG UNTIL PROVEN WRONGXLM looking good, reclaimed key area in lowertf, and currently consolidating above, I'm long aiming for those 3 objectives in chart, key supply block first, followed by FEB21 mid range and ATH mid range. Once we are there I will revaluate but those are pretty clear objectives for now.

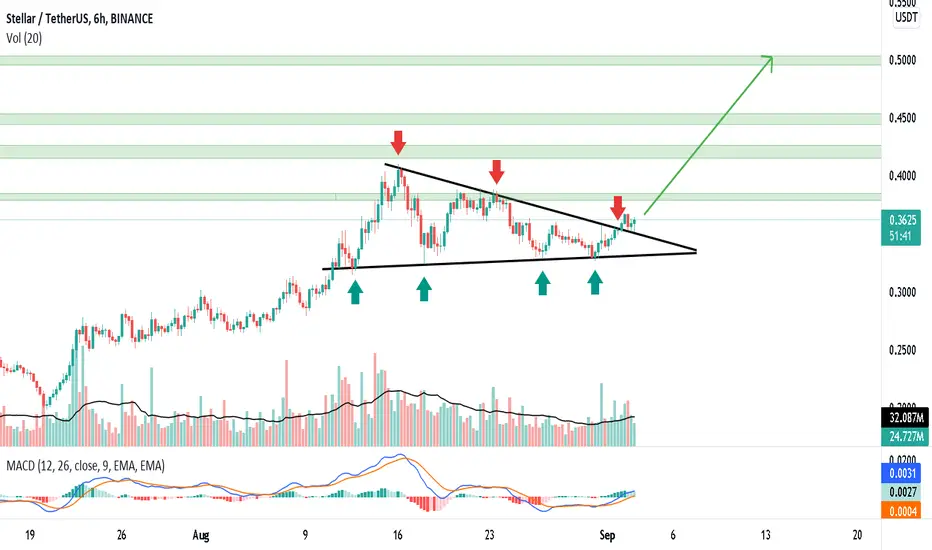
XLM IS FINALLY READY!XLM has broken out of this triangle and retested it to confirm an upcoming bullish wave. MACD is divergent and exploring higher grounds in the positive zone. However, volume is still insufficient. Possible targets are highlighted in green based on price action history. These designated areas are where the price has struggled to flip in the past. If the momentum picks up, XLM could easily take on these levels. This trade could chalk up a profit of around 36%.
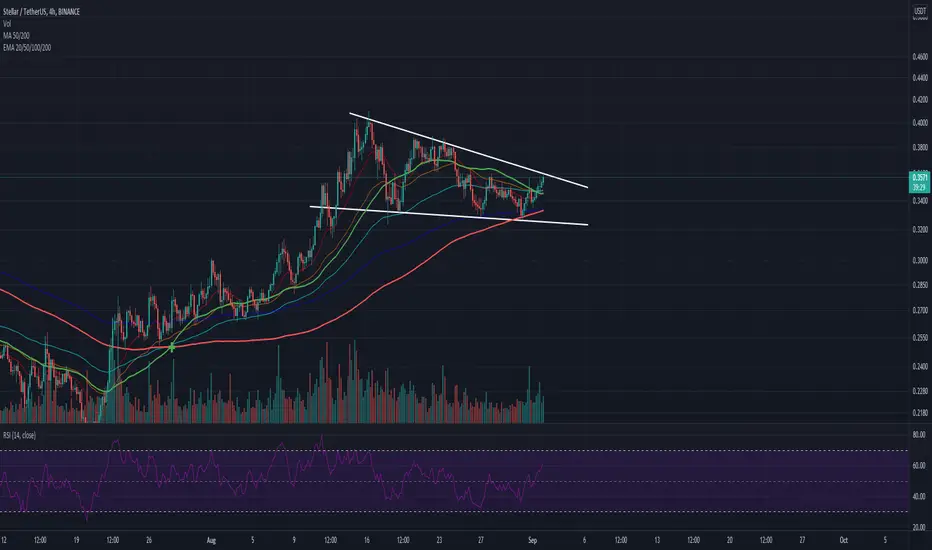
XLM testing resistance and could break out.XLM is testing long term resistance trendline, looking for some bigger volume to help break it and breakout.
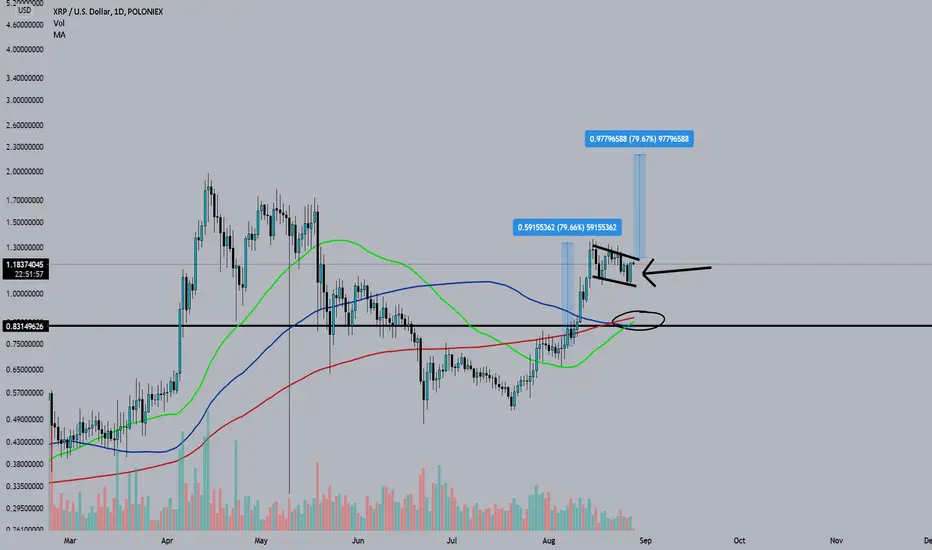
XRP Bull Flag Forming, Targeting $2.20 Short TermYes I know, in my previous post concerning XRP I discussed a bull pennant formation forming on XRP.
That pennant officially broke down instead of up, which is always possible in any triangle formation.
However, now we seem to be forming a bull flag, which is essentially the same end result when it comes to how to measure price targets from it.
If we get a breakout UPWARD from the bull flag, expect a price target of at least $2.20 short term.
I believe this will continue higher if achieved, as XRP will be surpassing its high on the year of right about $2.00 even.
Another thing to note, we also technically closed August 27th with a bullish engulfing candle as well, which will play in favor for a breakout.
If we break down instead, expect strong support around the $0.83-0.84 cent range.
ONCE AGAIN, unfortunately all of this will still depend on if BTC dumps.
The correlation still exists at the moment, but I bet we see a decoupling for most crypto within a few years.
The SEC lawsuit coming to a close will send this thing flying, so it is extremely risky to not be in, in my opinion!
- CA$HLESS
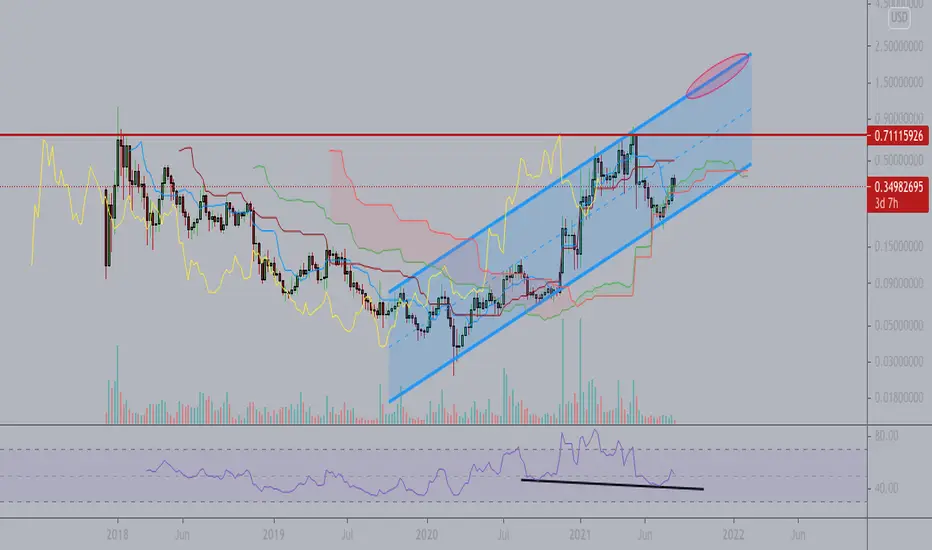
XLMUSD - 1W - Stellar in a huge channelHi guys,
Short review of Stellar (XLM) with a weelky TF.
We can notice Stellar is still evolving in his big ascending channel (blue).
We had several points of contact both at the top and at the bottom of the channel.
I'll be watching this one.
If BTC remains "calm" we can expect a further growth inside the channel.
First stop will be the former "double top" at 0.71$
After, i'll be watching for the top of the channel (red area ... depending on the time to achieve it)
Those are two zones of TP but if we broke the previous top, we could also see a kind of massive cup and handle that could send price to the moon.
Finally, RSI made a lower low while price made a higher low.
Like if you share this pov
NFA
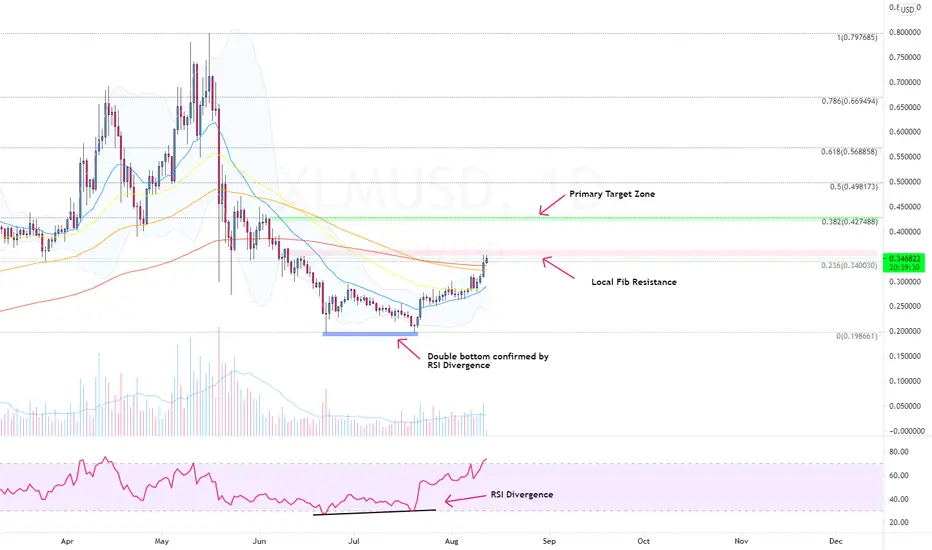
Up Up and Away?!?!? XLMUSDHello Trading View Community,
One thing to note is RSI going into overbought zone and although XLMUSD is over the 0.236 Fib Level, it still needs to clear the rest of the local resistance zone.
Thank you guys for checking out this idea on XLMUSD. If you find this analysis useful, support with a simple "Like" or "Follow".
Trade carefully and remember these are just ideas, not trading advise
XLM USD LONG TERM TRIALI know this is little complicated :))
Note: Above idea is for educational purpose only.

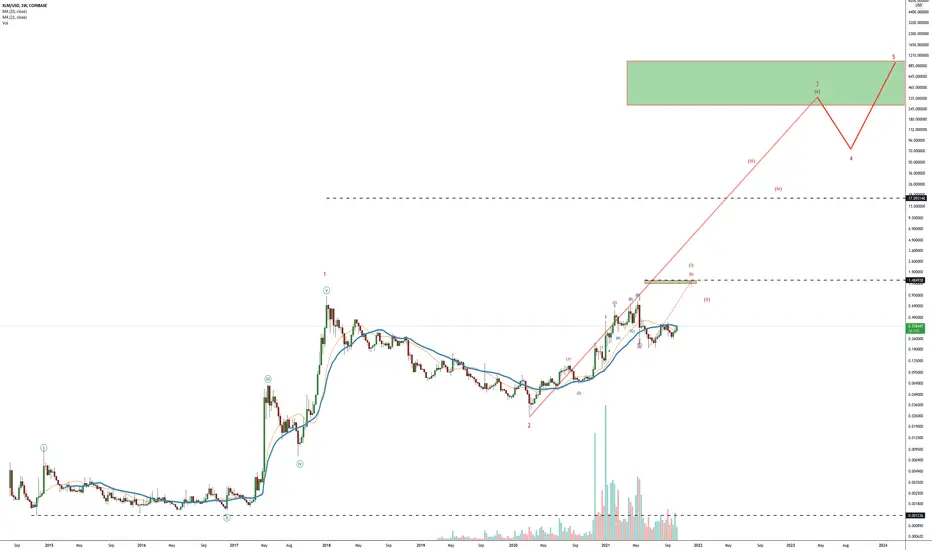
XLM Parabolic Curve to $0.37 + ?Parabolic curves have a high probability of success, and BTC has already used one to climb up to 42K +(see attached idea of prediction)
As the graph shows, XLM seems to be forming a parabolic curve pattern which would lead Stellar Lumens to $0.37

Cup and handle long entry $XLMAnother cup and handle xlm rising back up I think by end of September we will claim back the May level 0.80 and with Flare launch and money gram purchase can see stellar Lumens above 20$
Xlm - trade for Quick 23% gains Xlm bull flag is about to breakout.
Look for quick 23% gains incoming.

XLM Continues Testing Resistance: Big Uptrend ExpectedHey traders 👋
As the chart shows 📈 :
- XLM is testing Resistance again and again 🦾 , this means that buyers are propense to buying even near resistance → signal of buying strength
- It's also forming interesting patterns (see attached idea)
In my opinion, the best time to buy is near the short-term support(which in long-term is nearly the resistance area), I am expecting big uptrend in the following days/weeks

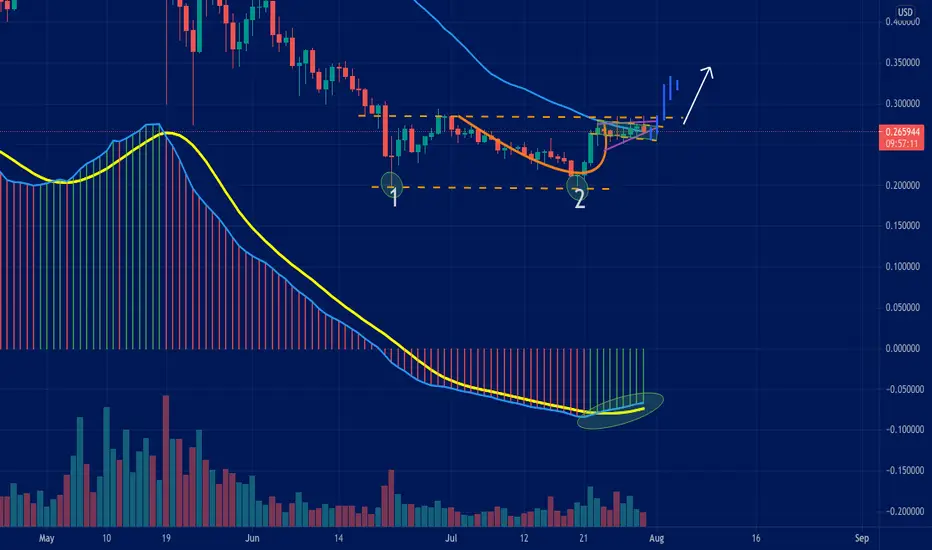
XLM double top + cup with handle (and flag) + MACD and SMAHey Traders,
XLM is looking bullish 🔥:
- Double Bottom
- Cup with Handle ☕️ (and a bullish flag)
- MACD crosses signal line 📡
- XLM beating 50day SMA resistance
I think it'll go to ~$0.35 📈
It also depends on how BTC is doing(see my attached idea)
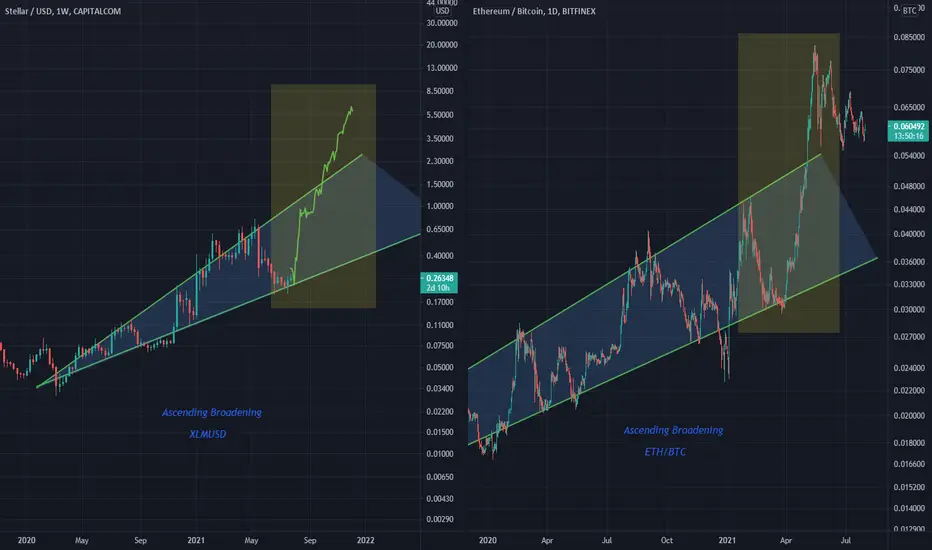
Ascending Broadening XLMUSD / ETHBTCAs seen on the ETHBTC chart this formation can break out bullishly
We can see the formation on XLM still within the wedge
Will it follow through and break out like ETH/BTC
We shall see through this post