Stellarlumens

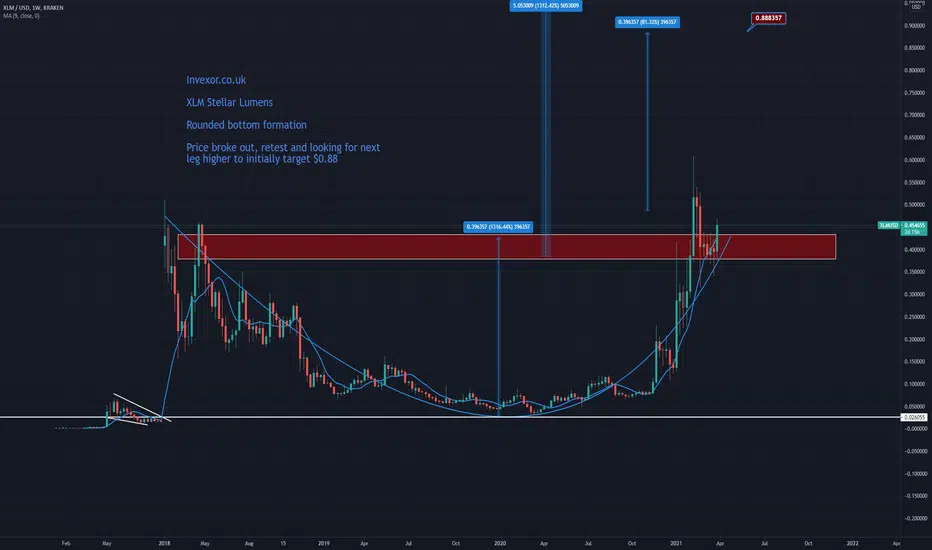
XLM rounded bottom breakout and retestPrice broke higher from this chart pattern, retest from above and now trying to push higher
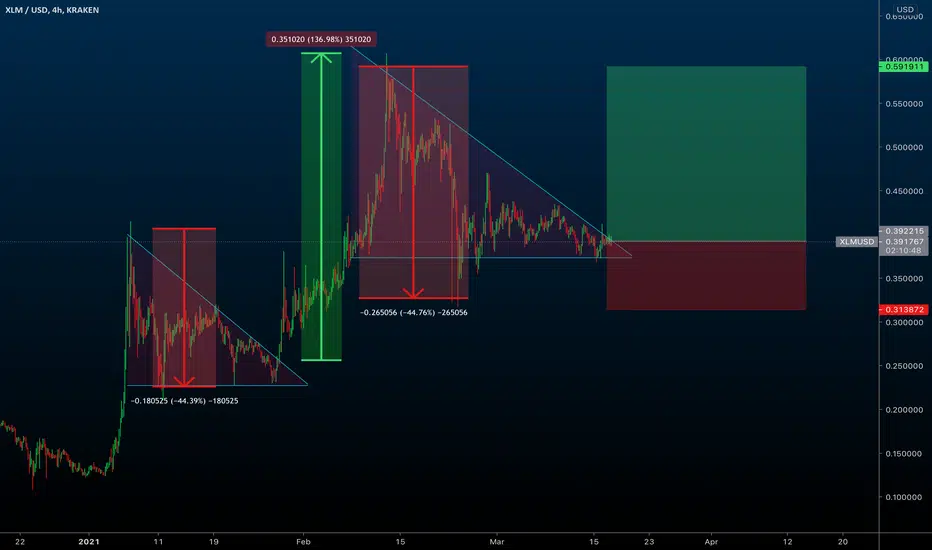
XLM 4H - Bullish scenario4H Chart - Bullish scenario for stellar
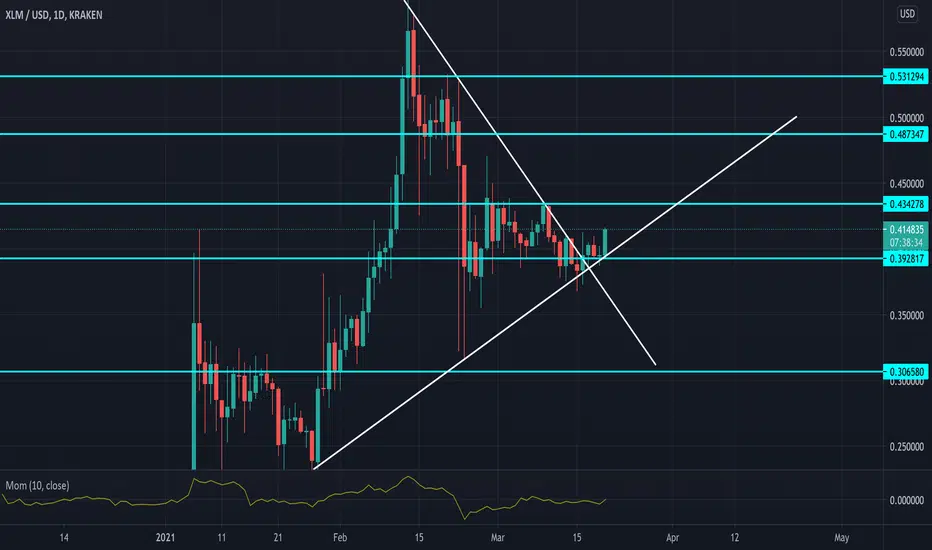
long consolidation for XLM after hit 0.60 Feb- XLM Need to Break Resistance levels to hit ATH again we have these resistance on the way up !
R1 - 0.42
R2 - 0.45
R3 - 0.53
Hope we see XLM back to game soon 🤑
My First Target for Stellar is about 0.58 or 0.61
Then go back to .48 and back up again for 0.71 or 0.81 , Let's See !
Don't forget to like and comment your targets for XLM !
I do not provide personal investment advice and I am not a qualified licensed investment advisor. I am an amateur investor and publishing my idea !

XLM about to break and its going to be great!XLM has been consolidating for far too long so looking for a big movement which is most likely upwards and hopefully its a x2 to 0.8$

STELLAR Preparing for new impulse?Hi everyone,
These couple of days we've seen a better performance of XRP and Stellar in comparison with BTC and ETH.
They seem to be getting hotter... XRP is leading now but I'm sure Stellar will follow.
Currently we're in an accumulation zone.
Positive fact: We're above the 200 MA (2H Graph).
Long term positive, short term neutral.
Luck!

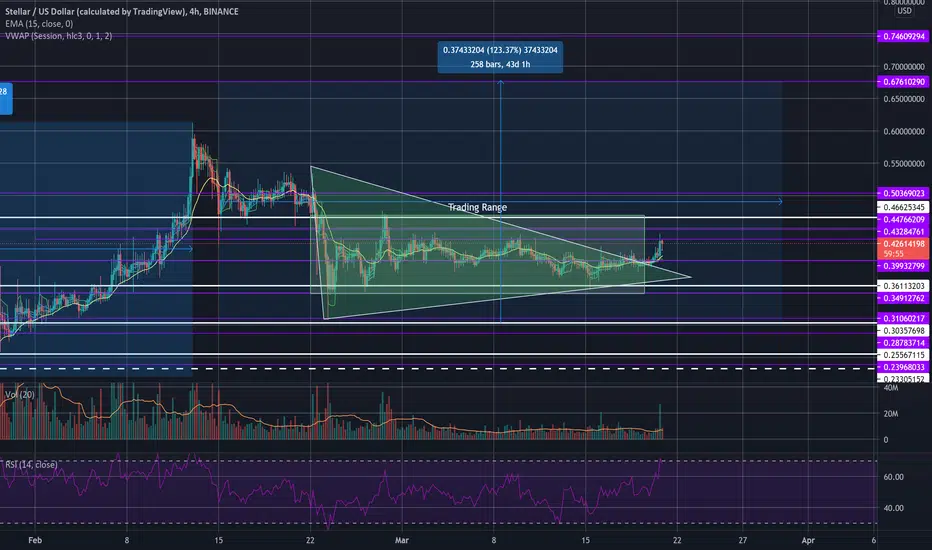
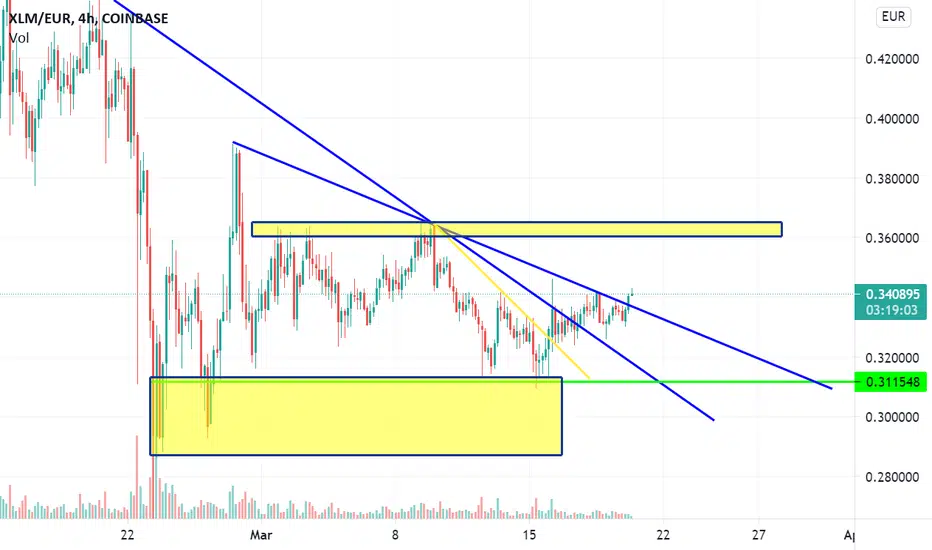
XLM with possible upwards breakoutAs described on my post from February 27th, 2021 the retest of support/resistance levels (weekly and monthly) is quite necessary.
There was a good opportunity of profittaking, as mentioned before (buying in at 0,36$ and selling at the monthly resistance level of 0,466$).
We are still within the trading range of 0,36$ and 0,466$. As the interest grows, we could see a second test of the monthly level (0,466$), which might even surpass other weekly and monthly resistance levels - especially since Stellar Lumens has recently introduced new features (Horizon 2.0 / Smart Contracts) and partnerships (fundamental news function as catalysts). The interest in XLM has an odd habit of jumping in an extreme way, so that a 100% increase over a day has happened before.
You can also see on the chart, apart from the trading range, that XLM was / is in a long phase of accumulation (almost a month) and the price has just moved out of a wedge (trend), which of course if fractal information.
As usual, this is no financial advice - just my opinion and to be fair, I am currently invested in #XLM, which does not mean that you should!
I always appreciate constructive critical feedback!
XLM Buy a break setup.XLMUSDT - Intraday - We look to Buy a break of 0.4152 (stop at 0.3966)
Daily signals are mildly bullish.
The primary trend remains bullish.
Pivot resistance is at 0.4133.
A break of 0.4133 is needed to confirm follow through bullish momentum.
Our outlook is bullish.
Our profit targets will be 0.4665 and 0.4940
Resistance: 0.4100 / 0.4350 / 0.4500
Support: 0.3900 / 0.3750 / 0.3600

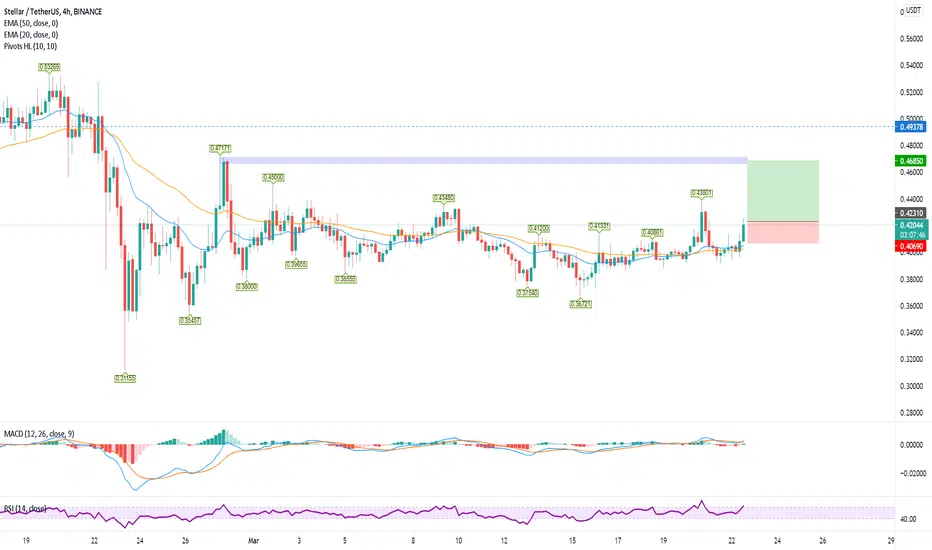
XLM Buy a break setup.XLMUSDT - Intraday - We look to Buy a break of 0.4231 (stop at 0.4069)
Daily signals are mildly bullish.
The primary trend remains bullish.
A break of 0.4300 is needed to confirm follow through bullish momentum.
Our outlook is bullish.
Short term oscillators have turned positive.
Our profit targets will be 0.4685 and 0.4912
Resistance: 0.4300 / 0.4500 / 0.4700
Support: 0.4000 / 0.3900 / 0.3750
Stellar & Bull FlagsHello! Today too much people ask me about Stellar! That's why I wanna share with you my vision on it! ♥️
Happy to present my chart👇
We can see, that price moving by bull flags and it's look wow! So pretty cool!😊
Let's look on a full history on 1 daily chart!🧐For me looks also promising🔥
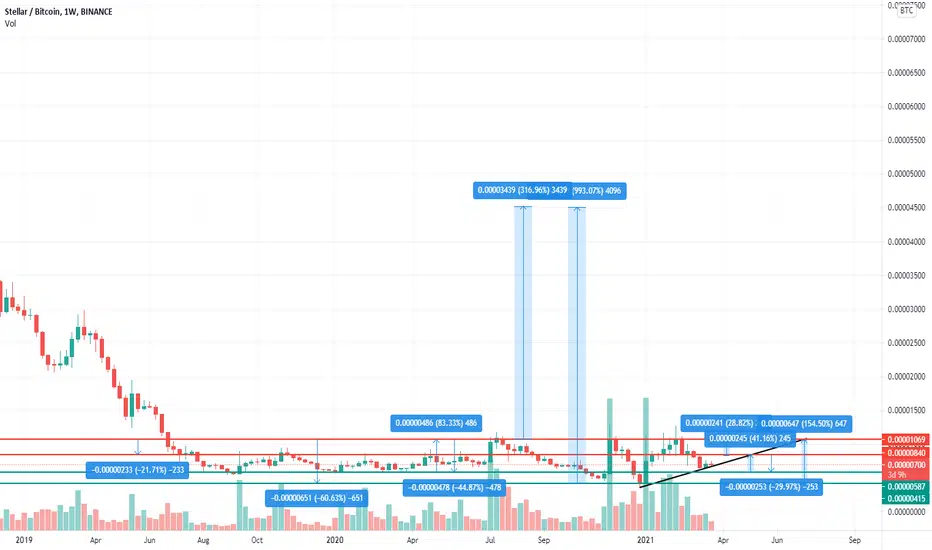
Also for better understanding the potential, we need to check out BTC pair of XLM!
Let's take a look, here 👇
There we can see, that we still in bottom, and it's good signal for further growth😉
Hope You liked my analysis ♥️
Stay tuned by Rocket Bomb 🚀💣

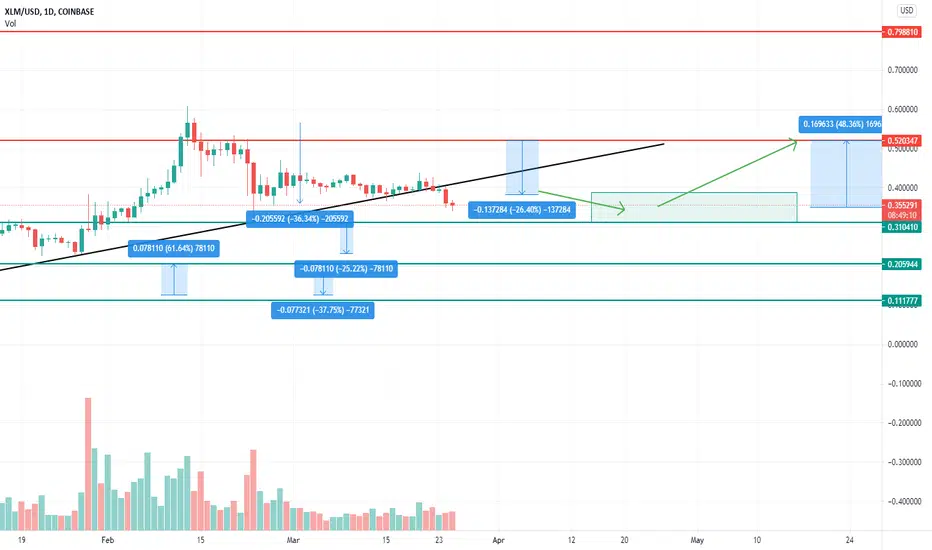
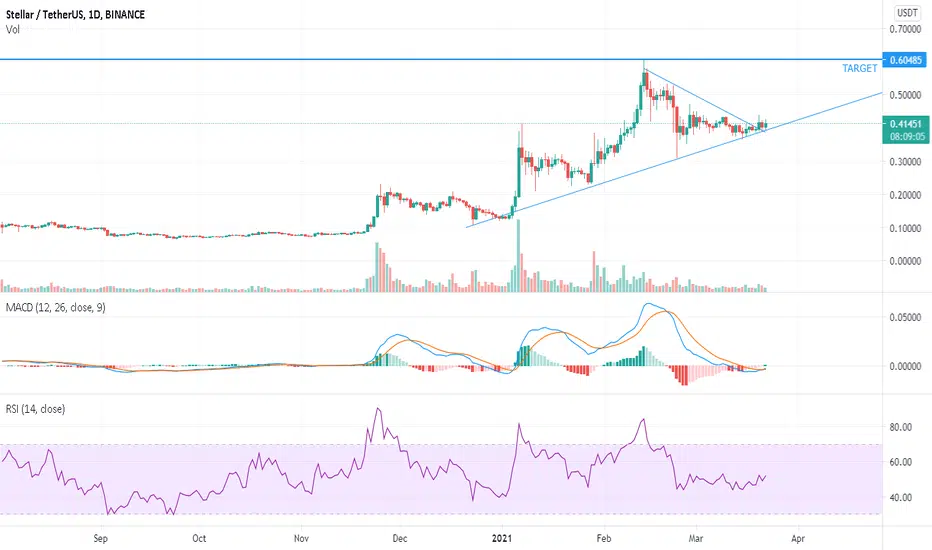
XLM +44% TARGET XLM has been a sleeping giant over the last couple of weeks, however the TA/FA on this is stacking up:
-recent daily break out of the diagonal overhead resistance
-bullish crossover on MACD
-XRP starting to move and these pair regularly move within quick succession of eachother
Look for an entry at day close if unchanged. Set your stop loss below the ascending diagonal support.
Expect this to move if bitcoin stays stable!
Good luck, and as always please give me a follow if you liked this content :)
Target 0.6
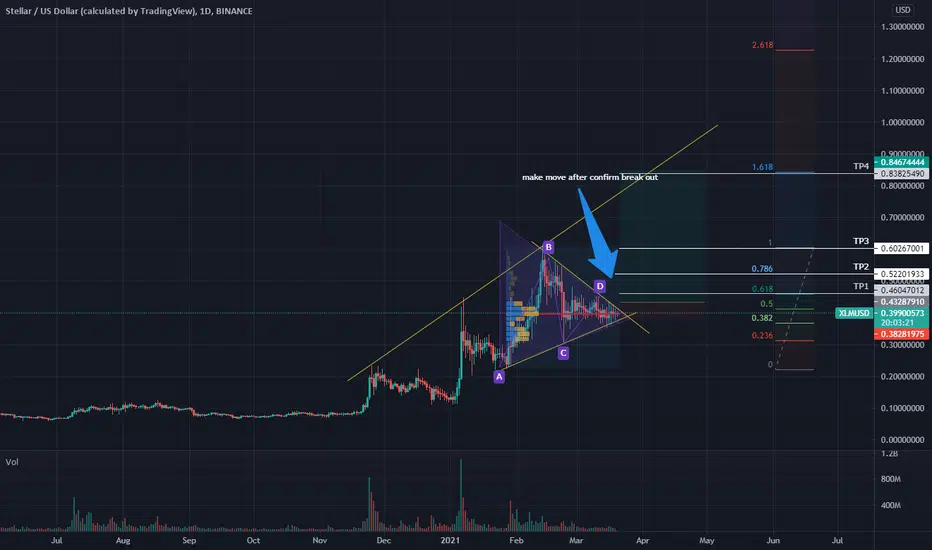
Stellar (XLM) Rejecting Prev ATH: Falling or Mooning? Before we long we need a confirmation of the 38% and the previous ATHm as support. Otherwise, wait for a retracement to the lower fib levels.
Thanks again Aqua Hydro Man for the suggestions!

XLM about to shootXLM has officially broken out and confirmed out of the pennant it has been stuck in. pat attention to these zones. expecting new highs soon. happy equinox!!
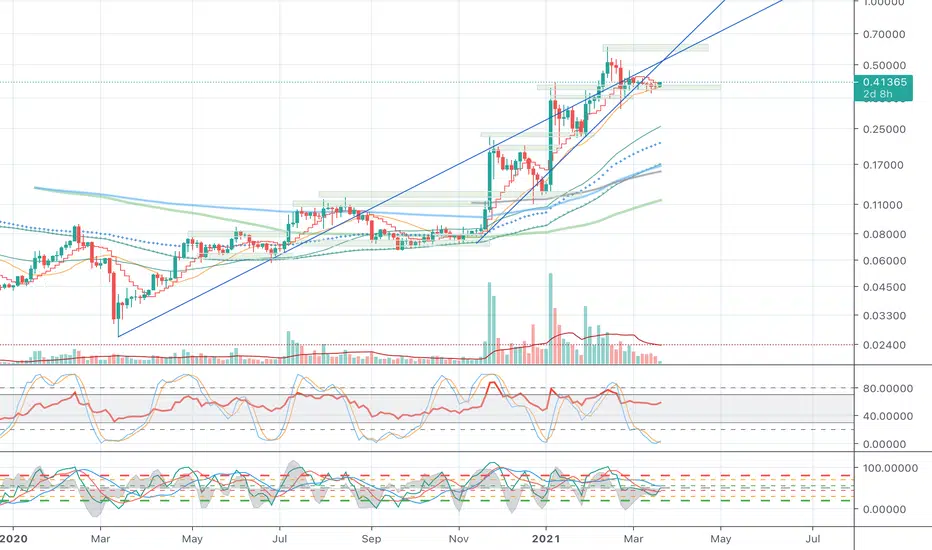
Next step up, StellarSome coins have distinct price behavior. The bullish action of Stellar Lumen (XLM) has so far followed a clear stepwise pattern. First there has been a strong impulse to a new higher high followed by a closing of the 3d-candle lower. That closing has formed a new resistance. Then there has been a gradual retracement to a new support that is formed at the peak of the previous impulse. That support has held each time in the past during this bull market.
Stellar has been sitting on its present support now for several weeks, and is showing signs of taking off for the next impulse. The previous impulses can give an indication for the potential extent of the impulse and the following retracement. The peak of the impulse could go as high as the 1.382 fib-extension, ranging between 1.236 and 1.382 extensions. The target could then be in the range of 0.78-0.91. The following retracement could find its new support at the level of 0.59-0.61 (present peak).
This all can happen if the history repeats itself. There is naturally no guarantee for that, and it remains to be seen how things work out. Best is to be reactive to any actual outcome.
Trade safe and take care.
Cheers
Whoop
XLM - Is the bull run starting?Hi guys! We can see XLM has been stagned for the past few days, but that just how XLM moves: stagnates for a month/month and a half and then comes a big bull run.
Technical analysis and fundamentals seems to be in the right direction for XLM! Great project for a long term investment.
What do you guys think?
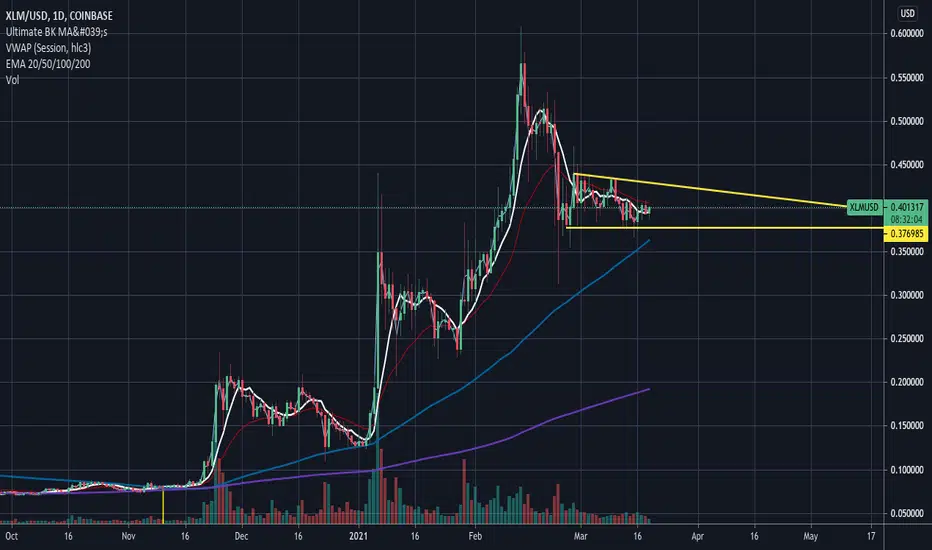
Bottom in and wedge tightening $XLM #stellar #lumensThis looks bullish to me. We are tighening the wedge pattern and found a bottom. Big move up imminent IMO.
STELLAR/XLM - sideways movement Stellar is going nicely sideways which is specific for an accumulation. Obviously it is happening there. I would buy some bags of it before it jumps out.

XLM looking good now - Reverse Pump back to $0.60 US levelThis is not investment advise, educational purpose for your own learning
Do as you please with your money based on this analysis. You should handle your own risk management in a sound way.
Always assume this analysis could be wrong first, it drops and than moves up and up
This is a 12 hour chart
Stellar Lumens looking very good, hint of volumes moving pass the 34 day moving average, slightly but enough for a reverse pump.
Stellar Lumens is a sleeping giant, should hold some for long term investments
If trading this for the $0.60 US target reverse pump their also a possible break out to the next fib level $0.836 US target
Stoch momentum W shape is also a good sign. We have three good signals - movement most likely up and soon

XLM Buy a break setup.XLMUSDT - Intraday - We look to Buy a break of 0.4152 (stop at 0.3966)
Daily signals are mildly bullish.
Pivot resistance is at 0.4120.
A break of 0.4120 is needed to confirm follow through bullish momentum.
The primary trend remains bullish.
Our profit targets will be 0.4665 and 0.4886
Resistance: 0.4120 / 0.4350 / 0.4700
Support: 0.3880 / 0.3800 / 0.3560

