STELLAR - I guess we picked the right onesSTELLAR XLX proving to be the right choice as one of the 2 favorite alternatives (with Cardano, same category).
Allow me to repeat the fundamentals one more time :
The chart is beautiful. Still far away from it's all time highs but showing a less volatile uptrend movement.
Fundamentally, what my research has revealed is that STELLAR is very close to the 'Big boys'. Both the IMF (International Monetary Fund) and the Federal Reserve are close to Stellar and keep inviting it in their CBDC ( Central Bank Digital Currency) discussion panels.
Could this non-profit organization become the pillar of Central Bank Digital Currencies? Possibly yes, so keep a close eye on it.
Stellar is now definitely in my radar and I have already invested in it, recently.
ps. Now there are about 50 billion lumens, total, in existence, and no more lumens will be created. Nearly 20 billion lumens are out in the open market, and the Stellar Development Foundation retains the other 30 billion or so to develop and promote Stellar , per its mandate. Fundamentally, this is another 'plus'
Stellarlumens

XLM Stellar Lumens About to possibly breakout. XLM Stellar Lumens About to possibly breakout. Breaking back above resistance COINBASE:XLMUSD levels looks ready to fly.

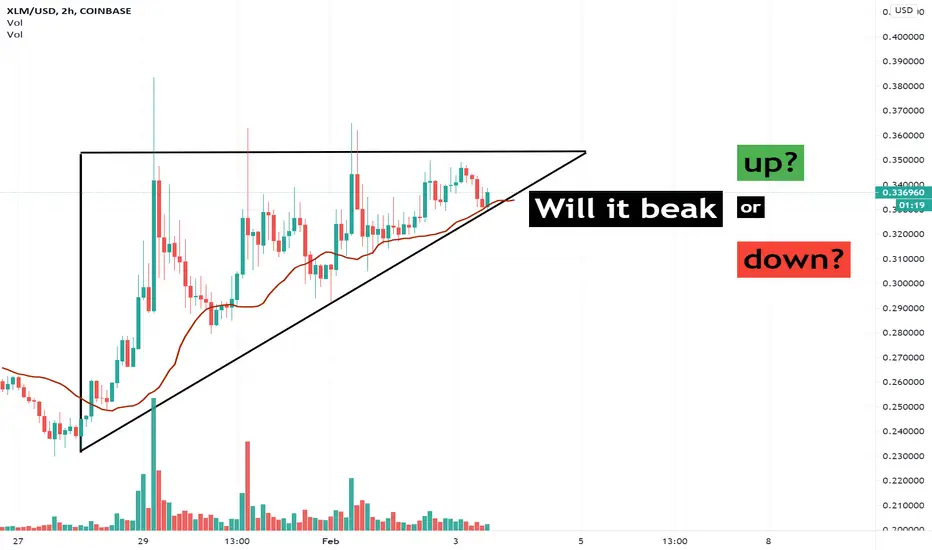
XLM/USDT▶️ Stellar - 2 patterns formed within one global 🔸XLM/USDT ▶️ There are 2 patterns formed within one global
We see the reaction of the buyer. The asset price is moving towards the resistance level. I expect impulse growth in the near future. ❗️ Look for entry points according to your trading system. ❗️ 📈 Friends to all profits. 📊
Also for the given coin, a lot of good news, where Circle - launches USDC - on the Stellar network.
I expect Good growth not only on the news background, but also on cluster analysis - a large volume is collected in this triangle.
The first target is the percentage between the levels of the triangle - after reaching this mark - just move the stop gradually up.

Stellar to $0.50!XLM is in bullish channel looking for a breakout to the upside.
Set an alert to a break of $0.37 and jump on and take profit slightly below $0.50. I am already in this trade.
Good luck!

$XLMUSD - Breakout from triangle & Circle integration confirmedHi guys! 👋🏻
🔔 Stellar and Circle have completed the minting of USDC on Stellar, making USDC stablecoin integration into Stellar blockchain. The USDC (US Dollar Coin) a stablecoin developed by Circle Internet Financial and backed by Coinbase, has $6 billion coins in circulation.
🔔 The circulation of the USDC has doubled since December after a global payment provider Visa has announced that it will add USDC for its 60 million merchants. Circle CEO and founder Jeremy Allaire praised Stellar and said that Stellar is designed for payments.
🔔 Migrating USDC from Ethereum network to Stellar will significantly improve transaction speed and decrease fees.
🔔 Stellar-native token Lumens has reacted to the news and with this major partnership and update, Lumens now looks as one of the most promising altcoins.
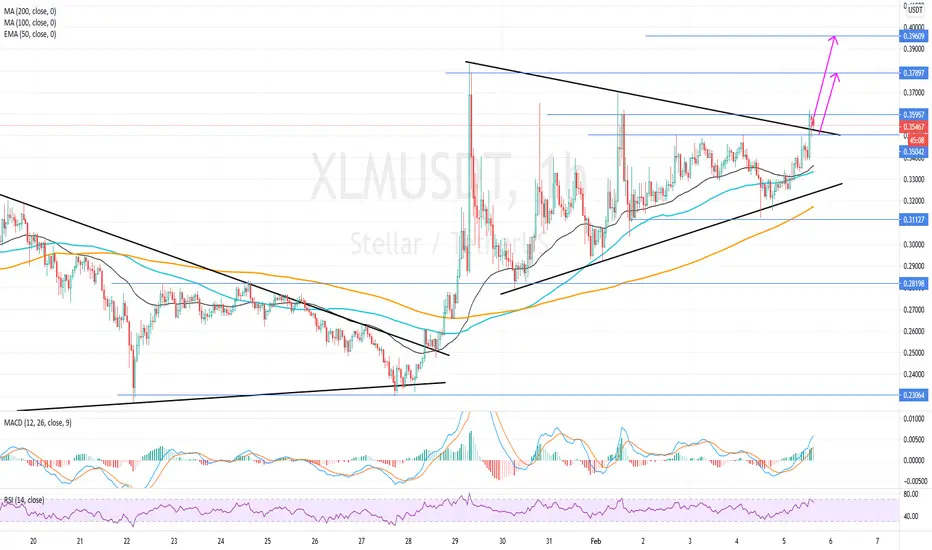
🔔 Lumens against the USD is one of the altcoins that occasionally forms large triangles and most of the time, these triangles signal the upcoming uptrend of the pair. The all-time-high of XLM/USD was sealed on January 7 at $0.41194 and to reach this level XLM has to close above the current resistance of $0.36000.
🔔 Currently the pair is testing the upper edge of the triangle as support, and is a good sign of the uptrend continuation, however to firm this, one should wait for a breakout of the weekly high. If the breakout is confirmed, XLM will continue the uptrend to test $0.37897 and $0.39600.
🔔 Lumens tested the dynamic resistance as support, tested the 0.35000 resistance as support and is about to break 0.36000 to go higher.
✊🏻 Good luck with your trades! ✊🏻
If you like the idea hit the 👍🏻 button, follow me for more ideas.
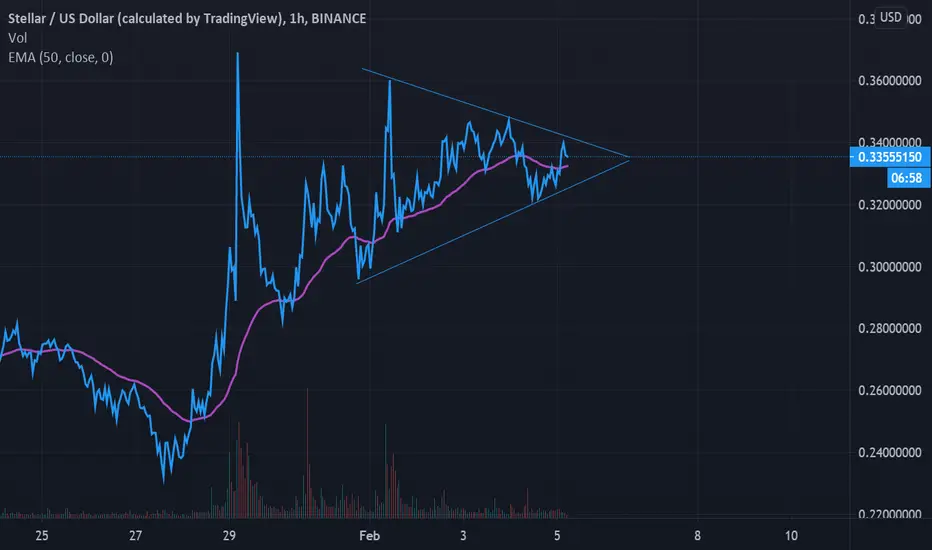
XLM Looking bullishUsing trend analysis, you can see how XLM support/resistances have created an almost perfect pennant; and one that looks to be quite bullish. We wait and see.
xlmusdtstellar lumans is a well known crypto sister of ripple working with likes of BOE there is some strong potential behind this
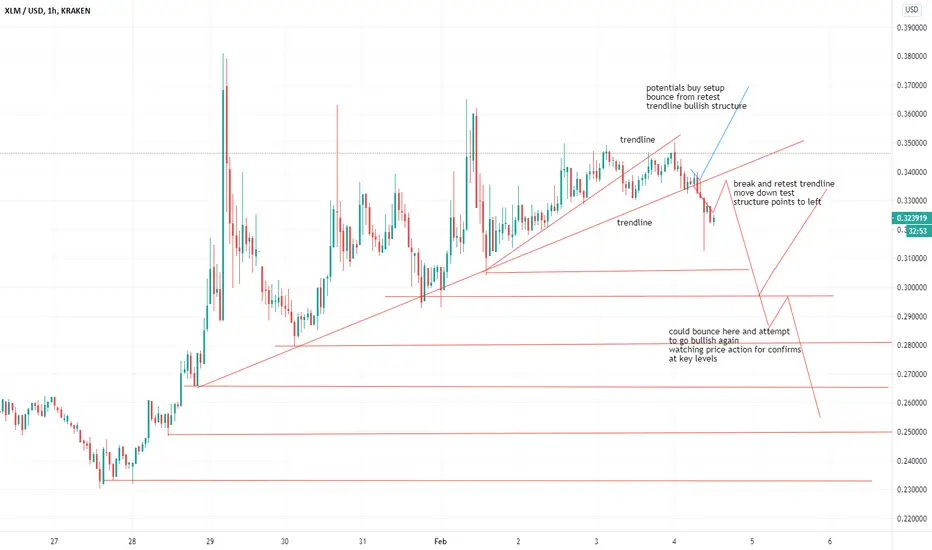
my idea has started to play out already forgot to post last night
the break out of the bullish trendline can leave a retest of structure points at the start of the bullish channel that took the move up
levels to watch on the down side are
0.30
0.28
0.265
0.25
0.23
under 23 there is a high chance we turn bearish and test lower structure on HTF around 0.08
XLM/USDT BUY SIGNALStellar had a nice rally and the current correction could be an interesting point for buyers, considering that EMA got rejected just now.
Stellar XLMUSDT - Rising wedge + Triangle (Target for next wave)- The price is forming a rising wedge (bearish pattern) on the daily chart.
- We can set our profit target at the top of the wedge for perfect exit or 1:1 fib extension.
- Expected duration of the trade, Stop Loss, Profit Target, Entry Price and Risk To Reward Ratio - for more information, please check my signature down below ↓
- A small local symmetrical triangle should breaks up very soon.
- Hit "Like" & "Follow". Don't miss upcoming updates and new ideas!

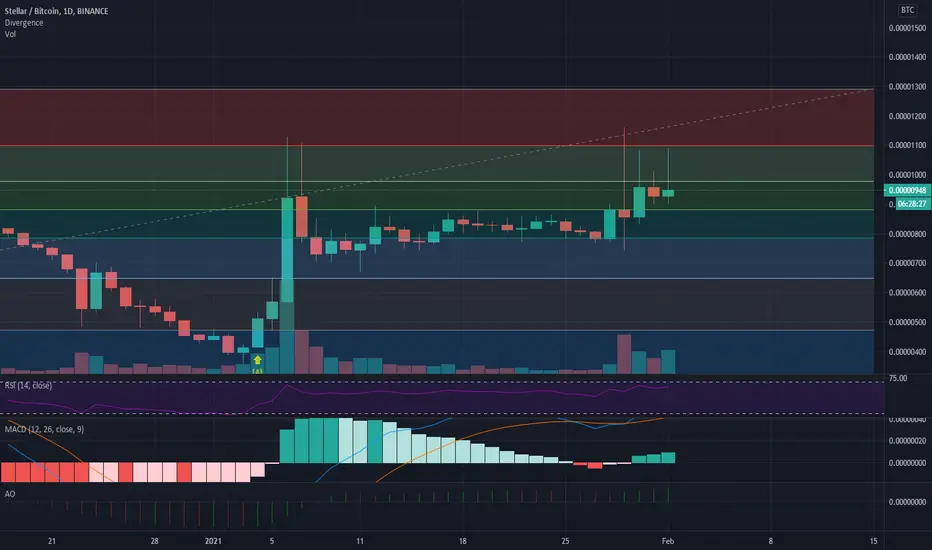
XLM - Ascending TriangleTaking a closer look at XLM, the 1H is looking great. We are currently in an ascending channel with a great chance of breaking above resistance around 990 sats. Currently still sitting on our 940 entry for the other chart, I can see us hitting 990 sats within the next 24 hours. From there the targets are still 990 - 1,100 - 1,300. Good luck my fellow traders!

XLM - One More RunLooking at the daily chart on XLM/BTC, it looks like we have one more good run left in us. I am making a risk trade to ride this for a good 10-20% profit since the data looks good. Doing a fib retracement of the last pump I am setting my targets at those levels of 980 - 1,100 - 1,300 sats. I will be entering here at 940 sats. Setting a stop loss at 915 - a close one in case there is a crash due to Bitcoin's current volatile movement. Good luck traders!
XLM is doing incredibly wellWarning: our thoughts are ours and ours alone; not financial advice.
We made a #XLM call when it was about 23 cents. The coin is doing quite nicely, now trading around 34 cents.
It's got more space to the upside of the channel to explore.
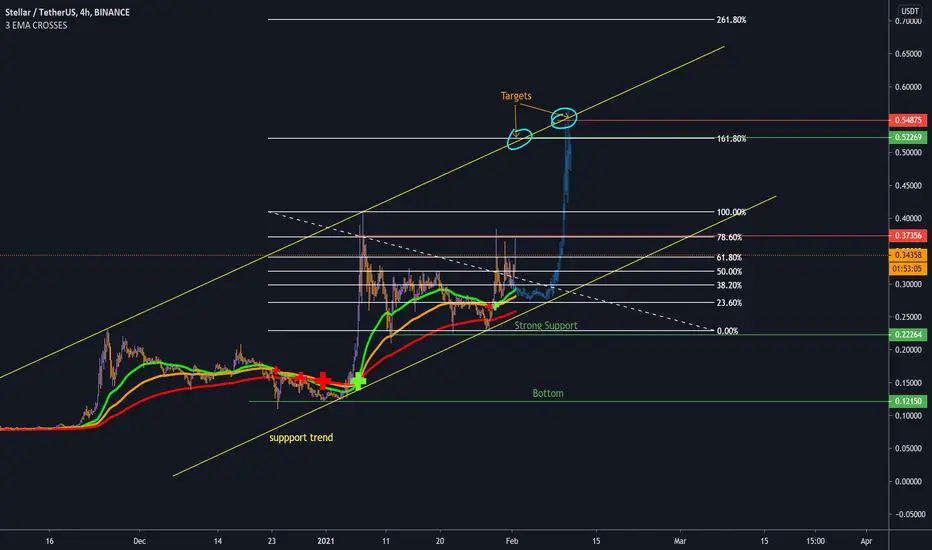
XLM on the riseAll in graph. i updated a bit my last analyse as i detected a trend, but we need more confirmations to validate it ( i like more to get 3 points to validate a trend).
So according to Fibo target should be 0.5$, unchanged from my last analyse. As i always say, don't forget to keep an eye on BTC King movements, as it drives strongly alts prices!
now according to this trend :
-Target if we push now 0.52$
-Target if we have delay 0.55$
- Strong support 0.22$
- Bottom 2020 0.10$
i will add in comments all my last XLM charts.
Be Wisely & Happy Tr4Ding !
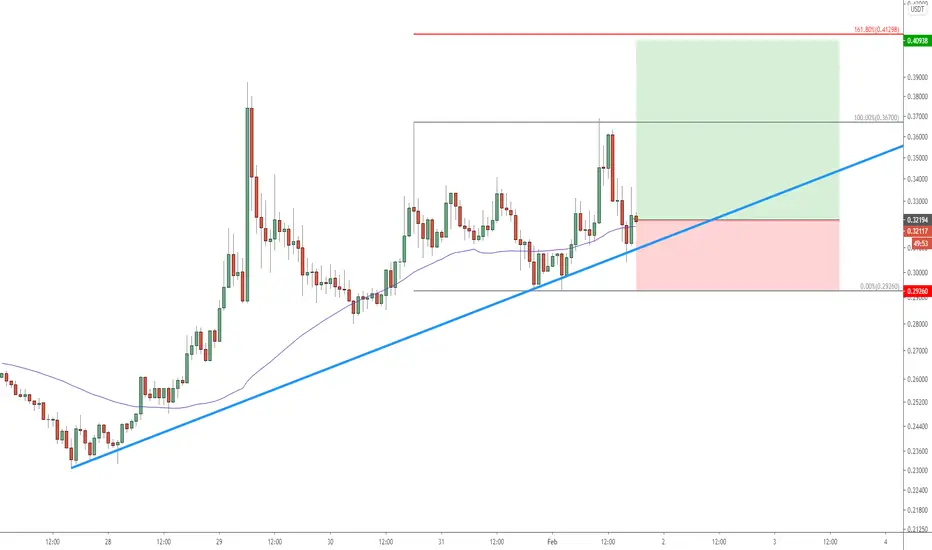
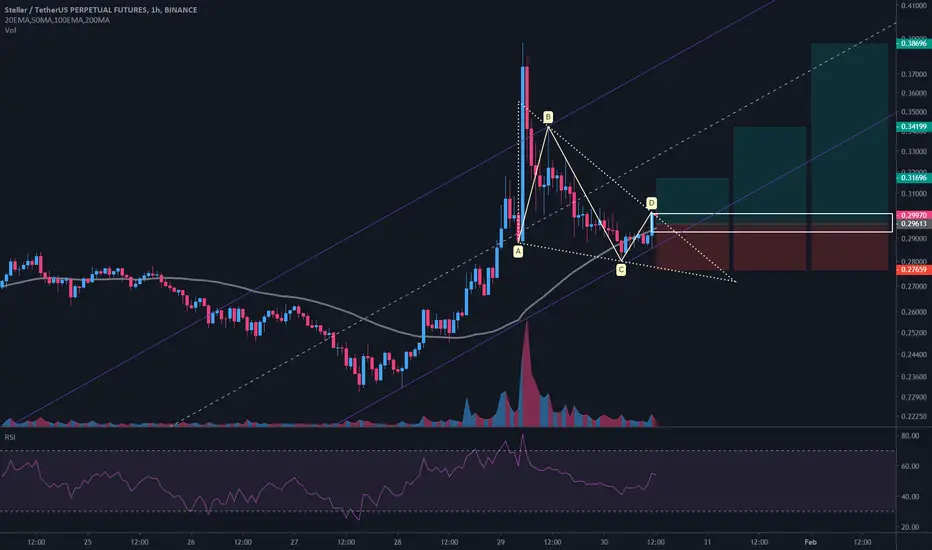
$XLM/USDT 1h (Binance Futures) Falling wedge breakoutStellar Lumens is hyped and I expect another push up short-term.
Current Price= 0.29970
Buy Entry= 0.30046 - 0.29246
Take Profit= 0.31696 | 0.34199 | 0.38696
Stop Loss= 0.27659
Risk/Reward= 1:1.07 | 1:2.35 | 1:4.65
Expected Profit= +14.06% | +30.98% | +61.34%
Possible Loss= -13.20%
Fib. Retracement= 0.382 | 0.618 | 1
Margin Leverage= 2x
Estimated Gain-time= 120h
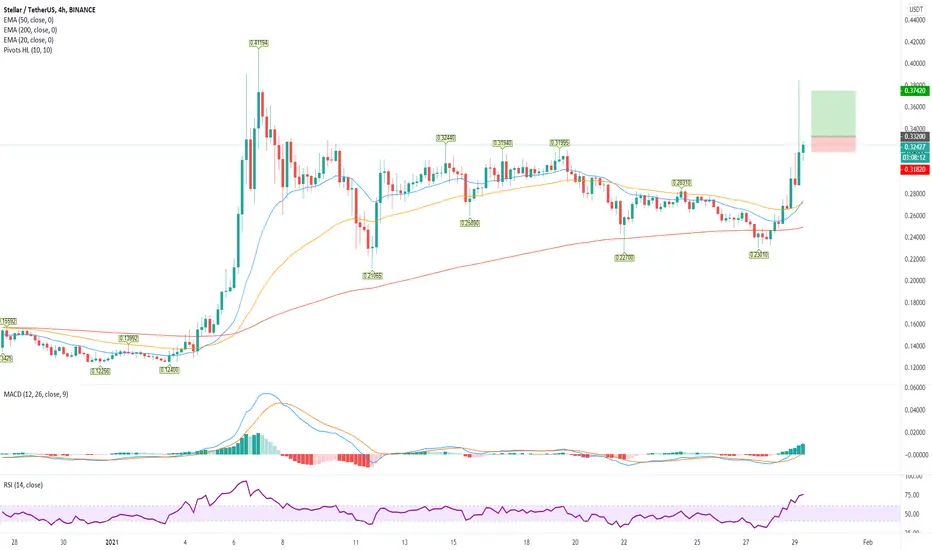
XLM Buy a break setup.Stellar - Intraday - We look to Buy a break of 0.3320 (stop at 0.3182)
Daily signals are bullish.
We look for gains to be extended today.
Our outlook is bullish.
We can see no technical reason for a change of trend.
A break of bespoke resistance at 0.3300, and the move higher is already underway.
Our profit targets will be 0.3742 and 0.3948
Resistance: 0.3300 / 0.3500 / 0.3750
Support: 0.3200 / 0.3000 / 0.2800
Price Acrion of Stellar (XLM)Stellar lumens 6.1.2021. had the highest value in the last two years. Since then, price movements have formed a triangle pattern. The price broke the pattern formed yesterday at $ 0.267. The price has gone up to $ 0.38 and since than has been on a downward trajectory. The decline stopped on the previous support and resistance line.
It is expected that the price will increase from this value, since the triangle pattern was broken, which was formed more than 20 days ago.

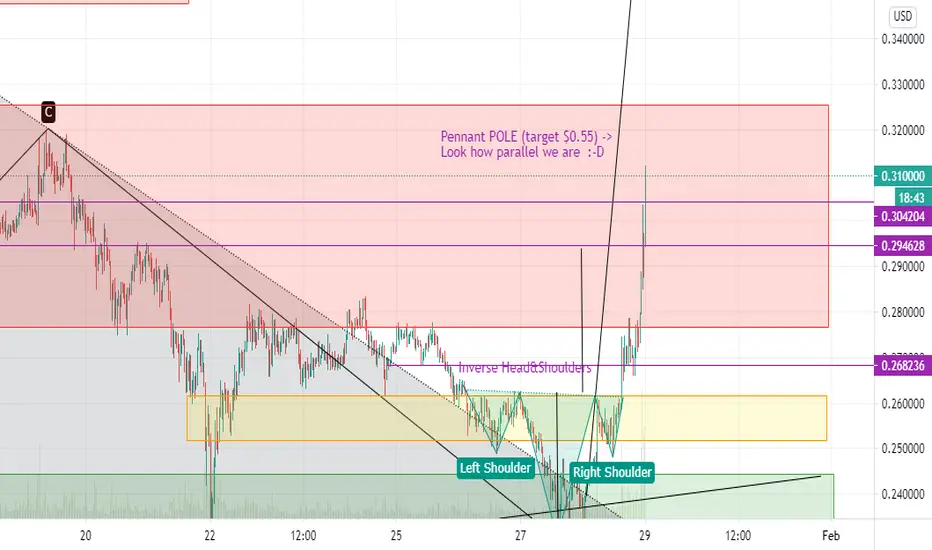
Just to confirm: XLM $.50 before Feb?Check related ideas first.
Summing up:
--> Pennant confirmed.
--> Inverse Head& Shoulders on bottom of pennant.
--> Volume is coming...
Amazing this XLM.
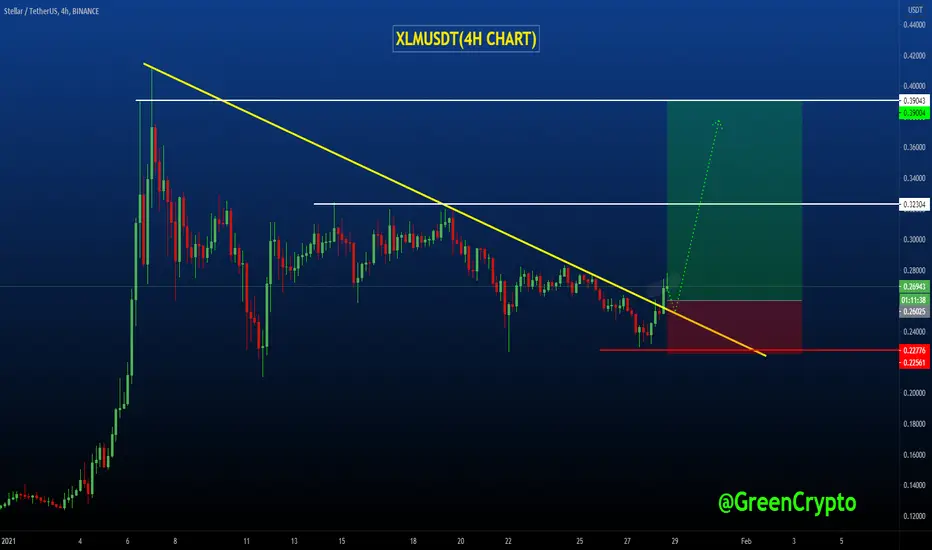
XLMUSDT (stellar) XLMUSDT (4H CHART) Technical Analysis Update
Trend line Breakout
XLM/USDT currently trading at $0.27
Buy-level: 0.255 - 0.270
Stop loss: below 0.224
Resisace Level 1(Target 1) : $0.320
Resistance level 2(Target 2) : $0.390
Max Leverage: 2X
ALWAYS KEEP STOP LOSS...
Follow our Tradingview Account for more Technical Analysis Update, | Like, Share and comment your thoughts.
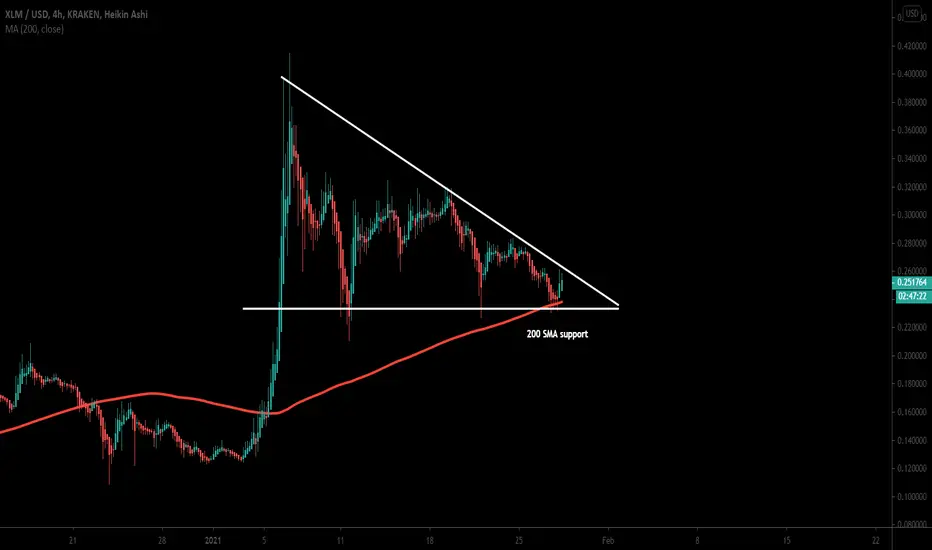
XLMUSD another bullish reversal move expectedHey friends, hope you are well, and welcome to the new update on Stellar con.
Descending triangle:
On the small-time period 4-hour chart, the price action of the XLM coin has formed a descending triangle. The priceline is re-testing the support of this triangle and the 200 simple moving average support as well. If the candlesticks will be bounced from here then it can make another attempt to break out the resistance of this pattern or in case of break down the support the priceline can drop to $0.20 level.
Gartley move:
On the two-day time period chart, the price action of Stellar has completed a harmonic bullish Gartley pattern and entered in the potential reversal zone. At the same time, it is also re-testing the exponential moving averages with the time period of 10 and 21 as support. Before this Gartley move, we can observe that the priceline of XLM formed a bullish BAT as well.
Conclusion:
During the current bearish move, the price action has formed another bullish reversal that can start a move to the upside for a short and mid-term.
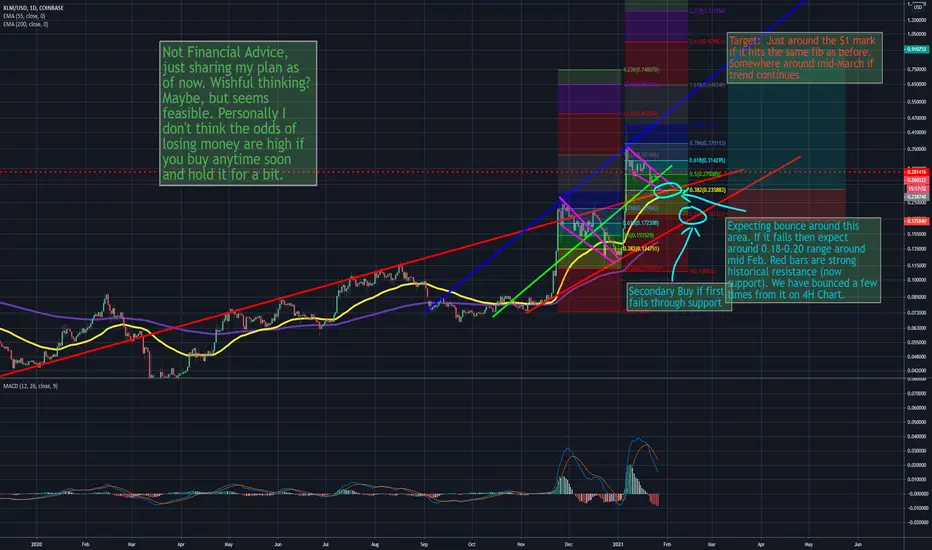
XLM/USD (My Game Plan with a bit of a ramble attached)I've been watching XLM for a few years now and was fortunate enough to buy back in around $0.05. I said I was going to hold until a buck minimum, but I sold to try to accumulate more coins and lock in profits. Admittedly I rode it down a bit when I should have sold to maximize profits, but some profits are better than none. Anyway, I'm no pro and I've been right some times and wrong at times in the past few years as we all have I'm sure. Due to lack of being a pro, my charts may be crude, I may mistake a bottom where I should start a fib retracement chart (or not flip them upside down at times like I guess I'm supposed to). Regardless, I have put notes in an attempt to "dumb down" my charts and make them easier to understand my mentality and/or thought process.
No one can know for sure what will play out, but from my past few years of obsessing over charts I find the easiest way to predict is simply drawing lines. Maybe there are millions of other ignorant people like me drawing the same lines and that is the only reason it works, but hey, the crap works 99% of the time all the time. I can't predict which point it will bounce or cap out with any true accuracy, but at least it is educated guessing vs just outright gambling. It typically minimizes losses when you can at least ballpark what is likely to happen.
Also, I've seen other people make comments on XLM as well as BTC and other crypto in general about "the news" causing all kinds of price swings. Personally, I don't buy into all that too much. Sure it plays some part in it, but it sure is awfully coincidental that when all these "news events" happen, the price action still follows the same chart patterns largely. It still hits the same supports/resistances etc. Like looking at BTC, which I'm aware this is going on a tangent, you can measure out how many candles per a cycle of a parabolic run up and price increases etc. The gaps are all almost perfectly symmetrical and like damn near to the day on evenness between cycles. So it is hard for me to believe the news made that much of a difference really other than a short term swing for a day or two.
If you like my dumbed down charts and want me to do more with other coins I won't promise I will do them since I've chilled out a bit with the swing trading after learning some lessons a few years back and have been more geared towards longer bigger trades now. (Largely due to cbase charging for every trade now it seems when it used to be free to trade as long as it was limit trades. Now you need bigger swings to make it worth my while which in turn makes it more risky hitting targets)
Sorry for the excessive non-relevant background info, but I imagine others on here have weathered past storms and gained some patience in trading as I have. If nothing else, feel free to bash my charts or thought process. Criticism can fuel further learning.
Disclaimer: Not financial advice, not a professional, this is just me sharing my plan for trading. Follow at your own peril, but I wish you all get your moon shot Lambos.
Happy trading! please leave a like or a comment if you agree or want me to bother with more in the future.
Edit: After posting I see it scrunched up the text etc. Just adjust the plot with the sliders to see more clearly.
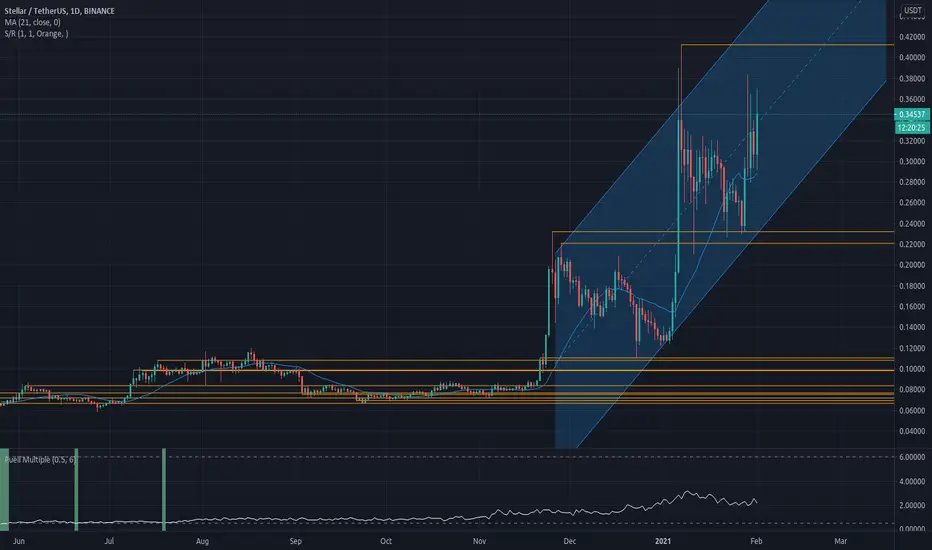
STELLAR- Our chart updated chartOur updates Stellar/dollar chart with key support and resistance levels. Right on major support at this time.
Fundamentally, what I like about Stellar is the fact that they are:
a. a non-profit organization (clever..)
b. very close to the IMF and Federal Reserve
Our research has proved that Stellar Lumen technology could be more likely to be used for CBDCs (Central Bank Digital Coins) than any other competitor, simply for the fact that allready they seem to be working closely with (b).

XLMUSD completing bullish Gartley | Upto 108% profit possibilityHi friends, hope you are well and welcome to the new update on Stellar.
On 2-day, the price action of XLM the is completing the final leg of bullish Gartley and soon it will be entered the potential reversal zone. There is also a good support of 50 simple moving average beneath the buying zone.
Possible profit and loss ratio:
This trade has a huge profit possibility up to 108%, and the loss possibility is only 23%.
Note: Above idea is for educational purpose only. It is advised to diversify and strictly follow the stop loss, and don't get stuck with trade.
For exact buy and sell targets for this trade, and other harmonic trading signals you can join:
www.patreon.com
