Stellarlumens
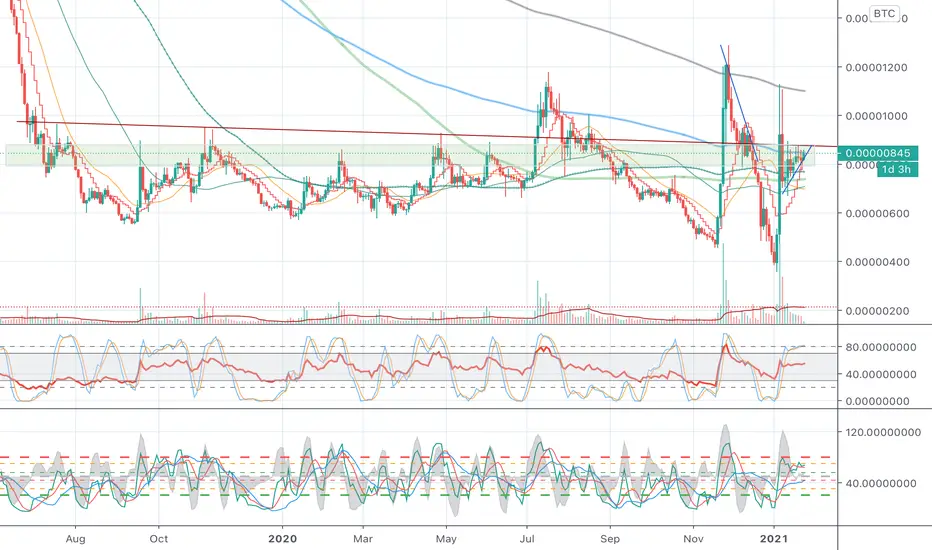
Time to make stellar performance again XLM!Looking at the longer term development helps to put the recent price action into perspective. XLMBTC has actually moved back and forth across the old downward sloping trendline that originates from June 2019. That trendline now coincides with a strong support/resistance against which XLM is presently forming an ascending triangle. That can be seen better from the 12h chart below.
Last November there was a tremendeous impuls to the upside all the way to 1200 sats level. After that started a strong correction, while BTC was making a strong move up, taking XLM all the way down to 400 sats level. From that bottom on 3 Jan XLM has recovered to the present level, back to the 840-880 strong S/R zone.
In December XLM broke from that S/R zone downward after creating a descending triangle. Now it is completing an ascending triangle that most often breaks upward. I am holding XLM and buying more if that breakout takes place with a good volume. Tell me what you have concluded based on your research.
Trade safe and take care.
Cheers
Whoop
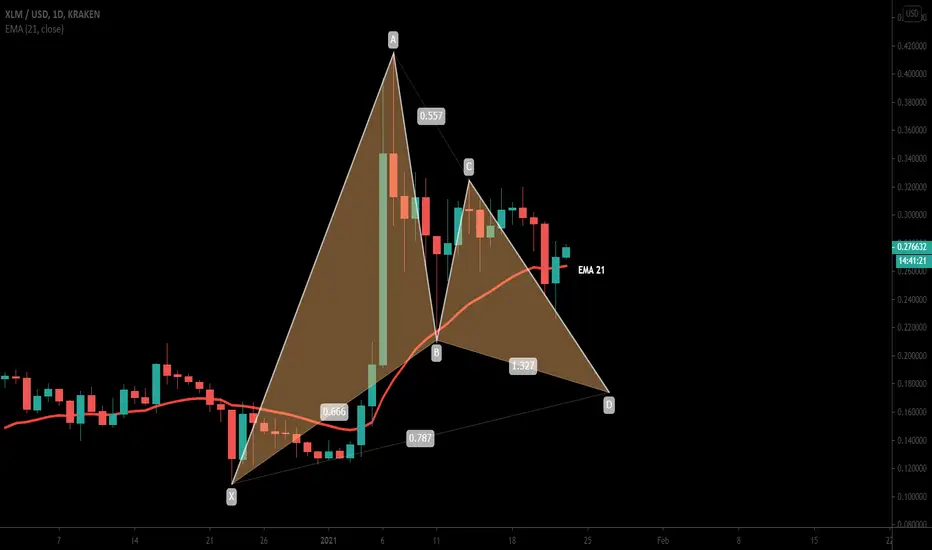
XLMUSD bullish Gartley flashed at the support of SMAs and EMAsSupport and resistance levels and SMAs:
On daily time frame, the price action of Stellar is moving between the $0.33 to $0.20 support and resistance zone. In the meanwhile priceline of XLM is still moving above simple moving averages with the time period of 25, 50,100 and , 200. At the moment it is re-testing 25 SMA as support.
Daily EMA :
If we take a look at the 21 exponential moving average on daily chart, then the price line of XLM is re-testing this EMA as a support with a powerful bearish candlestick.
Gartley move:
While re-testing the EMA on weekly chart, the price action has also formed a bullish Gartley move.
Conclusion:
On the daily time frame chart, the price action is at the supports of 21 exponential moving average and 25 simple moving average. But the harmonic Gartley pattern is flashed at the right time. This harmonic move can be really very helpful to save these supports and for the continuation of the bullish rally as well.
XLMUSD completing bullish Gartley | Upto 108% profit possibilityHi friends hope you are well and welcome to the new update on Stellar.
On the two-day time period chart, the price action of the XLM is completing the final leg of bullish Gartley and soon it will be entered in the potential reversal zone. There is also 50 SMA support below the PRZ level.
Possible profit and loss ratio:
This trade has a profit possibility of 108%, and the loss possibility is only 22.5%.
Note: Above idea is for educational purpose only. It is advised to diversify and strictly follow the stop loss, and don't get stuck with trade.
For exact buy and sell targets for this trade, and other harmonic trading signals you can join:
www.patreon.com

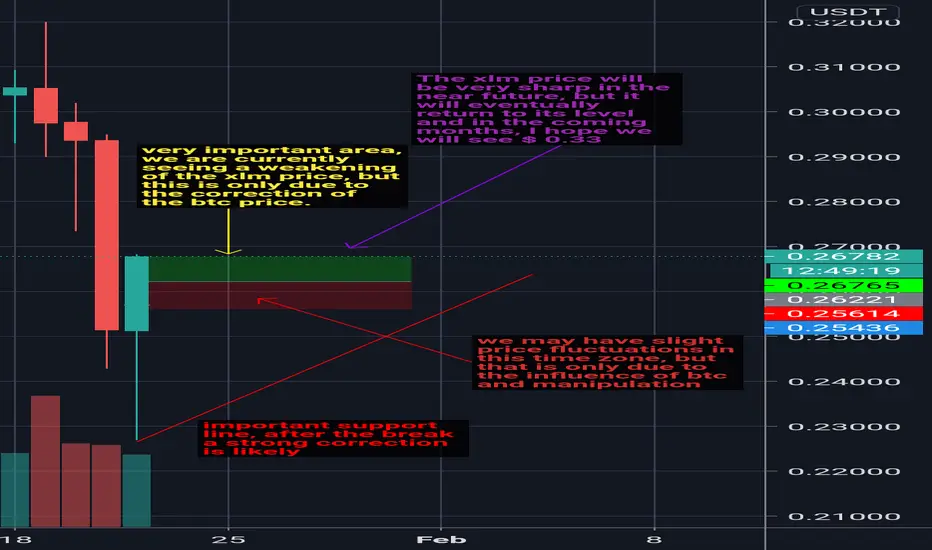
XLM always rewards the patientThe current market situation can be stressful for many as the behavior of btc affects xlm, but for me it is just a shopping opportunity and I will definitely use it. XLM is technology and a great team, ready to operate at the highest level.
🔥 CRDT.io (CRDTpay) it's a quiet project but is developing very well.
Available on HitBtc and many strong exchanges soon
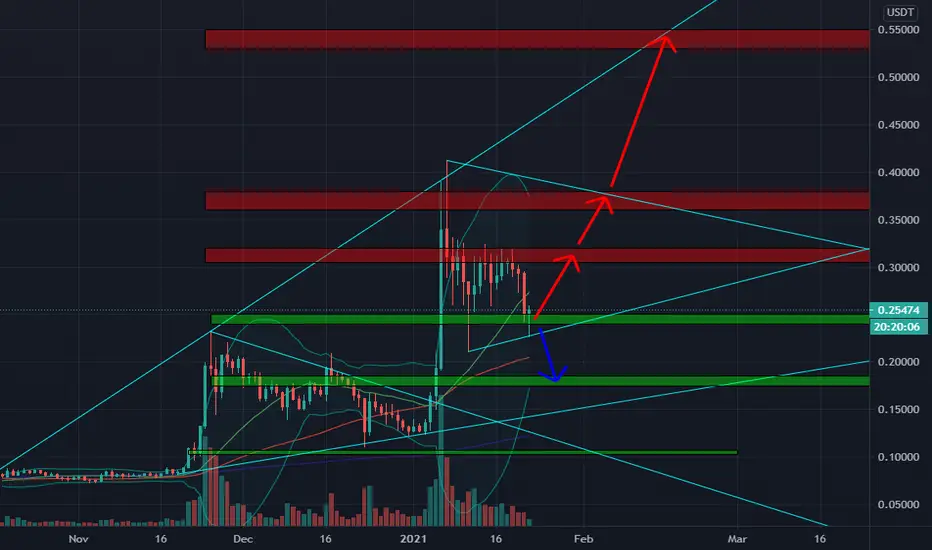
✳️Stellar Lumens/USDT Analysis (22/1) #XLM $XLMXLM will form a Symmetrical Triangle pattern to reinforce the uptrend in February if $0.24 zone holds.
I think February will be a crazy month for XLM when USDC is integrated into Stellar network
📅NEWS
👉Jan 21 : Quarterly Review
👉Feb 28 : USDC on Stellar
📈BUY
-Buy: 0.24-0.25$ if A. SL B
-Buy: 0.305-0.32$ if A. SL B
-Buy: 0.36-0.38$ if A. SL B
📉SELL
-Sell: 0.305-0.32$. SL A
-Sell: 0.36-0.38$. SL A
-Sell: 0.53-0.55$. SL A
♻️BACK-UP
-Sell: 0.24-0.25$ if B. SL A
-Buy: 0.175-0.185$ if A. SL B
❓Details
Condition A : "If 1D candle closes ABOVE this zone"
Condition B : "If 1D candle closes BELOW this zone"
XLMBTC is ready for long-term bull runRe-testing wedge:
XLM with US Dollar pair, after breaking out from the wedge on the weekly chart, the priceline has re-tested the resistance of wedge and support and the long-term breakout has been confirmed.
BULL FLAGE and testing EMA supports:
On the daily chart, the priceline has formed a bull flag and being consolidated. In the meanwhile, the XLM is also testing the EMA 10 and 21 as supports.
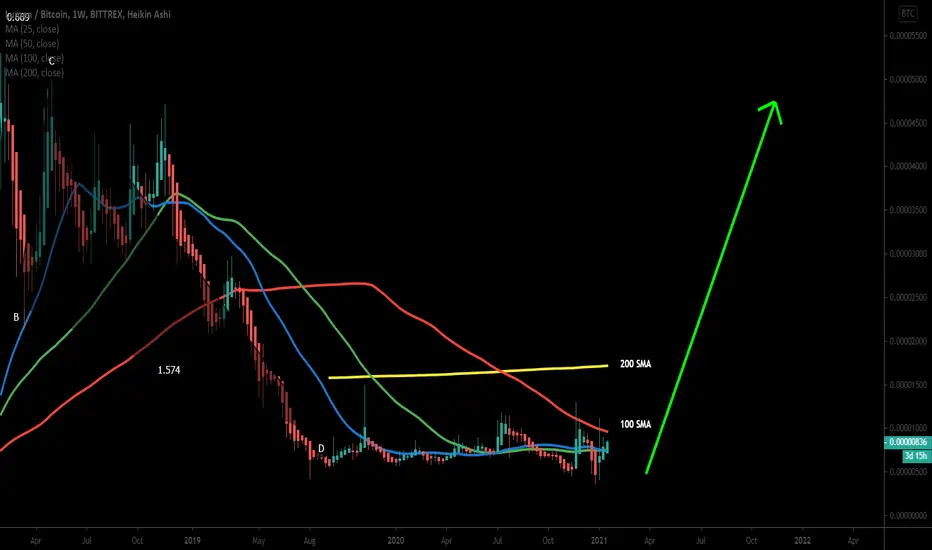
SMAs on weekly chart bitcoin market:
With Bitcoin pair, on weekly chart, the priceline of Stellar is breaking out the 50 simple moving average then there will be 100 and 200 SMA resistance levels.
Ichimoku cloud:
On the same weekly chart, with Bitcoin pair, the price action of Stellar is moving under an Ichimoku bearish cloud for a long time. Now the cloud has turned weak and it can breakout the cloud at any time for a powerful bullish rally.
Long-term big harmonic moves:
On long term-two week chart the price action of stellar has formed a bullish Butterfly:
And on 2-month chart, it has formed a big BAT pattern and entered in potential reversal zones of both patterns.
Conclusion:
XLM needs a breakout of weekly 200 SMA and the bearish cloud as soon as possible to start the long-term bull run. The harmonic moves are indicating that the breakout is very much confirmed.
For exact buy and sell targets for this trade, and other harmonic trading signals you can join:
www.patreon.com
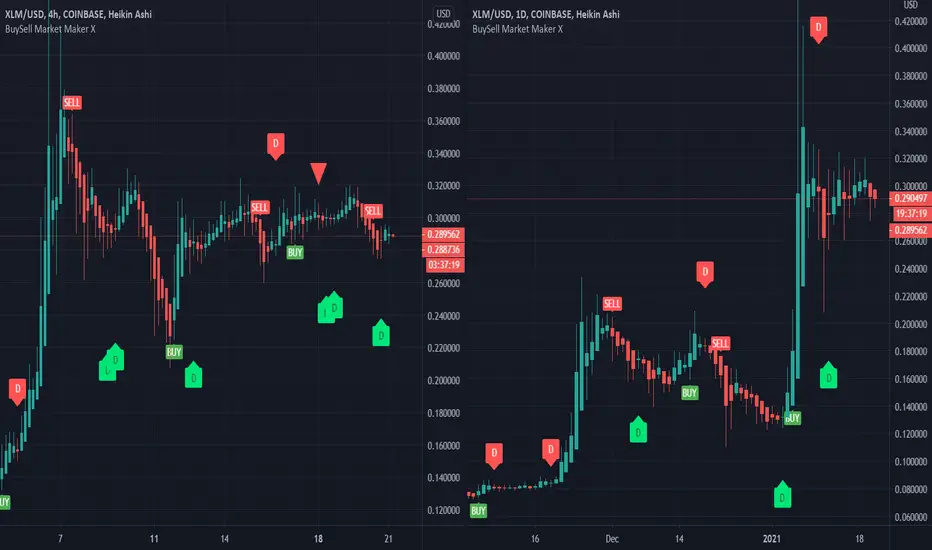
Stellar XLM 4 hour vs 1 Day timeframeStellar XLM receives a sell signal on the 4 hours timeframe and another sell on the daily.
Please leave me a message if you want to test the buy and sell indicators that i am using.
Steller XLM USDT on verge of Breakingup / BReaking down?*** Do your own research. This is only my own analysis, not an investment advice.

XLM/USDT longOn Coin market cap their are 100 percent positive indicators showing a strong buy over all. Ethereum Is breaking free from It's intense affinity from BTC. It's position Itself to take over as number one coin by market cap. As Polkadot Is looking to kill ETH knocking It two the number three spot. While ETH just surpassed BTC's market cap briefly for the first time two days ago due to conversion of BTC Into large amounts of wrapped BTC. A negative indicator for BTC. Which was holding back. But right now XLM Is in sync with either even with BTC In the red.
I want to point out that XLM broke out of a beautiful looking pennant on the daily chart today. It is attempting to hold with massive support. I'm watching for confirmation before I buy as It bounces back upwards. RSI on the daily is just out of overclocked territory. With MACD getting tighter after 15 days in the green. On the 4 hour chart MACD is currently opening up, while RSI clocks at ~60. This chart also shows in the past four hour period we broke above the Bollinger bands but only slightly. Which are much wider on the daily chart. It looks like we're very bullish in the next four hours. If market conditions don't switch up causing a reversal this could be quite profitable In a short period of time. Make sure to keep your stop losses tight, and buy after confirmation on the daily chart.
Thank you for checking out my first chart on trading view. I'm growing everyday, and improving. Any constructive criticism will be take with a grain of salt. Hehe just playing I would appreciate all the feedback I can get. Be safe, and let's get It. Sincerely, Ghost

Stellar - XLM - Long term fractal UPDATEDIts moving faster clearly. So here is the update of the repeat fractal. Clearly these repeat fractals are highly speculative. Time frames tend to be different on reality.
Just for pricing reference really. Though I wouldn't be surprised if it did just repeat almost 1:1.
I will be respecting these price targets.
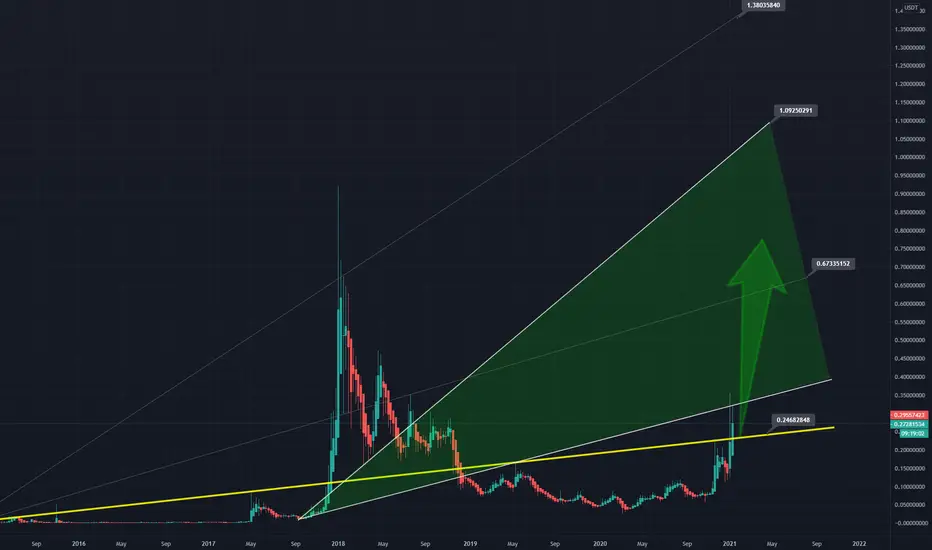
STELLAR/XLM - LONG SETUPI'm expecting another leg up. Stellar is accumulating for some time. It may take a little longer, but when it is finished we are going to see the continuation of its growth.
Stellar Lumens XLM Potential 14:1 Setup Stellar is an entire ecosystem with expanding potential.
Here is something I have positioned in for now.
TRADING IS NOT SUITABLE FOR EVERYONE.
If you don't know what you're doing... TRADING CAN CAUSE YOU TO COMPLETE LOSE ALL OF YOUR MONEY.
Even if you "know what you're doing" you can still experience expensive LOSSES and lessons.
You could use a practice account and trade with leverage.
Feel free to follow me on tradingview for more markups.

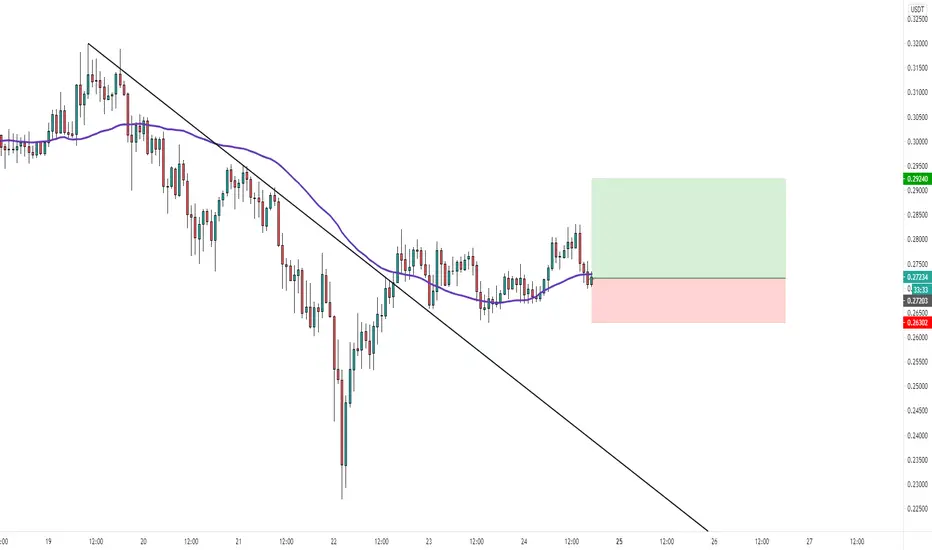
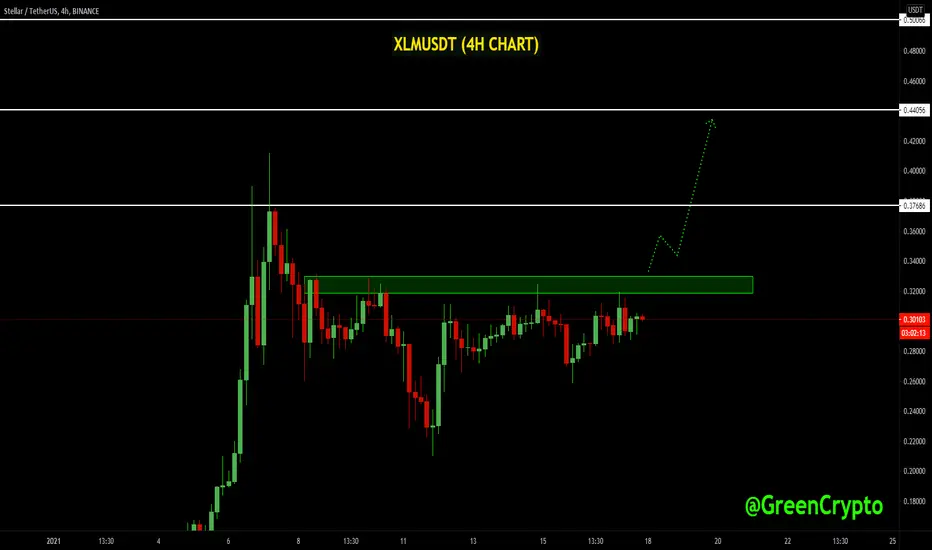
XLMUSDT (stellar) Wafting for the next Bull Run!XLMUSDT (4h CHART) Technical Analysis Update
Waiting for the resistance zone breakout
XLM/USDT currently trading at $0.300
SHORT Entry level: Above 0.333 (only enter long after 4-hour candle closes above resistance zoner)
STOP LOSS: I will update once I see the breakout
Support level 1 (Target 1) : $0.376
Support level 2 (Target 2) : $0.440
Support level 3 (Target 3): $0.500
Max Leverage: 3X
ALWAYS KEEP STOP LOSS...
Follow our Tradingview Account for more Technical Analysis Update, | Like, Share and comment on your thoughts.
STELLAR - Our Small ChartOur updated small chart with key points.
Our analysis shows possible rise is likely to happen next.

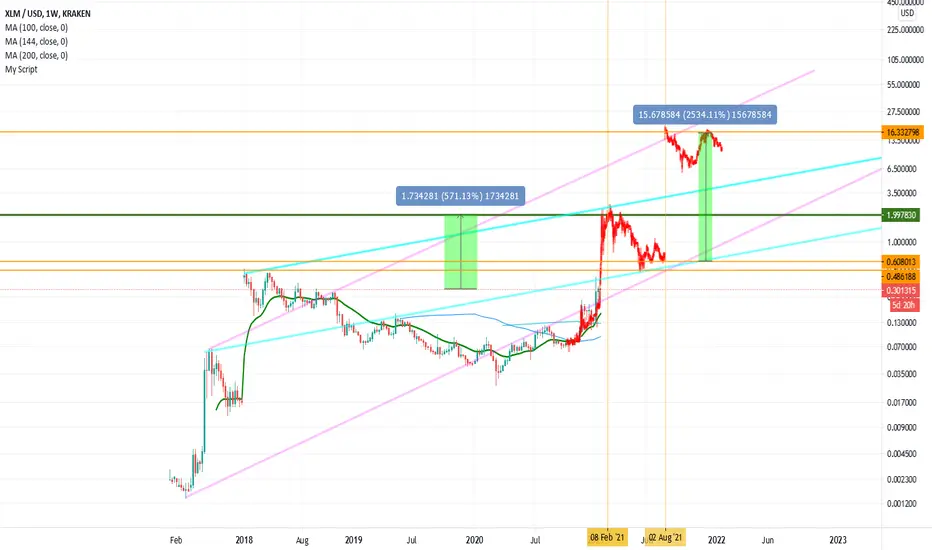
STELLAR - Fundamental and Technical agree: it's a BUYThe chart is beautiful. Still far away from it's all time highs but showing a less volatile uptrend movement.
Fundamentally, what my research has revealed is that STELLAR is very close to the 'Big boys'. Both the IMF (International Monetary Fund) and the Federal Reserve are close to Stellar and keep inviting it in their CBDC (Central Bank Digital Currency) discussion panels.
Could this non-profit organization become the pillar of Central Bank Digital Currencies? Possibly yes, so keep a close eye on it.
Stellar is now definitely in my radar and I have already invested in it, recently.
ps. Now there are about 50 billion lumens, total, in existence, and no more lumens will be created. Nearly 20 billion lumens are out in the open market, and the Stellar Development Foundation retains the other 30 billion or so to develop and promote Stellar, per its mandate. Fundamentally, this is another 'plus'
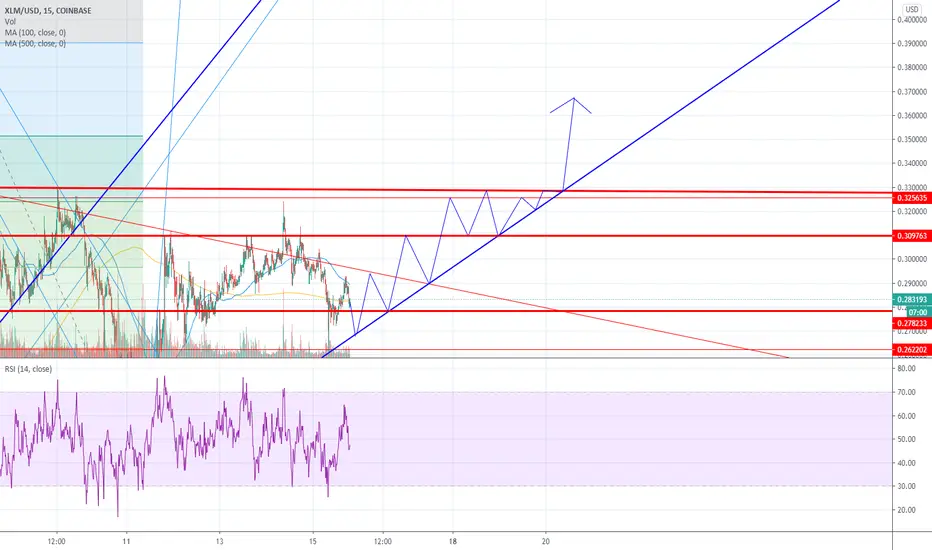
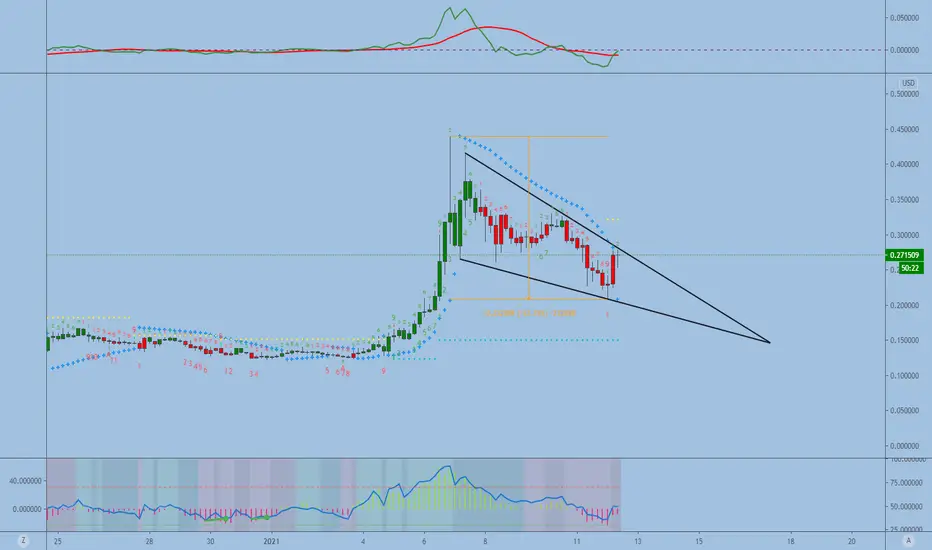
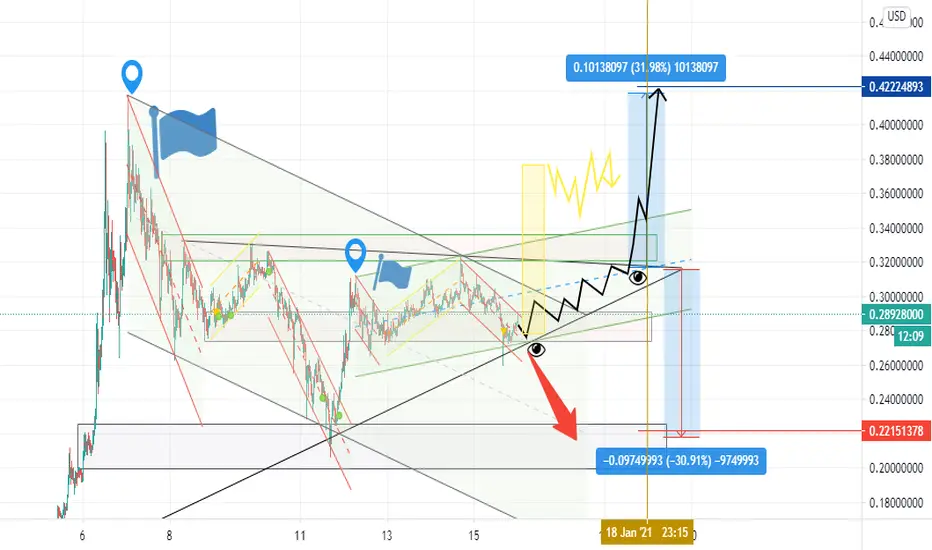
XLM: Flag or notI'm quite curious about the next path of Stellar.
3 options:
a) (red) Immediately bearish to check next support level (because we are already testing this level so many times)...
b) (yellow) we do another strike of +50% up re-starting a new flag on the next 13h from now on...
c) (black) we finishing the "huge triangle" and check if we go north or south and fly away to the stars or not...
Let me know what you are thinking!
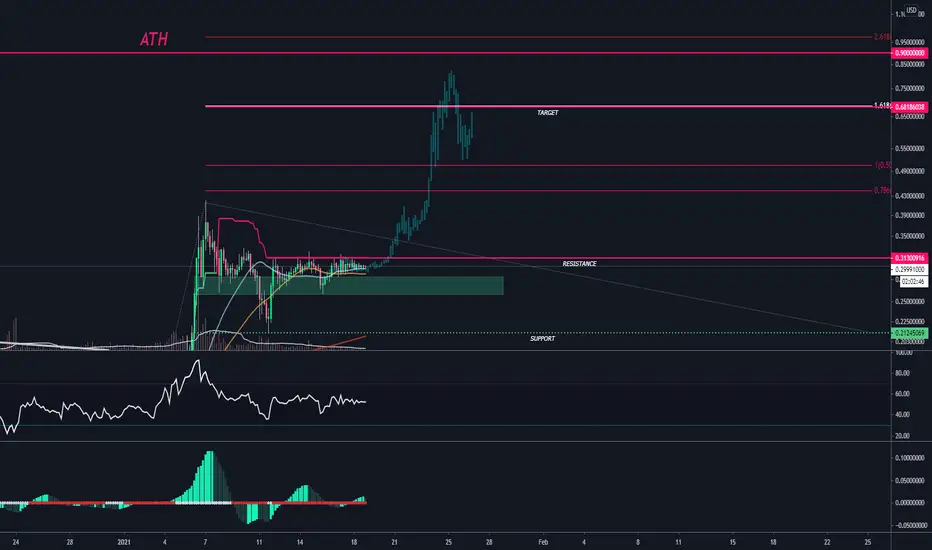
Inverse H&S almost perfect, target at least 0.43Hello traders,
I published an idea about iH&S two days ago, and as it seems, this idea is very close to be accomplished by xlm/usd... We just need a neck to be broken in area between 0.295-30.5...That is very possible to happen today... So, let's watch... Thank you, and if you like this idea, press that like button or comment what you think about it... This is just an idea, always do your own research before trading

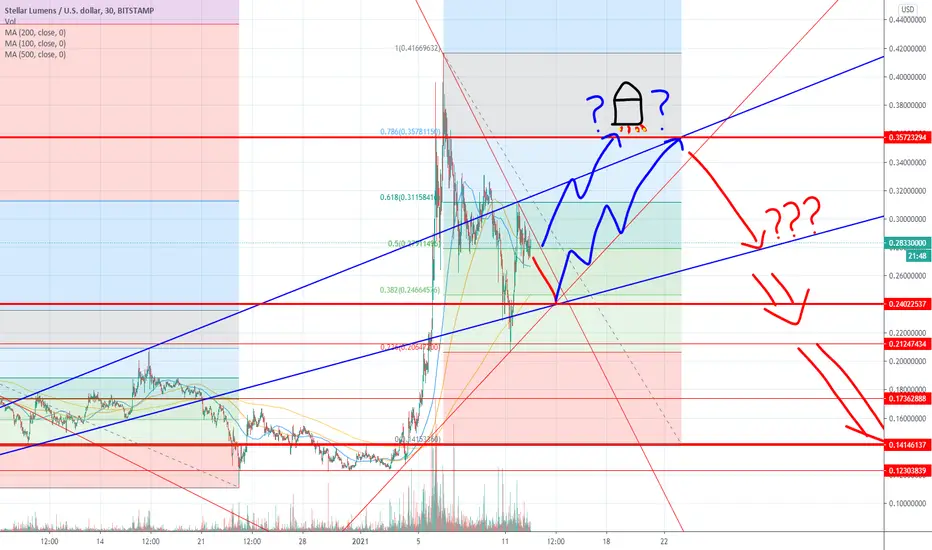
XLM where is it going???I am not a professional analyst. I want to see which one of three scenarios fits.
I hope it goes to 80 cents
Stellar Lumens XLM - Breaking Out Of Bull Flag SoonBitcoin was "dumping" and XLM stood there like a champ gaining Sats and rising in price. Excuse me Bitcoin, please have a seat.. it's about to be Alt Season - Round 1
XLM is a sleeping volcanoXLL has been appreciated by the Ukrainian government, this is just the beginning, because stellar is an excellent blockchain technology and is observed by other countries, therefore 2021 will be a key year for the XLM price. Currently, the price is very low, so I recommend LONG

New Altcoin I am watching, Go Long on breakout Stellar $XLM Last week,
Stellar announced they were working with the Ukrainian government and the price went to the moon.
In the last few days, we saw a 50%+ correction.
For me, it is time to get in.
Currently, I don't have any stellar in my portfolio and looking to add a small amount if we break out of this wedge.
I'm still new to this altcoin and from my research so far, it looks like Stellar is the platform for governments to build Stablecoins on.
Source
cointelegraph.com
stellar.org