XLMUSD another big bullish reversal setupHey, friends hope you are well and welcome to the new update on Stellar.
Previous BAT idea produced more than 360% rally:
Previously we have seen that the stellar formed a BAT on the monthly chart and produced more than 360% rally.
Another bullish BAT formation:
A few days back I posted an idea that if on daily chart, the priceline will break down the 25 simple moving average then it may complete another harmonic bullish BAT move and now the 25 SMA is broken down and the price action is completing the BAT. For the completion of this final leg the price action of stellar coin needs to drop at least 25% more.
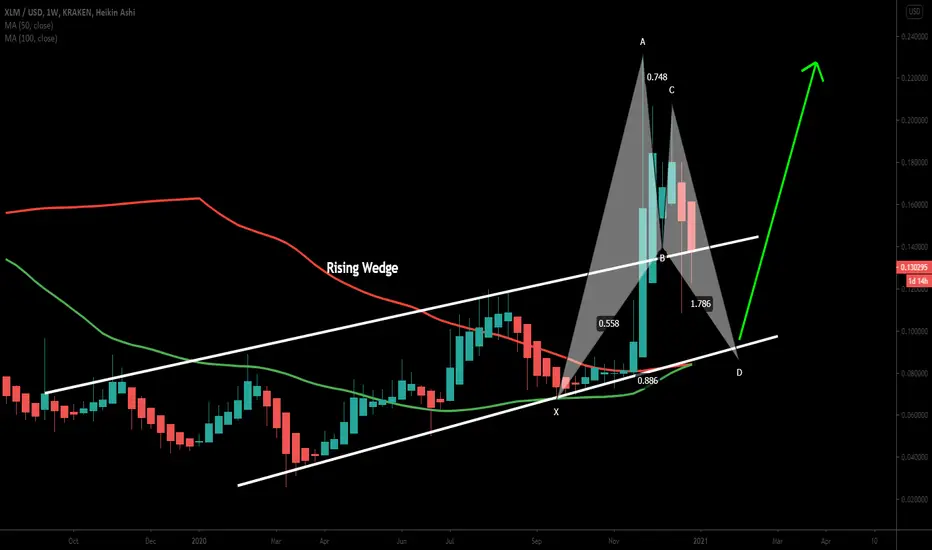
The priceline may re-enter in wedge:
The formation of BAT was started after breaking out from the rising wedge pattern on weekly chart. After the breakout the price action is re-testing the previous resistance of wedge as support, but I believe that the priceline may re-enter in this wedge for the completion of final leg of BAT pattern. We also have very good support of 50 and 100 simple moving averages below the potential reversal zone of this big BAT pattern.
On the daily chart, we have 200 simple moving average support at $0.10, which is also between potential reversal zone.
Conclusion:
Even though we have good supports and the formation of a bullish reversal pattern but we should use the potential reversal zone of the BAT pattern as stop loss to minimize the risk factor. Because if the price action will break down the potential reversal zone and the support of the rising wedge as well then it can move more down for the completion of harmonic bullish Crab pattern. And for this purpose the price action will need to move between 1.27 to 1.618 Fibonacci retracement levels.
Stellarlumens
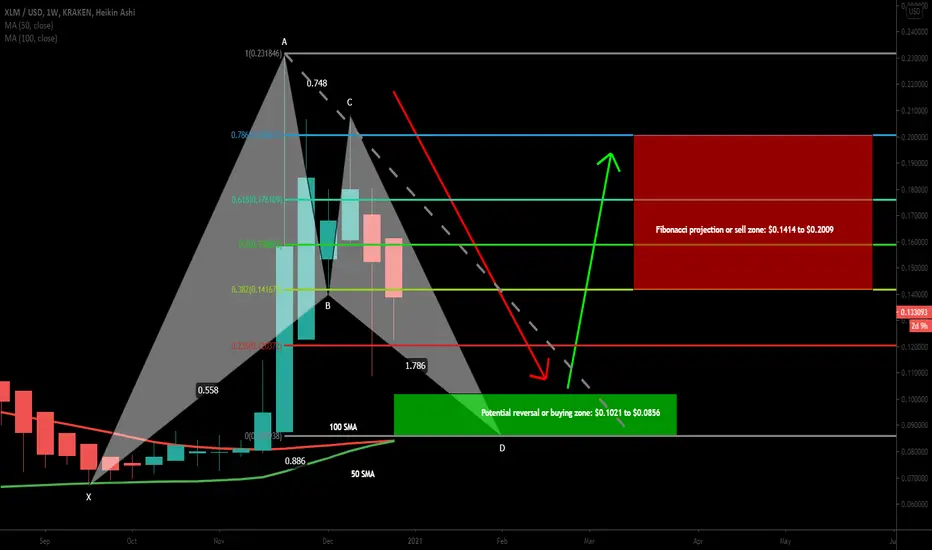
XLMUSD forming big BAT | Upto 134% expectedOn the long-term weekly chart, the price action of Stellar (XLM) is completing final leg of bullish BAT and soon it will be entered in the potential reversal zone. There are also 50 and 100 SMAs supports below the PRZ level.
Buying And Sell Targets:
The buying and sell targets as per Fibonacci sequence of BAT pattern should be:
Potential reversal or buying zone: $0.1021 to $0.0856
Fibonacci projection or sell zone: $0.1414 to $0.2009
Stop Loss:
The potential reversal zone area that is up to $0.0856 can be used as stop loss in case of complete candlestick closes below this level.
Possible profit and loss ratio:
As per the above targets, this trade has a profit possibility of 134% and as per the above-mentioned stop loss, the loss possibility is 16.5%.
Note: Above idea is for educational purpose only. It is advised to diversify and strictly follow the stop loss, and don't get stuck with trade.
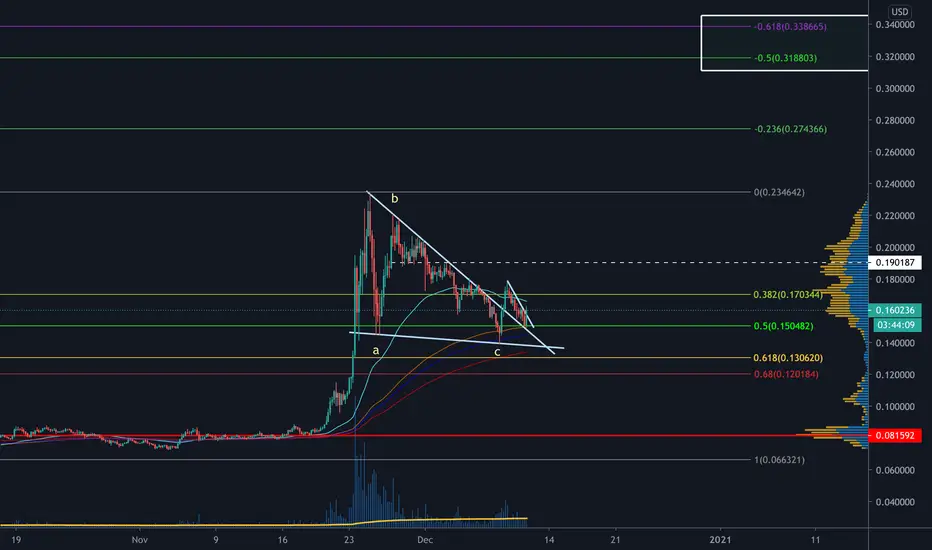
XLM: Updated WedgeAfter breaking down from the earlier wedge, this is my updated plot and predicted trend. I'm thinking it will bounce hard at the .11 range, but unsure if I'm missing something. Let me know your thoughts!

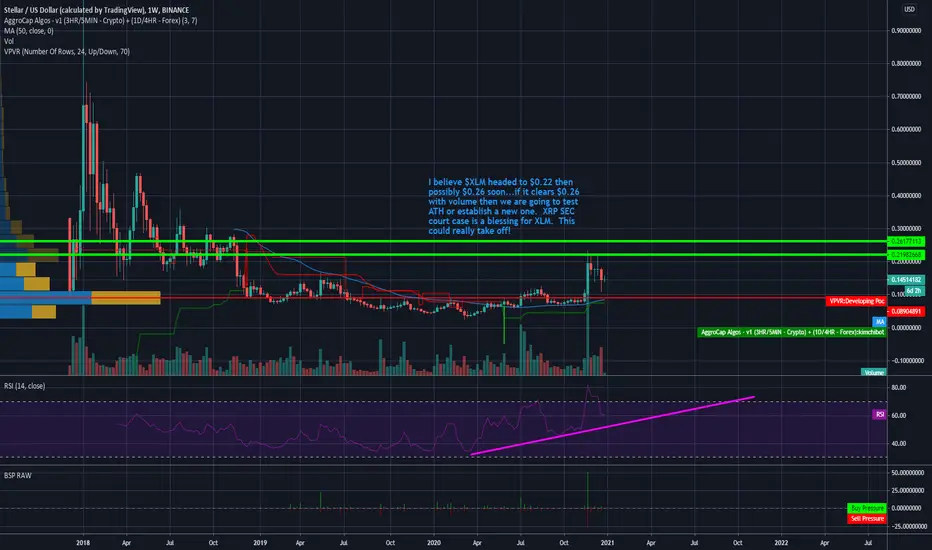
#Stellar #Lumens #XLM Headed May Test ATH and More!Based on the fact that #XLM blew through resistance, is still pushing above 14 cents and X I believe $XLM headed to $0.22 then possibly $0.26 soon...if it clears $0.26 with volume then we are going to test ATH or establish a new one. XRP SEC court case is a blessing for XLM. This could really take off!
Steller ( XLM ) Trend line breakoutprice is breaking the trend line here
breakout above will send price to 0.18 , 0.2 , 0.23 $
XLM shaping up for a pump with XLMBTC at historical lowsSTELLLAAAAAAAAA(r)
XLMBTC at historical lows
15min with VFAP, showing possible target for exit/position reduction
1hr chart showing how the Binance funding indicator is used to determine direction
Weekly at support, may revisit .13 as a retest
Weekly with BBPCT, showing the oscillator still in the upper region
I think Stella Lumen ( XLM) found nice Support at 0.14- Stella ( XLM) nice support 0.14
- Bear flag pattern
- My idea is Buy

XLM - Stellar , 11 cents is THE KEY !11 Cents is KEY ! Havea look at that 11cents powerful reaction.
I anticipate, or ratehr hope that price will go back further down
the lower the better .. but that 11cents was a massive signal that
its a vital place for buyers ...
Dont be surprised if it dips lower , but a deep retracement will do
Im buying more more more more !!

Stellar could be violentThis Dip was orchestred by SEC on 23 December againt XRP but also against the entire Crypto World, it means a lot about Governments wich want to control peoples psyches and scare them before end of the year. what a nice gift and what a better manner to reveal their ugly side. they could had wait end of festivity to rekt peoples.
As margin trader / Scalper i manage my own risks and use rebuy zones and Stop Loss, but i know some hodlers get rekt before Xmas and this situation make me dismayed.
Stay confident and strong because the future is bright in cryptos, its just the beginning and they will lose this war.
That said..back to trading :
XLM made a hard back so now, wait for this XLM Dayli Candle to close and look if you see an engulfing of the last day big red candle.
if this scenario not happens wait 1 more day to get a confirmation.
- a good buy Zone should be around 0.16$.
- Keep some Juice in case for a rebuy around 0.13$ ( Strong Buyers Zone on VP)
- TP1 Should be before 0.2$
- TP2 before 0.25$
- TP3 bedore 0.3$
i don't publish indicators to keep chart clear but i can tell you that XLM back could be violent as 1 Day is on the floor and ready to turn green.
Like Always keep 1 eye on BTC King!
Merry Xmas to everyone and Happy Tr4Ding !

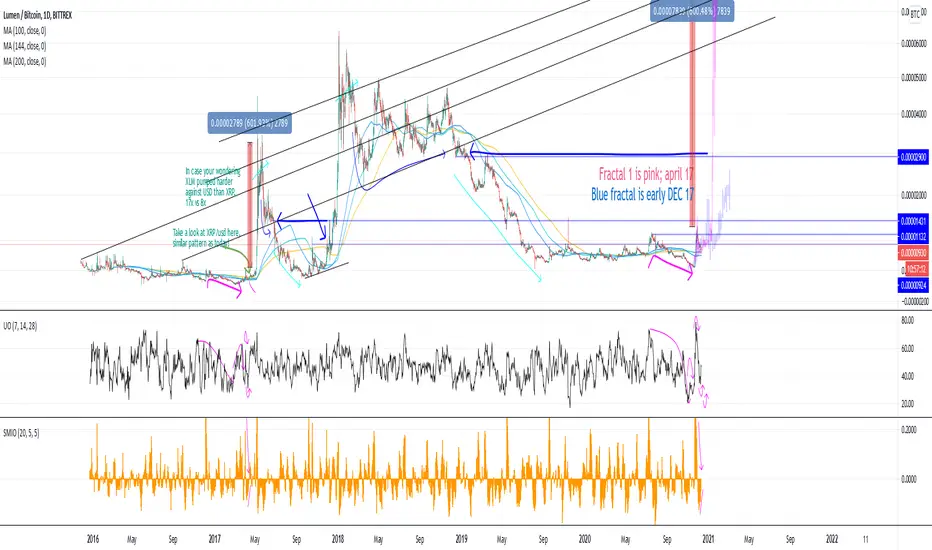
XLM/BTC long term graph showing possible pathsXLM/btc
Take a look at the xlm and xrp /usd charts for these highlighted periods. Both look possible. I am leaning towards April 17 option though (pink).
I am always wondering which to hold more of though. If pink replays then XLM is the one to hold. So after XRP snapshot ill be re balancing much heavier into XLM.
Let me know what you think! I've been doing these type of charts/analysis for years but never published them before. :)
GLHF
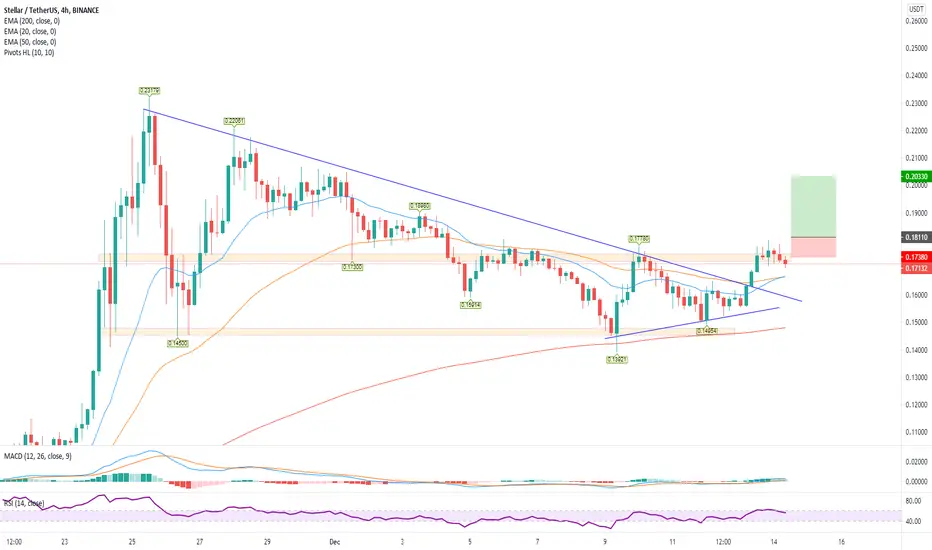
Technical Outlook on XLM.XLM is a very similar story as XRP as they correlate a lot. So the most of thing said about XRP can be also said about XLM.
Still we can find one difference that the price is pointing towards the support area located at $0.145 to $0.15 per XLM, as the MACD is on a selling wave.
As the price is currently located at $0.17 area, a break of $0.207 will bring bullish momentum while a break below $0.145 will bring bearish momentum.
It seems like the price of XRP is ahead of XLM as the 50 EMA was tested already, while XLM wasn’t tested yet and is currently located in the support area.
The overall outlook for XLM looks bullish in overall as the price as above both 20 and 50 EMA levels and the RSI is trending higher.

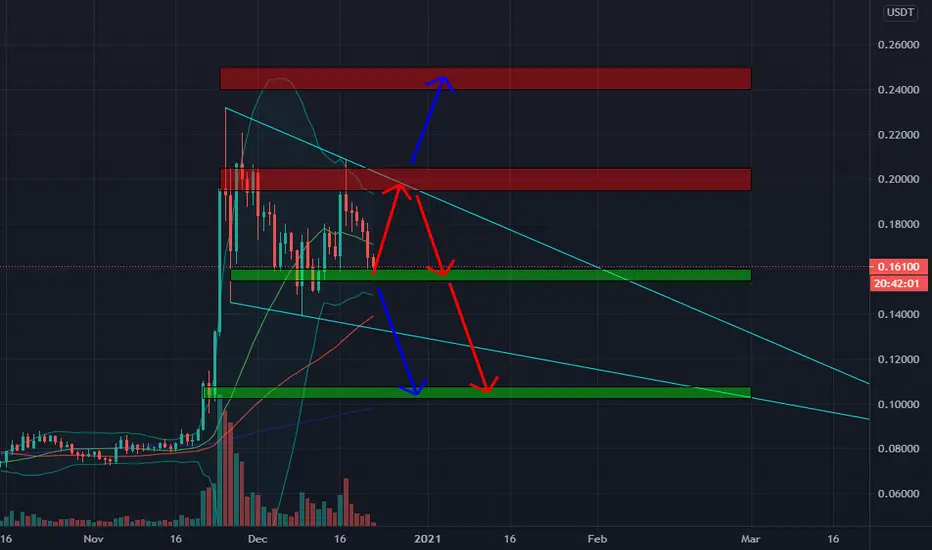
✳️Stellar Lumens/USDT Analysis (22/12) #XLM $XLMAfter bringing us a huge profit from the pump from 0.08$ to 0.23$, XLM has dropped quite a bit but remains in the wide sideways of 0.14-0.23$
Currently, 0.16$ zone is a good support zone when last time it helped XLM rise to nearly 0.21$, so there is still a good buying force. I think this is just a recovery and will gradually decrease to the 0.105$ zone, then increase when at the end of February 2021, USDC will live on the XLM network.
📈BUY
-Buy: 0.155-0.16$.SL B
-Buy: 0.1025-0.1075$. SL B
📉SELL
-Sell: 0.195-0.205$. SL A
♻️BACK-UP
-Sell: 0.155-0.16$ if B. SL A
-Buy: 0.195-0.205$ if A. SL B
-Sell: 0.24-0.25$ if B. SL A
❓Details
Condition A : "If 1D candle closes ABOVE this zone"
Condition B : "If 1D candle closes BELOW this zone"
Stellar lumens - Daily UpdateStellar - Daily
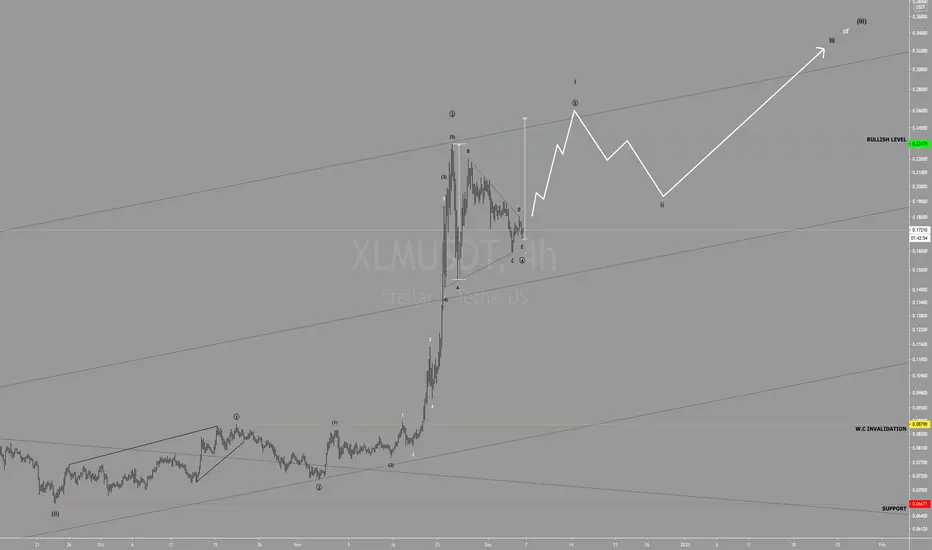
Bottom Line: Higher against 0.1192 ; in a developing (iii) wave at larger degree.
Outlook: Against 0.0667, the focus is on higher in a developing advance, wave (iii) of ((iii)) .
Analysis: We're watching for evidence a $XLM ended its wave ii correction at 0.0726 . A break above 0.1008 would bolster that outlook and setup a challenge of the next key level at 0.1192 .
Key Levels:
Below 0.0726; 0.0667
Above 0.1008, 0.1192

🎯 Christmas Day Breakout - Stellar Lumens - Altcoins [Crypto]Christmas day breakout looks to be on the cards for XLMUSD and potentially other altcoins (correlation). XLM is currently consolidating in a flagpole formation with strong support. Likelihood is that it will continue to fluctuate for the next 5 days until leaving the flagpole zone for a breakout.
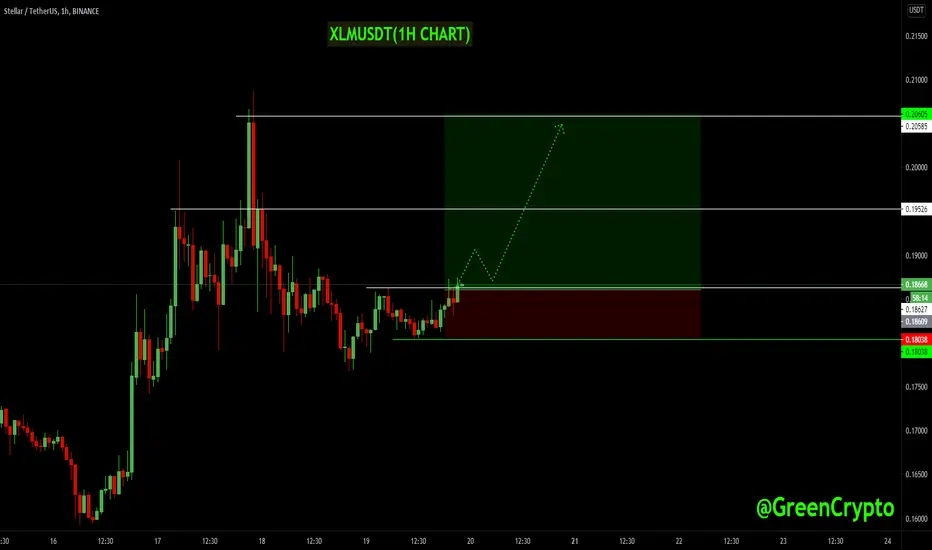
XLMUSDT (Resistance breakout)#XLMUSDT Technical Analysis Update
Resistance Breakout
XLM/USDT currently trading at $0.18600
LONG ENTRY level: 0.18600 to 0.18800
STOP LOSS: 0.18000
Resistance level 1( Target 1): $0.19500
Resistance level 2 (Target 2) : $0.20500
Max Leverage: 5X
ALWAYS KEEP STOP LOSS...
Follow our Tradingview Account for more Technical Analysis Update, | Like, Share and Comment your thoughts.
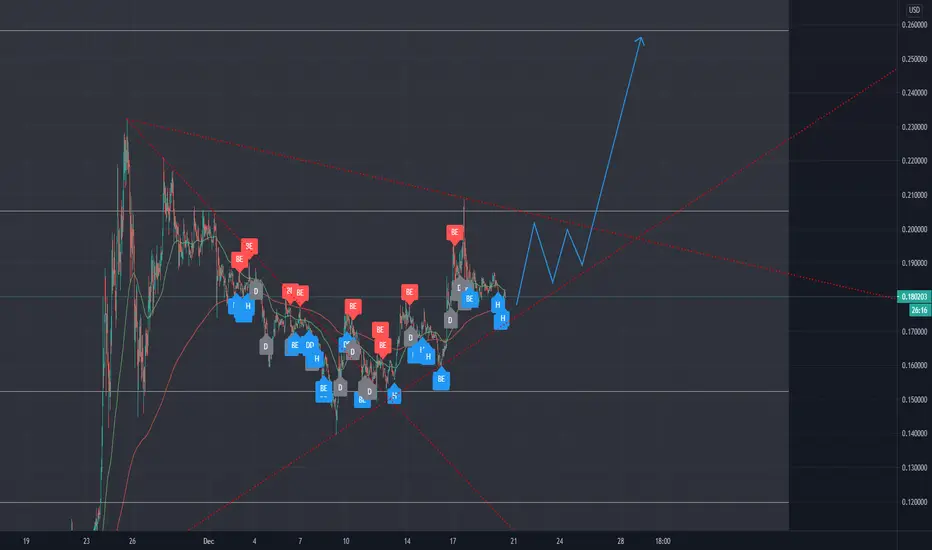
Stellar Buy a break setup.Stellar - Intraday - We look to Buy a break of 0.1811 (stop at 0.1738)
Daily signals are bullish.
Pivot resistance is at 0.1778.
The bias is to break to the upside.
Short term RSI is moving higher.
We look for gains to be extended today.
20 4-hour EMA is at 0.1667.
50 4-hour EMA is at 0.1665.
Our profit targets will be 0.2033 and 0.2111
Resistance: 0.1800 / 0.1900 / 0.2000
Support: 0.1700 / 0.1600 / 0.1500

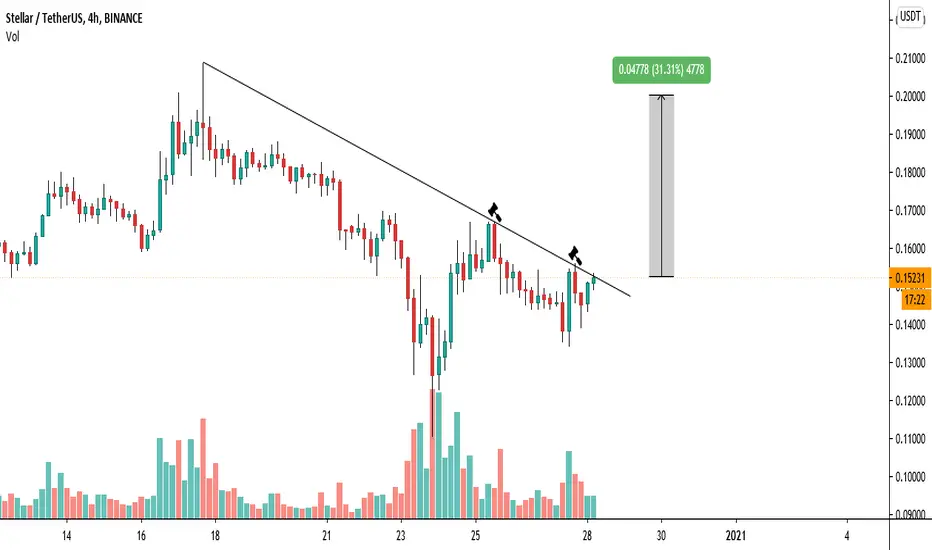
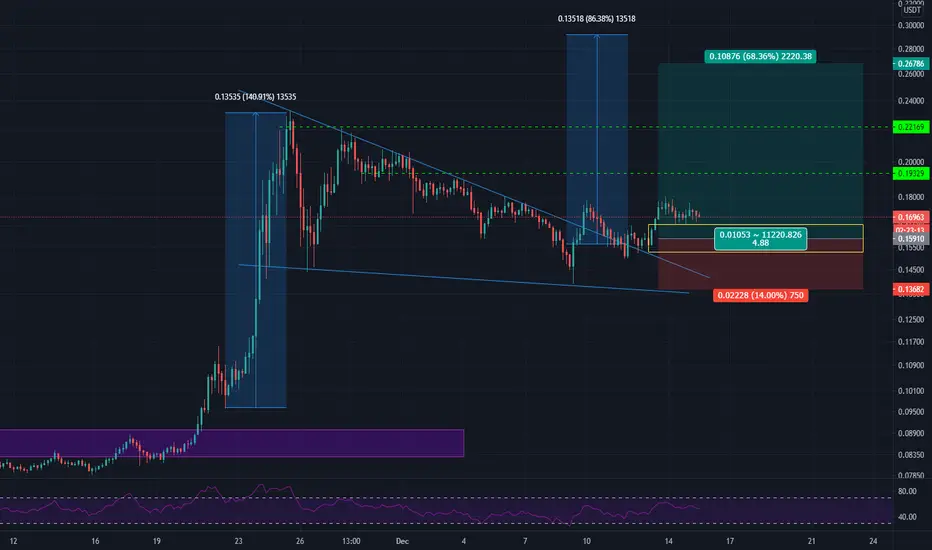
XLMUSDT 4H long setup; falling wedge breakout and retestedTA Explained
In my previous XLMUSDT long idea I anticipated a pennant breakout. It didnt happen unfortunately. Afterwards it did break the trendline and tested it afterwards.
Longing this breakout as it can be considered a continuation pattern.
Pretty wide SL from the average entry, so for this setup no leverage advised.
Trade setup
Best entries: 0.02875 - 0.02938
TP1: 0.19329
TP2: 0.22169
TP3: 0.26786
SL: 0.13682
RR: 4.88
Max leverage: 1
—————
Do Your Own Research (of course)
Trade at own risk (of course)
Only trade what you can afford to lose (of course)
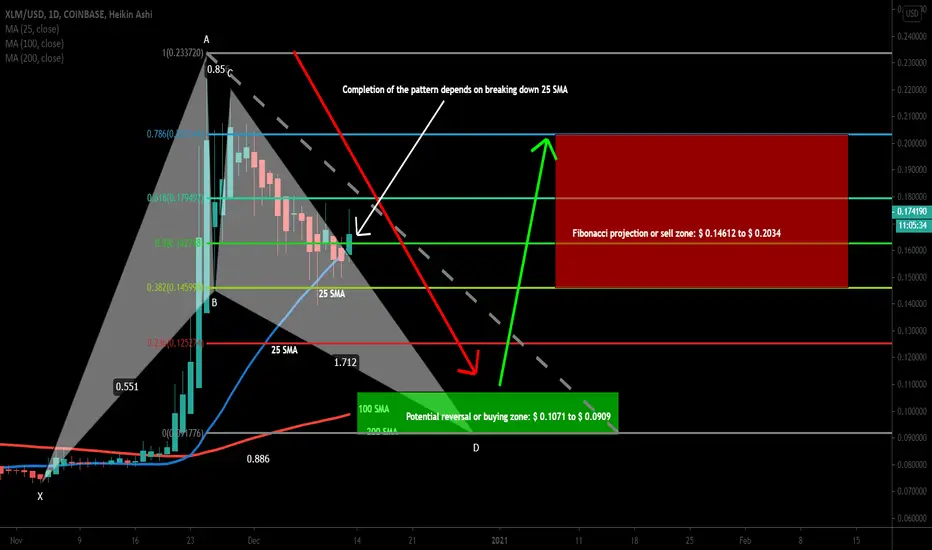
XLM can complete this bullish setup if 25SMA will be broken downOn daily chart , the price action of XLM is completing final leg of bullish BAT. The completion of this pattern depends on breaking down of 25 simple moving average. Otherwise, the pattern can be invalidated.
Buying And Sell Targets:
The buying and sell targets as per Fibonacci sequence of Gartley pattern should be:
Potential reversal or buying zone: $ 0.1071 to $ 0.0909
Fibonacci projection or sell zone: $ 0.14612 to $ 0.2034
Stop Loss:
The potential reversal zone area that is up to $0.0909 can be used as stop loss in case of complete candlestick closes below this level.
Possible profit and loss ratio:
As per above targets this trade has a profit possibility of 123.7% and as per the above-mentioned stop loss, the loss possibility is 15%.
Note: Above idea is for educational purpose only. It is advised to diversify and strictly follow the stop loss, and don't get stuck with trade.
XLM, get readyI think we have a finished correction here, get ready for some big moves across all markets.
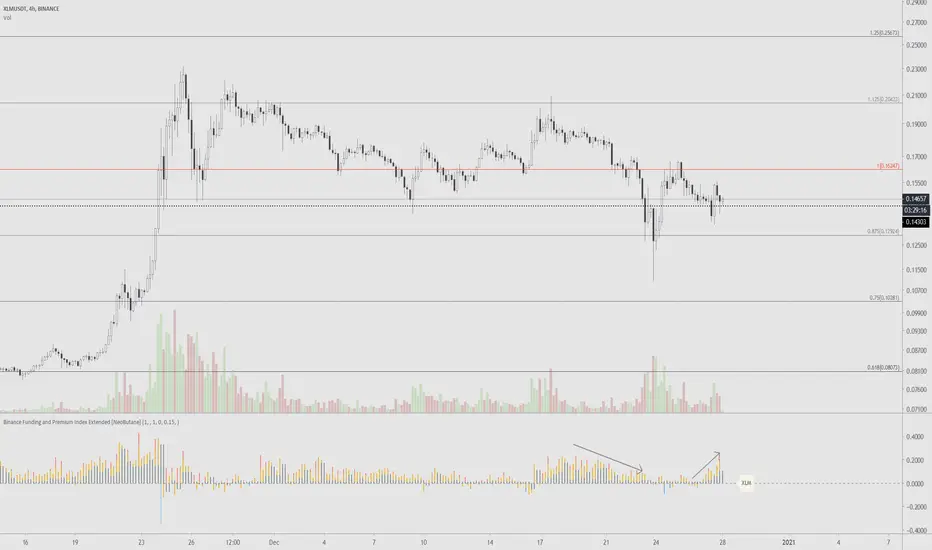
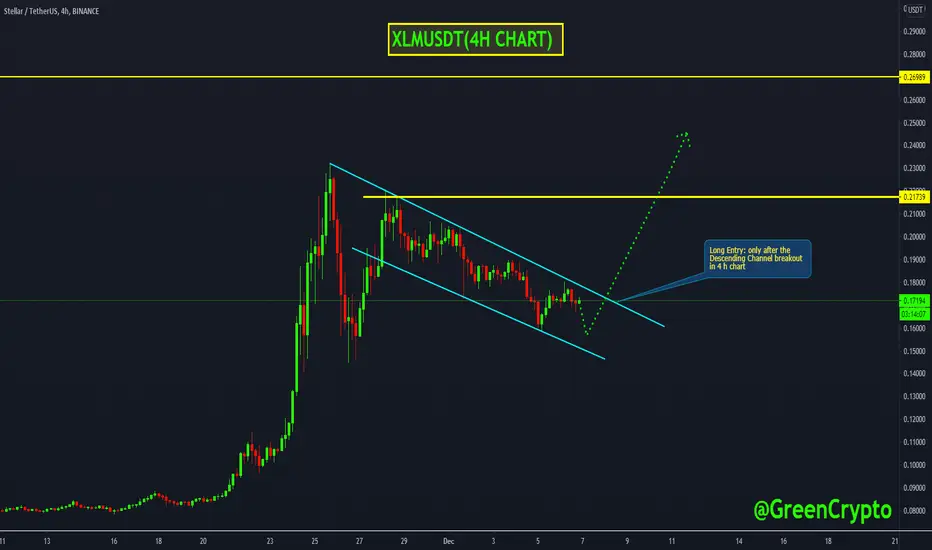
XLMUSDT (Stellar) Waiting for the Descending Channel Breakout #XLMUSDT Technical Analysis Update
Wait for the Descending Channel breakout Breakout
XLM/USDT currently trading at $0.17100
LONG ENTRY: Only enter long after Descending Channel Breakout in 4h chart
STOP LOSS: I will update once I see a breakout in 4-hour chart
Resistance level 1( Target): $0.2150
Resistance level 2 (Targe ): $0.2650
Max Leverage: 4X
ALWAYS KEEP STOP LOSS...
Follow our Tradingview Account for more Technical Analysis Update, | Like, Share and Comment your thoughts
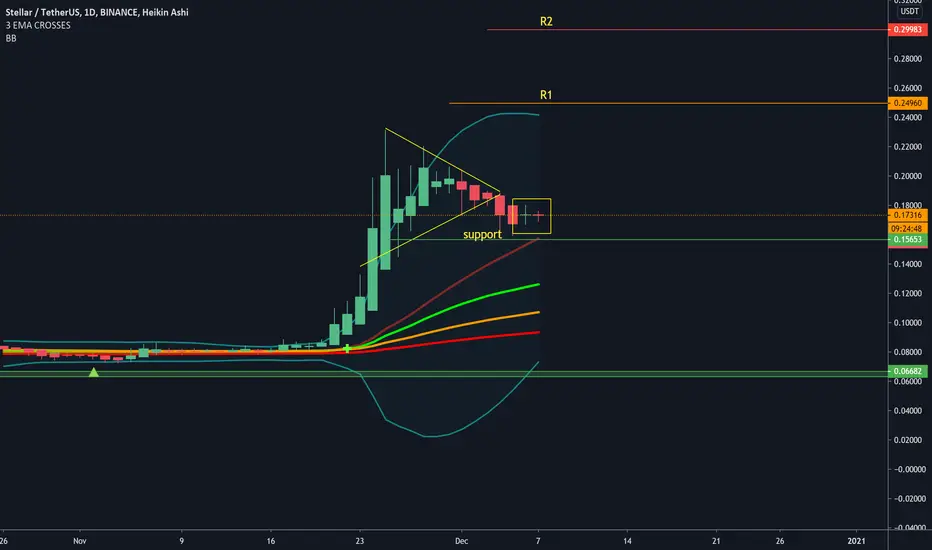
Stellar PatternSpinning top on D1.
important to notice that pattern and finish this daily candle to analyse more and try to detect a way.
Happy Tr4Ding !
STELLAR - Intraday Update - 12/06/20 (Short-term) STELLAR - Intraday Update - 12/06/20 (Short-term)
Bottom Line: Subdividing higher within wave iii of (iii)
Breaking above $0.23179 is the next upside objective for the bulls.
Outlook: A fifth wave rally is in its early stages.
Note: Prices can vary between exchanges, and consequently there may be differences in our chart prices due to different data sets.