STELLAR LUMENS ✅ Can XLM Rally after a Rejection at Resistance?💬 Stellar (XLMUSDT) recently got rejected at resistance. Stellar has some interesting ideas in the works, like a "Turing complete" contract proposal, but generally speaking, large-cap cryptos have been yawn-inducing. With that said, we have Stellar on our weekly watchlist for a reason. Let's see if XLM can find support and rally to break away from the large-cap heard (and maybe even lead them to victory).
Hit that 👍 button to show support for the content!
Help the community grow by giving us a follow 🐣
-----
Support:
S1: The S1 S/R flip is the primary support here, being used as a clear pivot point previously. Buying here with a target of R1 or R2 makes a lot of sense. The sort of bullish continuation a rally off of S1 would create is exactly what XLM fans want to see.
Resistance:
R1: The R1 S/R flip is a perfect target for those S1 longs. A move to R1 from S1 keeps the bullish momentum intact and provides a nice chunk of % gains to swing traders.
R2: If the bears can't defend R1, then R2 is a solid target as well. It is likely R2 sees a reaction due to this level being a significant point of resistance in 2019.
-----
Summary:
XLM is starting to look really nice here. Can the bulls continue the momentum, or is this going to be another disappointing and quick rally in a downtrend for Stellar? No one can say, we can only watch how price reacts at levels ourselves. Good luck everyone and ensure to use proper risk mitigation and pre-plan your trade!
Resources:
thecurrencyanalytics.com
✨ Drop a comment asking for an update, we do NEW setups every day! ✨
Stellarlumens

XLM shortmultiple bearish divs and huge ascending wedge on 5 min,
retested previous support as resistence
bearish smas.
target for me is .077 usd.
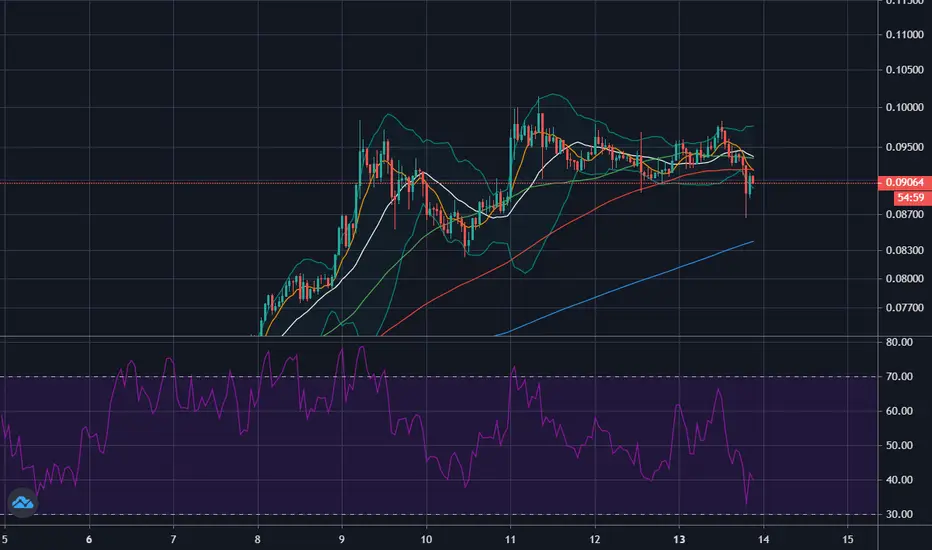
RSI Bounce level?Take a look and see for yourself. Friend of the trend. Support Resistance flipped, fast bounce from new found support, looking bullish, one hour RSI looking ready to make a turn around again. If we back test support again, look to add to a long position before this coin goes parabolic like the other alts.

Crypto Update : Maturing Alt Season & Focus on XLMHope this idea will inspire some of you !
Don't forget to hit the like/follow button if you feel like this post deserves it ;)
That's the best way to support me and help pushing this content to other users.
Kindly,
Phil

XLMBTC - Looks strong to get higherXLMBTC is interesting to observe. It looks like a good pump candidate, at resistance (tested multiple times), but rising sharply.
Good entry point - retest/close above the resistance. A strong pump looks reasonable after the resistance break.
Hit the "LIKE" button and follow to support, thank you.
Information is just for educational purposes, never financial advice. Always do your own research.

XLM - get aboard !!! Backtest almost complete !
Price is touching the bullish channel from above after the breakout !
Volume confirmation.
OBV still rising.
Get aboard while you can.

XLM following ADAPlease feel free to comment or challenge me on my TA. If you like my idea, please leave a like to show support.
--------------------------------------------------------------------
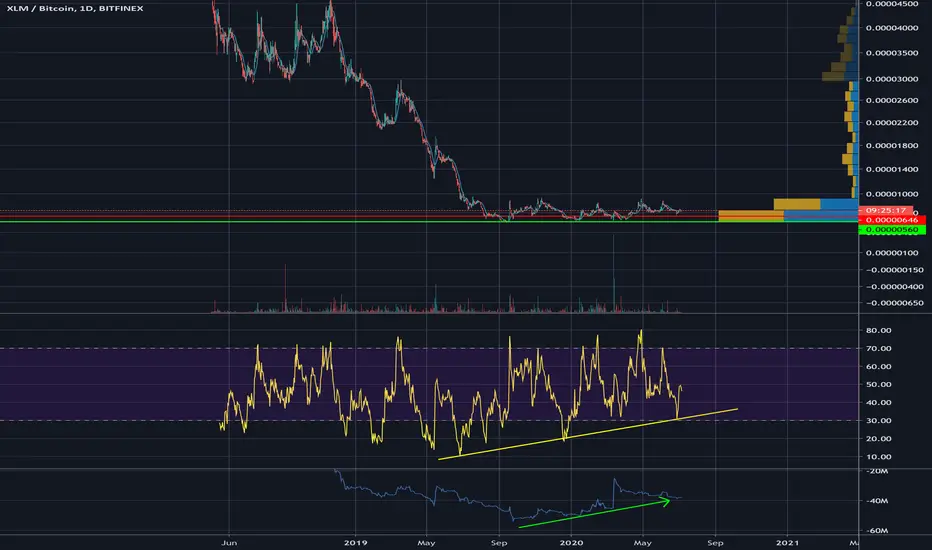
- XLM broke through the 12-month consolidation range
- Closed and rose further on the daily chart
- ADA has done the same this month and went on a 110% bull run. Should XLM follow the same path we'll end up around 1915 sats. Almost double of where we are now.
Targets:
+110% from range (1915 sats)
Weekly resistance (2105 sats)

Stellar [XLM/USDT] on July 9 (#XLM #XLMUSDT)XLM is no longer in a good position to buy anymore and has reached resistance level at 0.085-0.089$. We expect it to return to the lower zone of 0.058-0.063$, even further than 0.045-0.05$ and will consider buying.
In case the price doesn't return, we will wait for it to break the 0.09$ resistance level, the target is 0.15-0.16$
XLMUSD turned bullish from potential reversal zoneHi friends hope you are well and welcome to the new update on XLM. In my previous article I told you that the Stellar is going to start the formation of the right shoulder at this time the price action is moved up and started the formation of expected right shoulder. Now let's have a look that whether this shoulder will be completed or the price action will move upward and this pattern will be invalidated.
Head and Shoulder formation:
If we take a closer look at the daily chart then while forming right shoulder the price action moved up than the level of the left shoulder. However, at this time the price action is below the head level. Therefore unless this head level will be not broken out the Head and Shoulder pattern will be validated
The SMAs:
Now if we watch the different simple moving averages on the daily chart with the time period of 25 50 100 and 200. Then the priceline previously broke down the 25 and 50 simple moving averages. On 27th of June 2020 at the same time the price action tested the 100 and 200 simple moving averages as support and moved up again. At this time the 25 simple moving average has been broken out and the price action is likely to breakout the 50 simple moving average.
Bullish BAT pattern:
In my previous article we have seen that the price action was forming a bullish BAT pattern. Finally priceline of XLM entered in potential reversal zone of this pattern and moved little bit down but again turned bullish and surged more than 50%.
But if we watch at the Karaken exchange then the price action formed a bullish Crab. As the leg was extended between 1.27 up to 1.618 Fibonacci retracement level.
A strong support of an up trendline:
On the same daily chart the price action has found a strong support of an uptrend line. Whenever the price action is moving on this trendline it is taking bounce very well. On the chart we can see that since 27 June the price action was moving sideways on this line and finally on 6th of July the price action of Stellar again turned bullish.
Conclusion:
As the price action of Stellar is breaking out all the moving averages again on the daily chart and also took bullish divergence from the potential reversal zone of harmonic patterns. It is also bounced from the uptrend line as well. Therefore we can expect that Stellar is turning bullish however the Head and Shoulder formation is still there unless the price action will not break out the price level of head of this pattern.

XLM/BTC - going further up?It is only missing volume and you should be wary of BTC dump taking it down with it. BTC dump will depend on SPX dump which depends on employment data today.
If data is good, BTC should have room to go to around 9.4-9.5k but it would probably top there due to a confluence of resistance. It could go down to 8.6k before renewing but let's not rely on the crystal ball but rather look at what is in front of us.
For this trade on XLM I would either wait for a small pullback - that means waiting out the move today from SPX and BTC and then enter long or just go long now with a stop-loss below trendline.

XLM finally cleared weekly smas, BULLISHafter a long range of accumulation and alt szn being more obvious than ever we can see the next weekly sma resistance would be around .000016 BTC. On the monthly the upper BB band would be at .000027

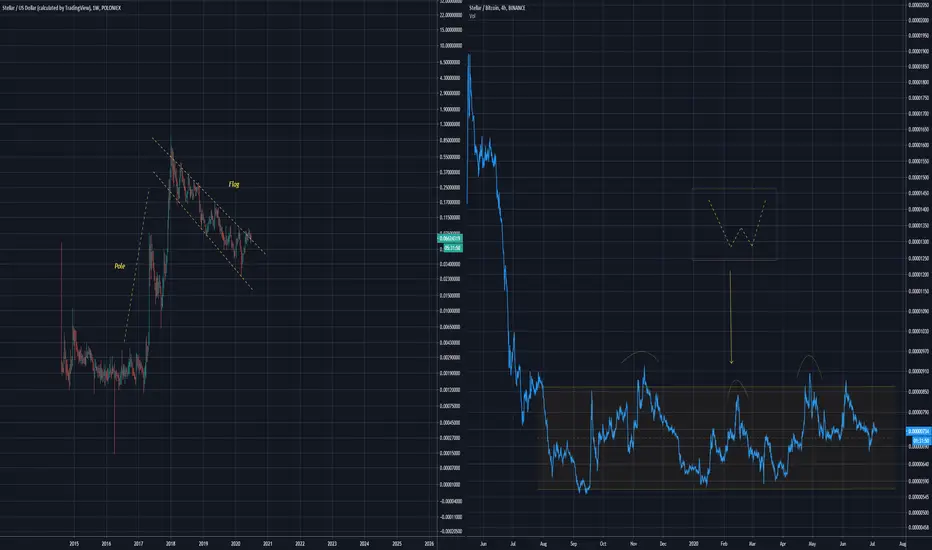
Stellar - looks like a bullflagBig bull flag in play
Nice long opportunity
Price looks quite stagnant on the BTC pair but can easily change due to the W formation
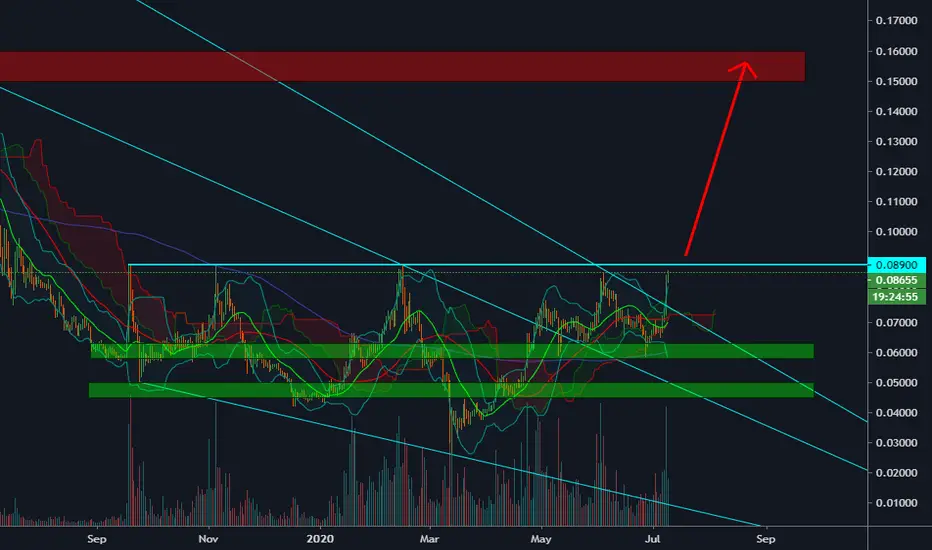
Long term basing pattern - preparing for a BIG move !!When I first got back in at the beginning 2020 at 560 satoshi I did not realize yet that it was THE bottom for Stellar !
So I got shaken out of it during the "COVICRASH" in march 2020.
Today I realize that XLM is basing out beautifully and preparing for a BIG move (big base - big move). SIDEWAYS PATTERN FOR ALMOST 12 MONTHS !!
OBV is rising consistently.
Volume is solid also... there was a HUGE volume spike on 13th march when I sold !! That was the panic low ! THIS DATE IS NOT CASUAL and means a lot in occult terms ! 13 03 2020.
RSI is rising consistently and is forming a positive divergence to the (sideways moving) price.
It is time to take a position.
This morning I sold 50% of my VET position after a 100% run and bought XLM with the proceeds.
XLM is one of the chosen ones and its future will be stellar !

XLM history repeats? Please feel free to comment or challenge me on my TA. If you like my idea, please leave a like to show support.
--------------------------------------------------------------------
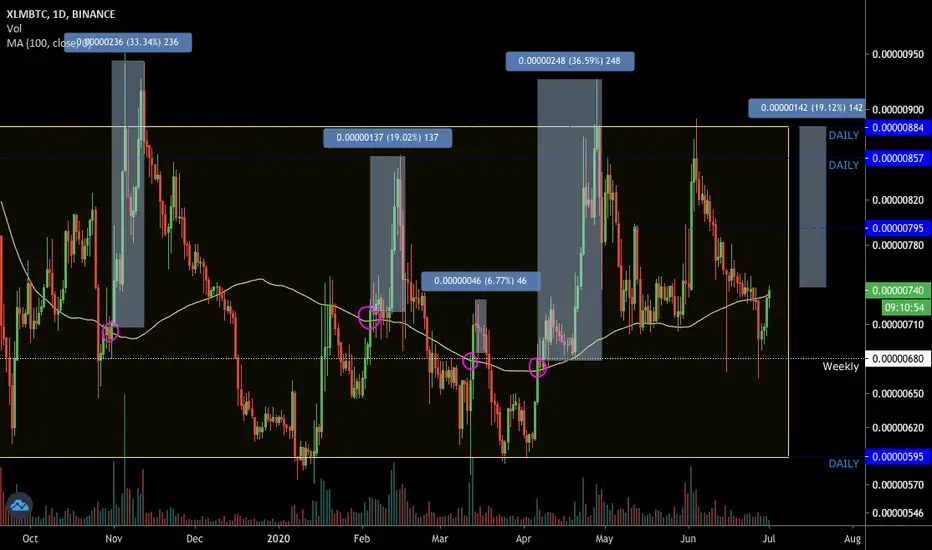
Stellar has been trading in this range ever since the beginning of Juli 2019. A breakout is waiting to happen, but in the meanwhile she has given us several nice opportunities to make some profit.
Since November price has gone from below the 100-MA to above it on four occasions. All of which have led to an increase in price. Three out of those for were very nice trades between 19% and 37%. One of them was just a little under 7%.
Price has now once again crossed above the 100-MA and the setup is looking good. Depending on how the day will end, we might see three white (green) soldiers appear.
Entry: now
Target 1: 795 sats (daily resistance)
Target 2: 887 sats (daily and weekly resistance and the top of the consolidation channel)
Mind you though, this is a risky entry as we might also see a further retracement back towards the bottom of the channel. Make sure to set your stop loss.
No financial advice.
XLMUSD an expected Head & Shoulder moveHi guys hope you are well and welcome to the new update on a Stellar. As in my previous post we have seen that the Stellar had started a correction really now in this article we will try to understand how much the price action can be moved more down.
The bearish Shark has done its job:
On 8th of June I posted an article where I revealed that the price action of XLM has completed the Shark pattern on long term weekly chrt. At that time and the price action just spiked in the potential reversal zone. Therefore there was strong chances of correction rally. Below was the pattern:
Now below is a current situation and you can see that the price action has been retraced up to 0.50 Fibonacci retracement level.
The price action is rejected by $0.08 resistance:
Now if we switch to the 2 day chart then the different support and resistance levels can be clearly noticed. At this time the price action is moved back to the previous support at 6 cents after rejection from 8 cents resistance. This resistance level is very strong for the price action of Stellar as the price action never able to cross up or break out this resistance since after it was broken down in August 2019.
In case the price action will break down the $0.06 support then we have the next support level $0.04.
And if the price action will break out the 8 cents resistance then we have the next resistance level at $0.10. And then next resistance will be at 13 cents. And if this $0.13 level will be broken out then from 13 cents up to 20 cents there is no significant resistance can be seen. Therefore within very short period of time the price action can move from $0.13 to $0.20.
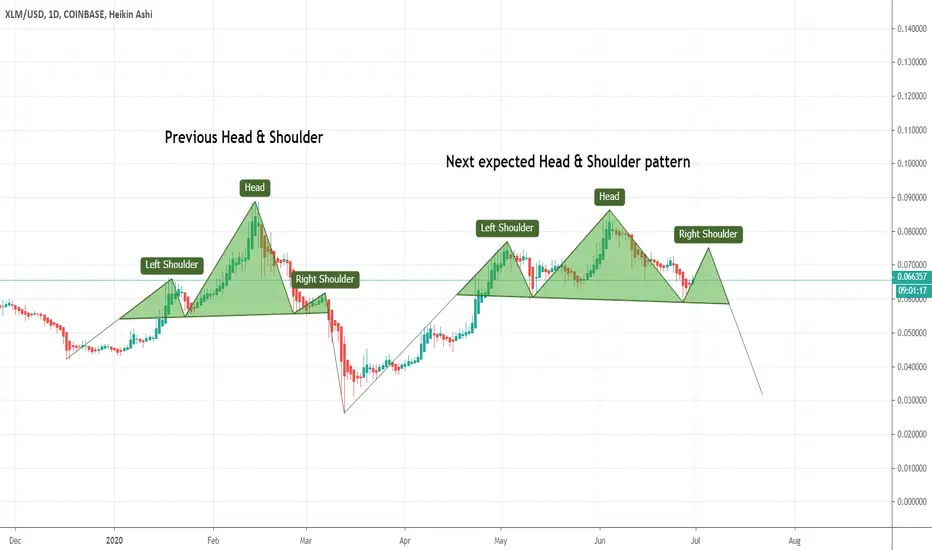
An expected Head & Shoulder move:
At this time the price action is likely to form a Head & Shoulder pattern. Before this we have already seen the formation of Head & Shoulder pattern from December 2019 to Mid of March 2020. At this time the left shoulder and the head has been completed and from the neckline the price action is moving upwards and likely to form the right shoulder.
An expected formation of Bullish Crab:
With the Head and Shoulder move the price action of XLM is also likely to complete the final leg of bullish Crab pattern. So far the price action has spiked very close to the potential reversal zone. Therefore we can expect that before the completion of the right shoulder of the Head & Shoulder pattern the price action may hit another spike up to potential reversal zone to complete this final leg.
Conclusion:
From this level we can expect an upward short-term rally then a downward move can be expected up to the neckline of the Head & Shoulder pattern.
Stellar Aim for $2Stellar chart
Using fib spirals to plot potential tops
This is one of the coins that i have seen that has the most % increase possible, from its spiral target

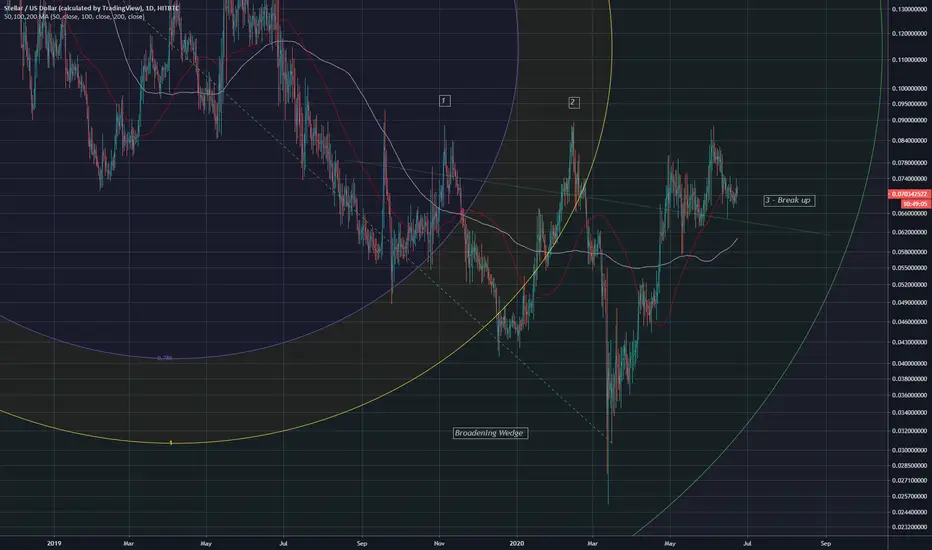
Has stellar bottomed?Big wicks have that previously have formed touch 1.618 on fib circle
Broadening wedge is forming with a clear break above it the wedge on the third touch, which is the usual case
Interesting price action how it is move up along the Fibonacci circle, creating the wedge.
STELLAR LUMENS ☣️ | 8 Reasons You should be Talking About XLM➡️➡️ With the XLM protocol 13 upgrade live, and with the long term bearish trend finally starting to reverse, it is looking like there might actually be some reason for XLM bulls to celebrate again.
Now let's look to see if the bulls can take this uptrend as shown by Fractal Trend (Aqua bar color) and turn it into a proper launch pad from some of these horizontal levels!
Support:
XLM has had a solid recovery since the COVID crash, and it is no surprise that we are now seeing some consolidation.
Although some consolidation is healthy, the bulls aren't going to want to give up too much more ground here. What the bulls want to do is hold the S1 orderblock formed at the most recent swing low to put in a nice higher low in the current consolidation range.
If S1 doesn't hold, the S2 and S3 orderblocks could hold to at least put in a higher time frame higher low and break the clear downtrend pattern (although obviously a test of these levels fully jeopardizes any hope at an immediate bull run).
Resistance:
The first point of resistance for the bulls is the R1 orderblock formed at the previous breakdown. Taking R1 out and at least testing the R2 previous swing highs is vital for the bulls to show strength and to maintain the newly formed uptrend.
The bulls will have momentum on their side with a break of R2, but have a good amount of resistance overhead due to the long-term downtrend XLM has been in.
The next level of resistance to contend with after R2 is the R3 orderblock formed during the prior breakdown.
If the bulls can get past R3, then the R4 and R5 orderblocks should at least see a reaction. A break above R5 is likely to have XLM looking rather bullish, but future levels would have to be assessed if and when the bulls get us there.
Summary:
The XLM bulls finally have a reason to be hopeful. It has been a long time coming, but it looks like the tide could be turning (so if the bears want to keep that long term downtrend intact, they better act fast).
In order for the bulls to show us they are serious however, they will need to take out that R2 orderblock. The simplest and easiest way to do this is to find support at S1 and make the push ASAP. So the bulls should be hoping to see that.
Resources:
btcmanager.com
Hit that 👍 button to show support for the content we produce and help us grow 🐣

XLMUSD a possible bullish reversalHi friends hope you are doing well and welcome to the new update on Stellar. As after hitting the resistance of channel the XLM has dropped more than 24%. Therefore in today's article we will try to understand what the price action can do next.
Bearish Shark pattern has done its job:
In my previous article I revelaed that the price action of XLM has formed bearish Shark pattern on weekly chart and it was expected that the price action will be moved down from here. After heating the potential reversal zone of this pattern now finally the price action has dropped and it has been retraced between 0.382 to 0.50 Fibonacci level.
Up channel and synchronization of price action with indicators:
Now if we switch to the daily chart. Then XLM has formed an up channel like every top cryptocurrency including Bitcoin. The movement of the price action within this channel was very much synchronized with stochastic, MACD and Momentum indicators. Whenever the price action reaches at the supported the stochastic gives bull cross and MACD and momentum indicators turn bullish. The price action follows the signals of these indicators and moves up and hits the resistance of the channel. We have witnessed this move in the month of April and then in the month of May 2020. Recently the priceline again moved at the support of this channel and stochastic and MACD both turned bullish together but so far the momentum indicator is strong bearish. Therefore the price action finally has broken down the support of the channel. And after breaking down the channel the stochastic has given bear cross again.
Support and resistance levels:
We can watch the different support and resistance levels on 2 day time period chart. After March 2020 first the price action broke out the $0.045. Ater breaking out Stellar retested the previous resistance as a support and moved towords next resistance of $0.06. And after breaking out the this resistance level the price action again re-tested this resistance as support and moved up to the next resistance level of $0.08. The $0.08 is one of the most strongest resistance level for the price action of XLM. And this time the price action is again not able to break out this resistance level and after being rejected it is moving back towards the previous resistance of $0.06 to re-test it as support.
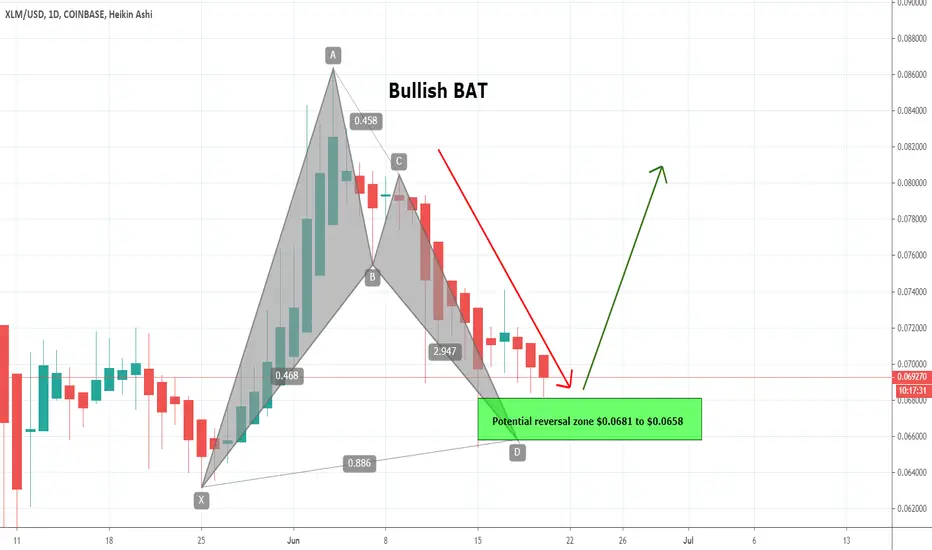
A bullish reversal harmonic move:
If we switch back to the daily chart then it can be easily seen that after breaking down the channel price action has completed the formation of a bullish BAT pattern. This is a bullish reversal pattern therefore there is a possibility that the price action will take the bullish divergence from the potential reversal zone that is defined as per Fibonacci sequence of harmonic bullish BAT. But this potential reversal zone should be set as a stop loss. Because once this PRZ level will be broken down then the price action can move more down to complete the final leg of bullish Crab pattern.
Conclusion:
Even though all indicators are turning bearish and the channel support also has been broken down but there is a possibility that the price action will be reversed bullish as it has completed a harmonic bullish move.
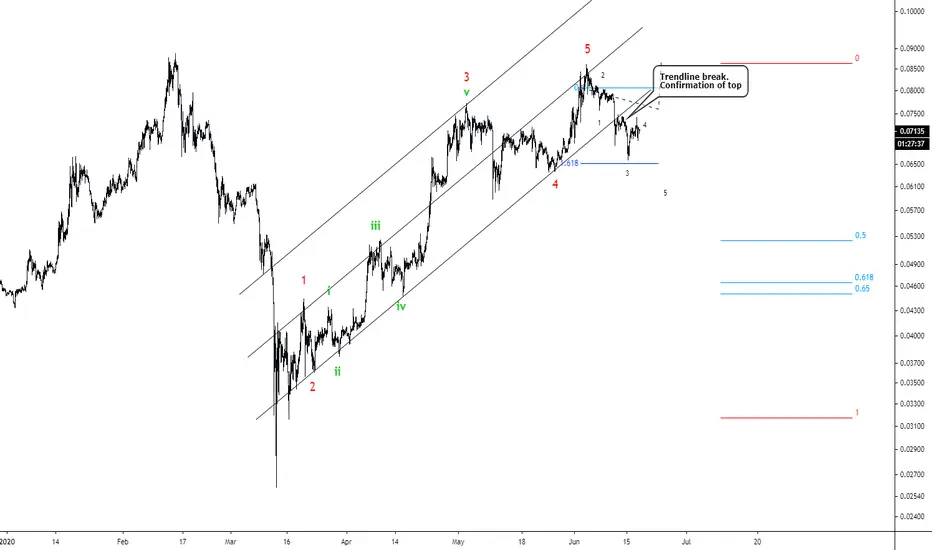
XLM is the main issue in my eyes to a bullish bias. 1) Rather clean impulse from the low
2) Clean break of the #elliottwave channel
3) Move down from the top looks impulsive (at the difference of many other alts).