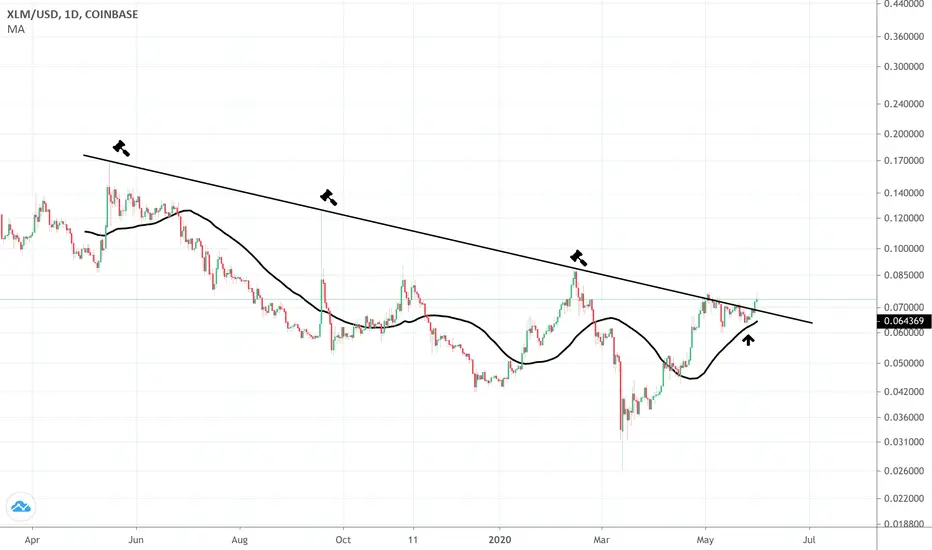
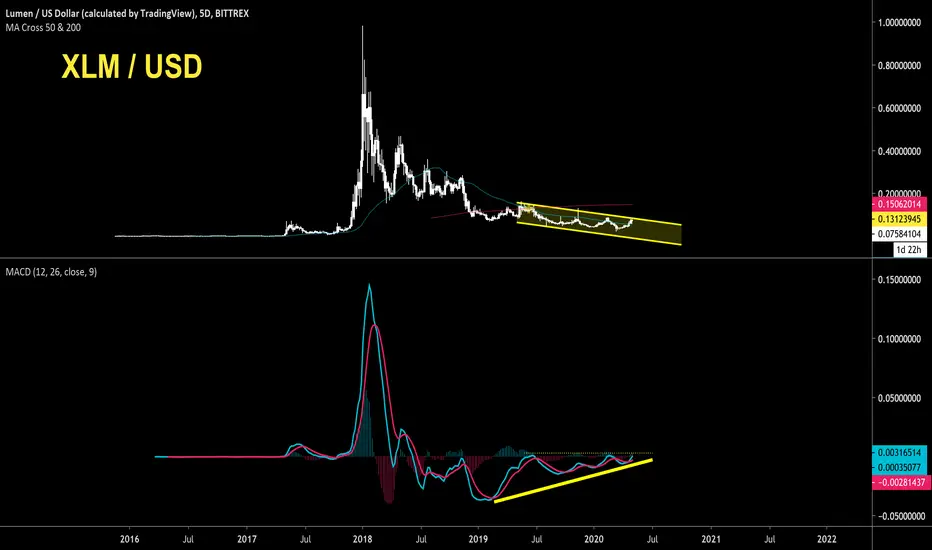
XLMUSD | An opened alligator mouth is expected for bullish rallyHi friends hope you are well and welcome to the new update on Stellar. Today in this article we will see how the XLM is turning more and more bullish to achieve the highest price ever in its history. But this time the Lumens is also giving some bearish signals on the short-term let's watch the bearish signals first.
Formation of bearish Shark:
On the weekly chart the price action of XLM has completed the formation of bearish Shark pattern. Even though it is difficult to identify that the initial leg is separate or the continuation of the previous movement because the upward movement up to X point Is not as that much long as we can easily declare it as a separate leg. However if we forget the previous movement of the price action and take it from the X point then a complete Shark has been formed. And price action has already visited the potential reversal zone of this Shark. Therefore there is possibility that the priceline will be dropped from here.
Movement in up channel with synchronization with indicators:
On the daily chart the price action of XLM is moving within an up channel. And after hitting the resistance of channel it is likely to drop down again. And the movement within this channel is very much synchronized with the combination of indicators: 1.momentum 2.stochastic 3.directional movement. If we take a closer look at the chart then it can be easily observed whenever the price action reaches at the support of this channel and momentum turns bullish and stochastic also gives bull cross and finally when the positive directional indicator forms a bull cross with the negative directional indicator then the price action turns bullish and reaches up to the resistance of channel. It can be seen in April and also in May 2020. At this time the positive directional indicator is above the negative direction indicator that is the bullish sign. And the ADX is also up that is showing the power of bulls. But now the positive directional indicator is moving down to form bear cross with the negative directional indicator. If this bear cross will be formed then the same ADX will be assigned to the bears and it will be showing the power bearish trend.
Support and resistance levels and moon phases:
After the mid of March 2020 the price action of XLM turned very strong bullish and it broke $0.045 and then $0.06 resistance levels At this time the price action of Lumens has reached at the resistance of $0.08. This resistance level is very strong as on the chart it can be seen that since September 2019 the price action has made several attempts to breakout but so far it is not able to breakout this resistance level. I have also placed the moon phases indicator on this chart. This is very useful indicator to identify the bullish and bearish trends. On the chart we can see there are some full moons and some dark moons. The distance between one moon to another moon is called synodic cycle that is 29.5 days long. The recent dark moon is appeared at the support level of $0.06. That is an indication that it will be difficult for the priceline to break down this support. And the recent full moon it appeared at the resistance level of $0.08. That is showing that the maximum reach of the price action is up to this level. Therefore we need the next dark moon to be appeared above the $0.06 level and the full moon should be appeared more up in order to have break out from $0.08 resistance.
The Stellar is breaking out the falling wedge:
On the weekly chart since January 2019 the price action of Stellar is moving within a falling wedge. I have also placed the volume profile on the complete protection moving within this wedge pattern that is showing the traders interest up to 10 cent. And if we take a closer look at the Bollinger bands then it is moved above the resistance of this wedge pattern. Therefore it was easy for the priceline to cross up the resistance level. Now finally the price action of XLM has crossed up the resistance of the falling wedge. And at this time the new candlestick is opened above this level but the breaking out from this wedge pattern depends where this candlestick will be closed. If it will be completely opened and closed above this level then we will have a successful break out from this pattern. And after breakout if the price action will retest the resistance of this wedge pattern as support then Stellar may drop up to 6 cents before the next rally.
Simple moving averages can form an opened alligator’s mouth:
If we watch the position of the different simple moving averages with the time period of 25, 50, 100 and 200 then we can notice that these SMAs are turning strong bullish. If we take a look back at 2017 chart then it can be observed when the 25 simple moving average crossed up all other simple moving averages and the 200 simple moving average move below on others simple moving averages then a complete opened alligator mouth was formed by these SMAs. That produced more than 4000% strong bullish rally. Same as like that the simple moving averages are forming an opened alligator mouth. At this time the 25 simple moving average is moved above all other simple moving averages then we have 50 SMA but so far the 200 simple moving average is moving above 100 SMA. And these two simple moving averages are moving sideways for the long time. Once the 100 SMA will cross up the 200 SMA then a complete opened alligator mouth will be formed that can produce more powerful bullish divergence.
Repetitive harmonic move:
At the end I would like to recall the repetitive move and that is the formation of bullish BAT pattern on the monthly chart. If you take a look back at 2017 chart then the price action of Stellar formed the same BAT on the weekly chart. And when the Stellar moved up from the potential reversal zone it produced more than 4000% massive gains. This time the BAT is formed on the bigger time period chart. Therefore there is possibility that the priceline will produce more profit than the previous rally. However as per Fibonacci sequence of BAT pattern we can set our buying in sell targets as below:
Buy between: $0.11 to $0.059
Sell between: $0.23 to $0.41
So realistically as per above targets the Lumens can produce up to 600% rally.
Conclusion:
As recently the price action of XLM has reached at the resistance of the channel that is formed on the daily chart and on the weekly chart the new candlestick is just opened above the resistance of the wedge. Therefore there is a possibility that the price action will start a correction rally to retest the resistance of wedge as support of wedge and to hit the support of the channel as well. However after this correction rally a new bullish move is expected.
Note: This idea is education purpose only and not intended to be investment advice, please seek a duly licensed professional and do you own research before any investment.
Stellarlumens

XLM ready for take-offPlease feel free to comment and challenge me on my TA. Hit a like to show support.
------------------------------------------------
- Ranging since 07/2019
- Significant increase in volume
- Range high (886) is very close to being broken
- Chart looks exactly the same as the Cardano chart before it skyrocketed
- Next resistance at daily level (1274)
Waiting for confirmation above range high before I enter.

XLM SOLID BREAK OUT IN PROGRESSXLM printing a break out of long term resistance
added more to my bags for fun
not financial advice
XLMETH SHORTSELL W BOTTOM IN EFFECTXLM is a wonderful token that aims to serve as sort of "currency conversion wood chipper" where you can shove virtually any currency: beit, USD, EURO, YEN, CAD , or even cryptos (including all ERC20 of the 5500 current coins/tokens listens on the market) which is a lot of cryptocurrencies -- well over 2,000* (*fact check me on that)* though the point is: XLM serves to be the intermediary, bridge, gap to convert other currencies into a singular universal currency which then proceeds to have XLM tokens be the effective future 'stabelcoin' focused solely on transnational data.
Needless to say, XLM will play a QUINTESSENTIAL role in global integration -- particularly when it comes to seeing cryptocurrencies transcend from store of value to everyday transnational use.
Factor in the 600 million unbanked in SouthEast East; this is a recipe for success, if the PR, marketing, usability, scalability, (as well as other cards/variables) are played correctly.
Please defer to my last publication where I included a shortsell signal for ETH at 204.90 (around there, linked below) -- which we proceeded to close later that evening; included in the oped is my detailed reasoning & belief as to why in addition to publishin a LONG next to a forexsignal publication that had nothing but shortsell targets if you took notice to read -- you'd have bothered to pay attention and see that the publication in itself was for LONG (SUPERLONG) I believe I said; whereas the forexsignals in themselves were shorts.
As projected; my analysis was correct ...by the end of the week ETHUSD was looming around $234.40 up a staggering 18.12% from the time of publication...and again; this was a LONG publication.
IN the meantime, it's great to take advantage of certain pairings to "stack sats" and collect more #ETHUSD if you're as bullish as I am on it for the longer duration.
Included is this XLMETH short entry that was just too juicy for me to not share with ya'll ; so I decided to hop on and post a publication.
Due to the volatility of current market consolidation periods; I wouldn't suggest posting any longer than SHORTSELL publications (in good confidence) and be absolute in my / whoever's TA's own certainty -- that would be in bad taste & a falsehood : intentionally misleading.
Hence; I've provided a short signal for XLMETH, which in addition to many others, Cardano esp. is ripe with opportunity for quick ERC20/ETH pickings.
Trade Safely, stay healthy, and R.I.P. George Floyd.
Peace & Love
@a1mtarabichi
(all horizontals, including green TP1-3/blue pivot, and most important: red are in publication)
Disclaimer
Note: This is strictly conjecture based on my own technical analysis and not any information based on any sources from the GOP Or federal government/treasury dept / ay institution of any form this example is for educational purposes only and should not be relied upon for any other use. Please invest responsibly and make all decisions based on your head; not your gut. Any projections or figures provided in this analysis are Forward-looking statements And have no basis Other than my own opinion and not information related to the GOP , SEC or wall sf in general. Just the wiz doing what he always did best — Disclaimer must be extended and extensive So forgive me as I need to truly emphasize None of the information obtained in conducting this analysis was provided by insider trading in anyway shape or form.
Certain information set forth in this presentation contains “forward-looking information”, including “future oriented financial information” and “financial outlook”, under applicable securities laws (collectively referred to herein as forward-looking statements). Except for statements of historical fact, information contained herein constitutes forward-looking statements and includes, but is not limited to, the (i) projected financial performance of the Company; (ii) completion of, and the use of proceeds from, the sale of the shares being offered hereunder; ( iii ) the expected development of the Company’s business, projects and joint ventures; (iv) execution of the Company’s vision and growth strategy, including with respect to future M&A activity and global growth; (v) sources and availability of third-party financing for the Company’s projects; ( vi ) completion of the Company’s projects that are currently underway, in development or otherwise under consideration; ( vi ) renewal of the Company’s current customer, supplier and other material agreements; and ( vii ) future liquidity, working capital, and capital requirements. Forward-looking statements are provided to allow potential investors the opportunity to understand management’s beliefs and opinions in respect of the future so that they may use such beliefs and opinions as one factor in evaluating an investment.
These statements are not guarantees of future performance and undue reliance should not be placed on them. Such forward-looking statements necessarily involve known and unknown risks and uncertainties, which may cause actual performance and financial results in future periods to differ materially from any projections of future performance or result expressed or implied by such forward-looking statements.

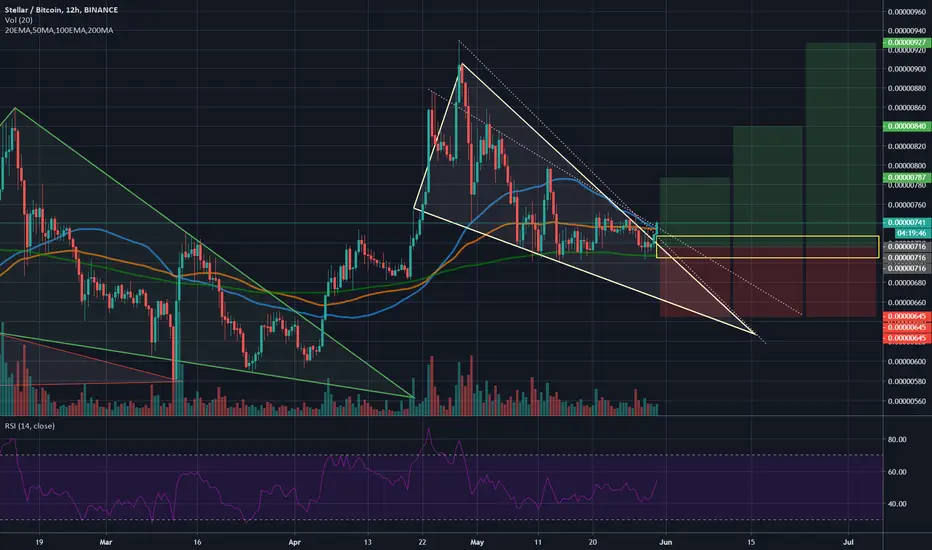
XLM/BTC Bullish Signal
XLM is showing similar signs of price action to that of ADA (Cardano) before breaking out.
My advice would be to buy here and take profits in the levels mentioned in the chart
Be sure to drop a like to support me, so that i get motivated to make more charts :)

XLM/BTC 12H (Binance) Falling wedge breaking out Stellar Lumens looks bullish again, in the past those wedges broke-out well so I'm expecting history to repeat itself.
(E)MAs are acting as support now so that would help going up, I'm entering right now but will add more if pulls back in the yellow zone.
Current Price= 0.00000741
Buy Entry= 0.00000727 - 0.00000705
Take Profit= 0.00000787 | 0.00000840 | 0.010108
Stop Loss= 0.00000645
Risk/Reward= 1:1 | 1:1.7 | 1:2.97
Expected Profit= 9.92% | 17.32% | 29.47%
Possible Loss= -9.92%
Fib. Retracement= 0.382 | 0.618 | 1
Margin Leverage= 1x | 3x | 5x
Estimated Gain-time= 720h
Crypto Update : Relative Strength Analysis of AltcoinsHope this idea will inspire some of you !
Don't forget to hit the like/follow button if you feel like this post deserves it ;)
That's the best way to support me and help pushing this content to other users.
Kindly,
Phil

XLMUSDT under the law of FibonacciWell i will try to be clear :D and make understand what i think.
i traced a Descending Fibo on XLMUSDT Pairs and compared with falling EMA's 50/100/200
Yellow Circles are fibo Rejections.
Orange Circles are EMAs Rejections.
i checked mostly all indicators but i don't add them to not make confusions.
what can i say on indicators is Weekly Show indicators RSI High, StockRSI high cross down, MACD Bearish.
Monthly is too young to check with USDT pairs but looks good on XLMBTC Pairs. Everything is crossing up.
After that said, i made own deduction but like i always say ' Everything can happen in Cryptos '.
What we can see for now is XLM still under descending depression and not looks ready for a big rocket pump.
le'ts talk about Numbers :
Scenario 1 Short Term
if XLM break 0.08 clearly! we can consider to start to be bullish if and only if XLM break 0.11 to go try break his first big resistance at 0.12 (0.382Fibo),
in this case confident Traders will enter the market and push XLM to 0.17 (0.618Fibo)
Scenario 2 Long Term
XLM will continue to retrace under depression and surely also BTC dominance, it will fall dipper to 0.015 to start again moving up when the altcoin bullrun happening.
Conclusion
For now have to be S4Fu ! You can still play as i do as a marging Trader but you always have to buy your loved crypto at a good price to not be trapped!
There is a rule i always apply to myself and this rule is my absolute number one : THE BEST WAY TO WIN MONEY WITH TRADE IS TO NOT TRADE !
Try to thing about that philosophical rule and u will find the logic in my words and the way to go....
Happy Tr4Ding !!!

Stellar, Buy bullish Breakout of Triangle topStellar is looking very bullish right now. We are expecting the price to break the top of the triangle and go towards the highlighted resistance area.

XLM 1-Week Projections (May 28th)Hey all, welcome back. I've decided that I was decently close on my last chart for the price action that happened the last few days, originally was working on a 4 hour chart but changed to 1 day. I think the trends I've set in red here at the end of this triangle will happen, but no certainty that it will happen exactly as I think it will. If the red wave I've outlined completes, it could show some sort of symmetrical triangle but honestly at this point I'm still learning and having fun with it.
I think we will retrace back to our previous peak from weeks ago, could even hit some resistance, could go a little bit beyond the last peak, but I have no assurance, and these are just some ideas. If that happens, what comes after is something I am still working on, so fyi that big red trend downwards doesn't mean anything other than I feel some significant bearish moves could still be coming. Might be able to update you guys in the near future :)
I might try to look deeper into golden/death crosses on my next chart, but if anything it will only serve as a resistance confirmation for how steady we stay in whatever regions we land in. I have linked my last chart below and as a related idea.
I am currently taking an online class with Trade Crypto Live Education and learning more than ever, and I DEFINITELY recommend you check them out if you want to further yourself as well. I'm also having fun with Cindicator predictions and am up 800+ points in crypto forecasts for the last month, excited to see what the "pro" challenges will look like for the first time!
Original chart (published May 24th 2020) on 4H:
Have a great day everyone!
Thanks for tuning in :) Disclaimer, I am not responsible for any losses incurred while attempting to use my data, I hope this can prove to be some sort of learning tool for some and give insight as to how I personally come up with my own numbers. Take into full consideration this could be a completely bad forecast. Cheers

Ethereum (ETH) & Crypto Market: BTC Halving dip then POP?!Bitcoin's 2020 halving is upon us. Let's watch as all other cryptos ride it's wave. While someone will fail to keep up, I think Ethereum is going to stick to it pretty closely.
Here are some promising looking arrows that point down and up :D Could be a triangle, I don't f**king know LOL. I believe in Ethereum's blockchain technology.
Watch the dip and profit on the pump up. The global COVID-19 pandemic is having unpredictable effects on the economy. Let's see how this plays out. It's going to be an interesting year.

XLM/USDT - triangle accumulationYesterday I made a long-term forecast
On the day timeframe, I look towards the shorts:
I'm looking at the bong locally.
The triangle is formed before the level. Makes an accumulation for breakdown.
After the breakdown and fixing the input.
Stop Loss is set to the level.
Push ❤️ if you think this is a useful idea!
Before to trade my ideas make your own analysis.
Thanks for your support!

Bitcoin (BTC/USD): Accumulation before the next peak 2020-2021?Here's an update on my Related Idea:
If the trends during Bitcoin's previous halvings tell anything, it's in the ~12 months following, Bitcoin prices experience a rapid bullish cycle. This cycle seems to proceed after a dip. I'm guessing this is a good place to accumulate more. This is all a guess. Let's be real, the halvings only happened twice. It's not enough evidence for a pattern. But if history rhymes, it looks like a breakout of this triangle around May 2021.
Coincidentally, the triangle formation ends about 12 months from the halving. I *hope* for a breakout by this point. The next peak would tower over the last one.
Thanks for checking out my chart astrology =) Let me know your thoughts.

XLM/USDT - accumulation under the level.On a weekly timeframe, accumulation under the level.
Where the price will be canceled to look.
Upward movement will be a continuation of the growing trend.
Going down ... ...you know)
On the day timeframe:
It is worth paying more attention to the accumulation marked with a gray square.
Averages moving under the price, it means a bullish trend. The fall of EMA 186 was held back by the semi-annual price averaging.
The AO indicator shows the strength to go down.
RSI on the verge of trend change above level 50. There will be a trend change on the breakout.
We have to wait to get out of the zone, and then trade.
Push ❤️ if you think this is a useful idea!
Before to trade my ideas make your own analysis.
Thanks for your support!

#XLM STELLAR ELLIOTTWAVE MICRO VIEWIf there is no error in Elliott Wave count, 0.0444 level is the decision point for xlm . Bearish below 0.0444, bullish above.

XLM under hidden bullish divergence pressure.Hello guys, I am back with another Idea.
Stellar Lumens, XLM pair that is somehow connected to XRP movements and is outperforming them.
Looks like XLM has some Hidden bullish divergence as the price is making higher lows, but the RSI is making lower lows.
XLM is still on uptrend and is currently cooking in a very strong resistance area, now in a 1h Bull flag,
If the bull flag fails, which can happen if Bitcoin see a sharp move down, I suggest buying at the uptrend line.
Good luck with trading!

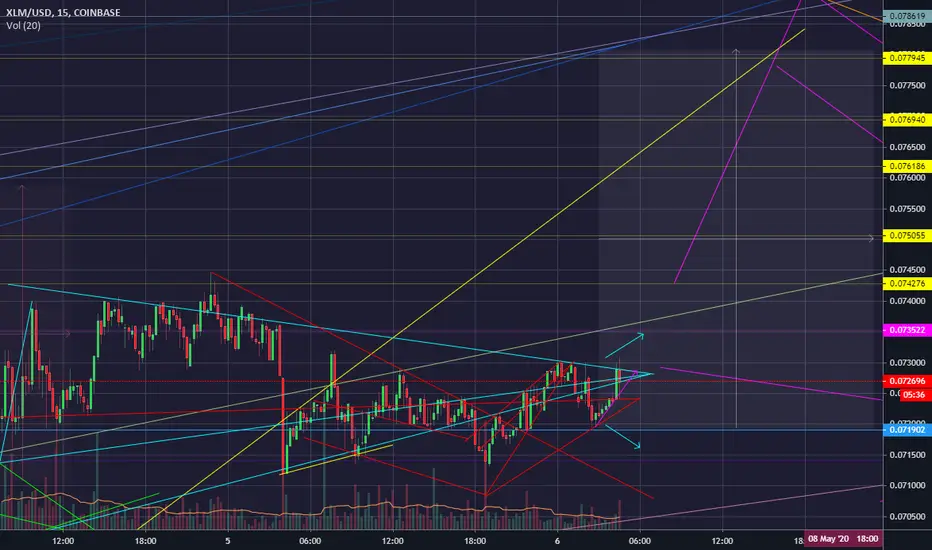
XLM May 6th 2020 Breakout Zone?This is meant to be an idea for a breakout pattern to signal our next major move up over the next day. I do believe that we will keep steady over the pattern resistance lines above $0.0724 and see major volume to pump the stellar price.
Final sell target for over the next few days if resistance is broken could be anywhere from $0.077 to be safe or $0.0779-$0.079 and lower chances of $0.079-$0.0815 range.
This forecast is deriving from multiple charts that I've made in the past 3 days:
I will be posting another update later on today if I get the chance. Follow and like for more updates on Stellar!
Thanks for tuning in :) Disclaimer, I am not responsible for any losses incurred while attempting to use my data, I hope this can prove to be some sort of learning tool for some and give insight as to how I personally come up with my own numbers. Take into full consideration this could be a completely bad forecast. Cheers
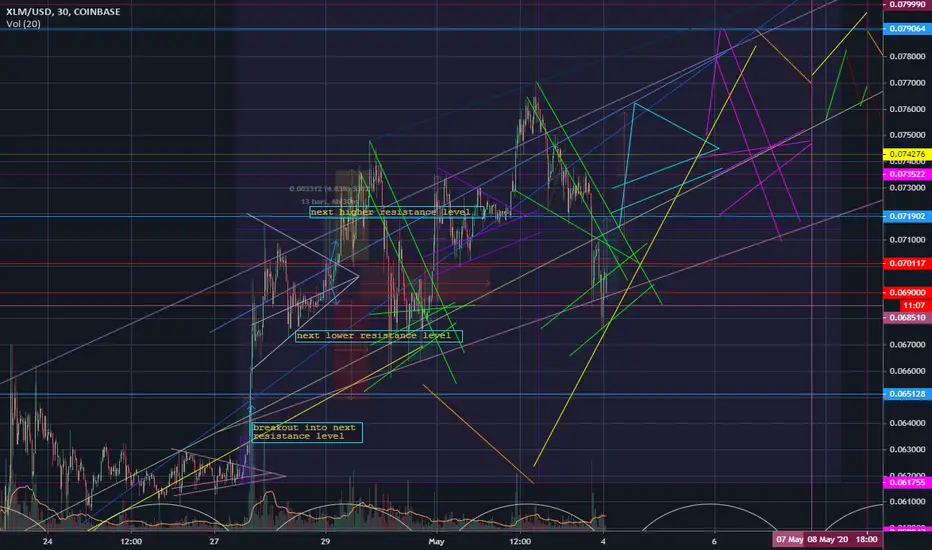
XLM First Week Of May ClosingComing in with another update on XLM deriving from my work on this chart over the last couple days.
I believe that XLM will stay in my cyan trend lines (for the most part) for the remainder of the time frame it shows on, which is around here at ~$0.071-$0.0732 until May 5th 10-11:30 PM MT , before moving up into the magenta trends at around ~$0.074-$0.0782 maybe even peaking as high as $0.079 within the magenta time period starting as early as midnight May 6th, or an hour or 2 earlier potentially. After the time period of the magenta trends, I have no true indicators to tell me it will keep going up yet, if there is a breakout we could be in for a few more rounds of upward movement but my main idea is that we will see downwards movement very soon after this chart has completed its time scale.
I have had to update the placement of the region I believed XLM would go into, specifically the cyan trend lines shown above, in yesterday's chart I may have placed it too high but still in the right time frame. For this chart, I have moved it down to give a more accurate representation of the data and patterns being made during that time frame. We are currently still in the cyan region and it seems to be repeating past patterns from within the last few days, but with more variations added to its shape, and there could be a breakout variation into the magenta trend lines happening slightly sooner or later than expected. See below for accuracies and chart adjustments against my last 2 charts.
The magenta trend lines are suspected to be the last part of this repeating pattern that I've come up with. In my first chart, it was originally due to hit later and potentially higher but with yesterday's and today's data taken into consideration, I have moved the trend more to the left and slightly under original price estimates so it will be happening slightly sooner than previously expected in my opinion.
Original Forecast
Yesterday's chart:
Today's adjustment:
Thanks for tuning in :) Disclaimer, I am not responsible for any losses incurred while attempting to use my data, I hope this can prove to be some sort of learning tool for some and give insight as to how I personally come up with my own numbers. Take into full consideration this could be a completely bad forecast. Cheers

XLM Start of May (Updated)This is a revision of the patterns and time frames updated from my last chart posted about 1 day ago linked as the related idea.
Yesterdays Forecast
Quoted from my last chart description:
> " price may drop as low as ~$0.068 in a few hours finishing a structure over the next 18 hours (highlighted by next upcoming green trend lines .)" - this event has mostly happened with a slight margin for error in under-forecasting on my end as so far it has gone as low as $0.067.
I do believe I was about 10 hours wrong on when the next period would move into the cyan trend lines but perhaps its still yet to come over the next day or as soon as 7 AM MT May 4th. May the 4th be with you.
Cheers to the reopening of the economy. Anyone who is immunodeficient should definitely stay home while everyone goes out and about. Still wash your hands regardless of a virus!
Thanks for tuning in :) Disclaimer, I am not responsible for any losses incurred while attempting to use my data, I hope this can prove to be some sort of learning tool for some and give insight as to how I personally come up with my own numbers. Take into full consideration this could be a completely bad forecast. Cheers
XLM - BULLISH MACD DIVERGENCE DETECTED - CryptoManiac101XLM / USD
Interesting observation we have here with Stellar Lumens which shows us bullish divergence in MACD on 5D / Weekly chart.
Will it result in bull market?
That's not necessarily what you should expect given the current state of the market, however this should provide more hope for those holding.
This Repetitive Move Is Leading The Stellar Lumens (XLM) To $2Falling wedge:
As we have seen in my previous article that the priceline of Stellar was moving in a falling wedge pattern. When I published my last post at that time the priceline of XLM was at the support of this falling wedge and I was waiting for two more indicators to turn bullish to predict the bullish divergence for breakout. These two indicators are momentum indicator and the stochastic. The reason I am using these two indicators to predict the breakout here because the price action of lumens is very much synchronized with these two indicators. On the chart it can be easily observed that whenever the priceline of lumen hits the support and the momentum turns weak bearish from strong bearish that is a kind of bullish signal and stochastic gives bull cross then priceline takes a bullish divergence and hits the resistance of the wedge.
I was expecting the same move this time. I am sharing the both screenshots the previous one and the current situation. It can be easily obeserved that when I shared the chart in my previous article at that time the stochastic was oversold and momentum indocator was strong bearish. In the next screenshot you can see the current situation that when the momentum turned waek barish and the stochastic gave bull cross the price action again took powerful bullish divergence as it has been doing in the past and at this time the Stellar is attempting to breakout the resistance of this wedge.
The previous move:
The current move:
Volume profile and Bollinger bands:
here the two more indicators are playing very important role one is the volume profile indicator and other one is the bollinger bands. If we place the volume profile on the complete price action moving within the falling wedge pattern then we can see that the trader’s interest is very weak below $0.038. Therefore when the priceline moved down where the trader’s interest is low the XLM turned bullish and reached the resistance of the wedge. And if we see the bollinger bands then it can be noticed that when the priceline made its first attempt to breakout the resistance of the wedge in May 2019 then the bollinger bands was below the resistance of wedge therefore it stopped the priceline of Stellar to have a breakout. After that the priceline made another attempt to break out the resistance of the wedge in Feb 2020. At that time the bollinger bands was again below the resistance of falling wedge and became a strong hurdle for priceline to breakout. But this time we have some different situation the bollinger bands is above the resistance of the wedge. Therefore the price action of Lumens can easily move out from the resistance of wedge, moreover if we observe the movement of the bollinger bands then it can be easily seen that the bollinger bands is slightly moving up and showing its tendency that it is making the way for the priceline to move up.
Bullish Crab pattern:
During the strong bearish move in the month of March 2020 the XLM has completed the formation of bullish Crab pattern. I also have shown this pattern in my previous post. If we take a closer look on the chart then it can be easily noticed that the priceline has just hit the spike in the potential reversal zone and as per sequence of bullish Crab the price line was the supposed to move up in the Fibonacci projection area of A to D leg from 0.382 to 0.786 Fibonacci level. We can see that finally the price action took a powerful bullish divergence and produced more than 93% bullish rally. At this time the 0.786 Fibonacci level is a strong resistance for the Lumen. And we can observe at this time the price line is hitting at this level for third time this is the same level where we also have the resistance of the falling wedge pattern.
Simple moving averages.
The position of the simple moving averages on the daily chart also goes in the favour of the breakout from the falling wedge pattern. If we see on the daily chart then the priceline has aggressively crossed up the 25, 50, 100 and 200 simple moving averages. Now it has the strong support of all these SMAs. And the 25 simple moving average has formed the golden cross with 50 and 100 SMAs and moving forward to cross up the 200 simple moving average. Following the 25 simple moving average 50 simple moving average is also moving up to form the golden cross with 100 and 200 SMAs. The golden cross between 50 and 200 simple moving average is considered as a strong bullish signal among the traders community. They always take it as a strong buy signal. After that we can expect the 100 simple moving average will also form the golden cross with 200 simple moving average. And after all these golden crosses we can have a complete opened alligator mouth of the moving averages below the price action of XLM that can produce more powerful bullish rally.
Long term resistance levels:
Now if we switch back to the weekly long-term chart. Then we find two major resistance levels on the way of Stellar. The first resistance level is $0.09, We can see that upto 2019 this resistance level was working as a strong support for the price action but once it is broken down in August 2019 after that the Lumen never able to cross up this resistance level again even after 3 attempts. Once the priceline will be able to cross up the 9 cents resistance then the price action may re-test this previous resistance as a support and move up to break out the next major resistance at $0.14 after breaking out this resistance the XLM doesn’t have another other resistance upto $0.23, so we can expect a faster move from $0.14 to $0.23.
Powerful bullish move that can lead the XLM to hit $2:
Now I would like to show you my favourite part of this analysis and that is the harmonic move of Stellar. If we move back in 2017 the priceline formed a big bullish harmonic BAT pattern on long-term weekly chart. And from the potential reversal zone of this BAT pattern the price action moved up with very powerful bullish divergence that leaded the Stellar to hit $0.51 that was more than 4000% powerful bullish rally. Now if we switch to the more bigger time period monthly chart then we can observe that same as like the previous move of 2017 the price action has a gain formed another very big bullish BAT pattern. And from past 5 months the priceline was moving at the bottom of this is BAT and now it has retraced back in the potential reversal zone. The potential reversal zone of this BAT starts from $0.11 and ends up to $0.059. We can expect another very big powerful divergence from this PRZ level but if I talk realistically then as per Fibonacci sequence the price action of Lumens should enter in the Fibonacci projection area from 0.382 to 0.786 Fibonacci projection of A to D leg. That is from $0.23 up to $0.41 that is also upto 600% big gain. However for stop loss we should use the potential reversal zone to minimize our risk.
Note: This idea is education purpose only and not intended to be investment advice, please seek a duly licensed professional and do you own research before any investment.

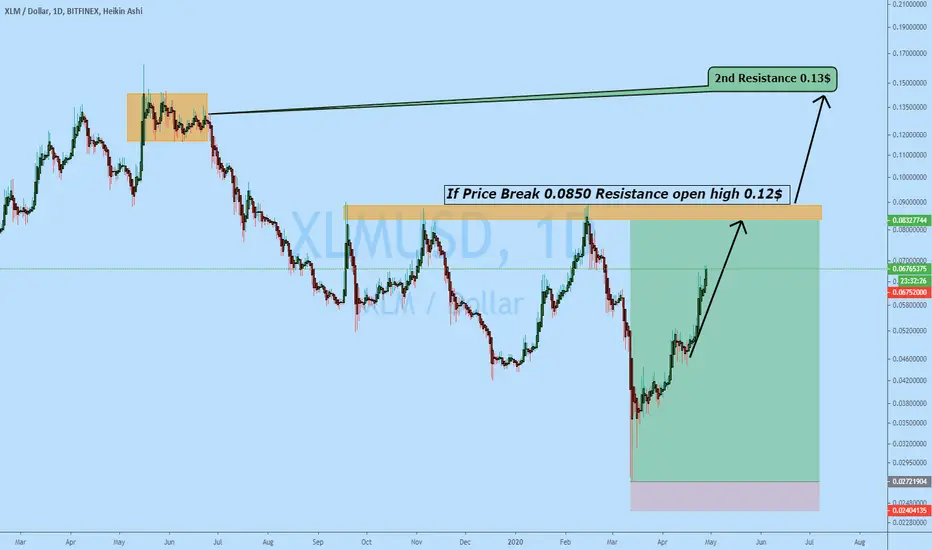
Bullish towards Resistance 0.0800$ and Waiting 2nd Resistance.XLM/USD holding bullish trend towards 0.0800$ Resistance, if BTCUSD holding Bullish trend also then we can see 2nd Resistance 0.012$
🛑SUPPORT/RESISTANCE
✅S1= 0.0610
✅S2=0.0500
✴️R1=0.0700
✴️R2=0.0850
Please like, share, comments and follow me to get daily base analysis
Thank you for your support, I appreciate it.
XLM/USDT 8H (Binance Fut.) Double channel facing resistancesStellar Lumens has got a great bull-run lately, but it looks like it's going to retrace now.
There is still some place to grow up a little bit before dump that's why I'm using low leverage:
Sell Entry= 0.06969 - 0.07187
Take Profit= 0.06413 | 0.05905 | 0.05103
Stop Loss= 0.07743
Risk/Reward= 1:1 | 1:1.75 | 1:2.96
Expected Profit= 28.20% | 49.71% | 83.70%
Possible Loss= -28.20%
Fib. Retracement= 0.236 | 0.382 | 0.618
Margin Leverage= 3x
