Stellarlumens
STELLAR LUMENS (XLMUSD) DailyDates in the future with the highest probability for price direction reversals

XLMBTC Accumulation phase. BINANCE:XLMBTC has been in this accumulation area for over 6 months now. 1250 and 2100 areas remain untested. I see it testing those areas. I'll be building a position over the next days/weeks depending how it unfolds. A break of the 752 double top would be ideal at this point to really get going.
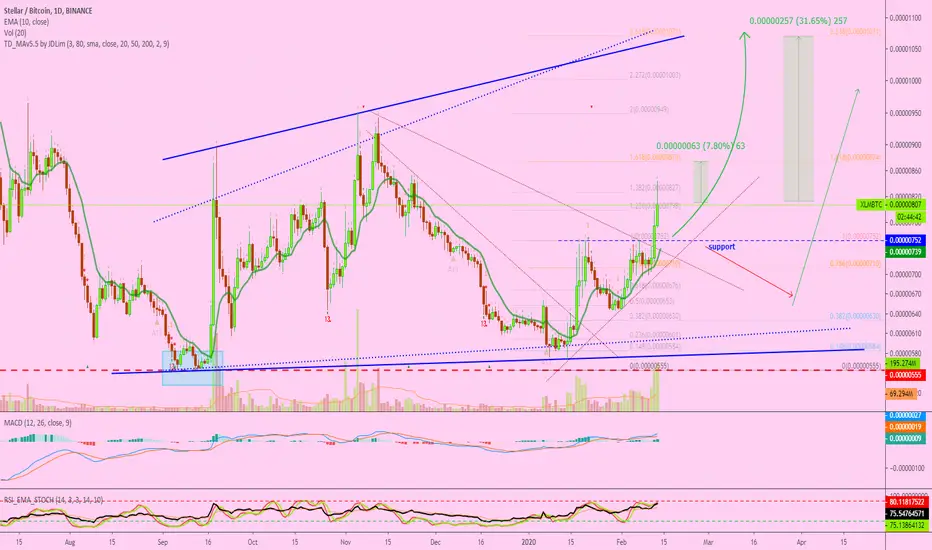
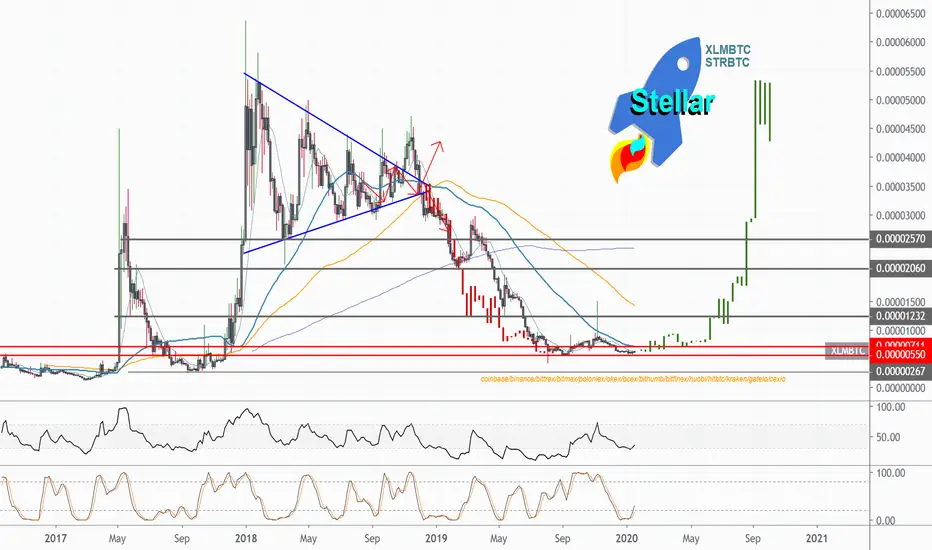
Stellar Aims Higher | Chart Fully Mapped (30% Target)Here is the chart for Stellar (XLMBTC) fully mapped.
On it, you can find the different support and resistance levels based on Fibonacci proportions.
We can also find the main scenarios that I think can come true and they go as follow:
1) Straight up. More growth until the top of the channel in blue is hit.
2) Retrace. If prices move lover and "support" breaks, a retrace can happen before the next jump. We stay bullish.
There is big volume coming in for Stellar (XLMBTC) now and the indicators are looking really good/bullish/strong.
-- More about the volume indicator --
Remember to hit LIKE to show your support.
Thanks a lot for reading.
Namaste.
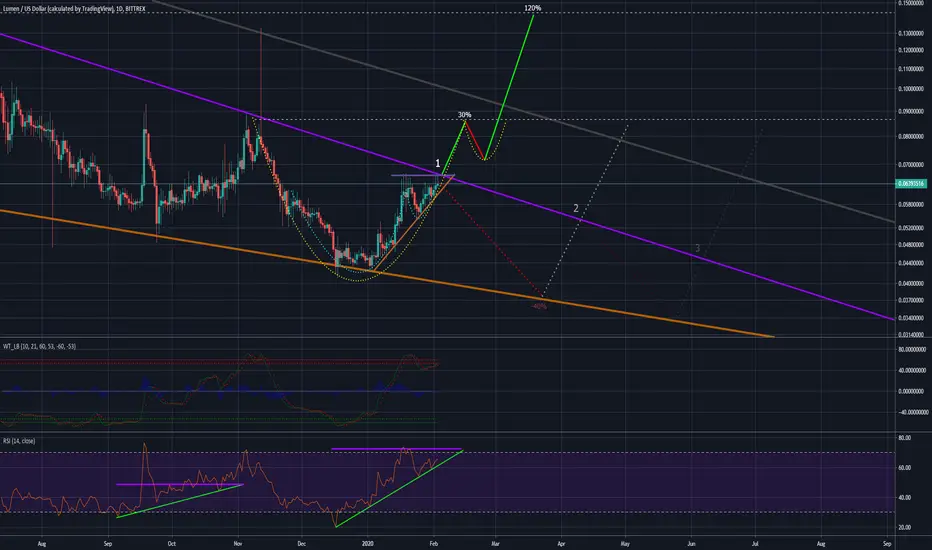
Stellar Lumens possible 120% increase over the next 2 monthsBased on RSI and wavetrends lining up with what looks like to be a bullish pennant.
Just collecting ideas to learn. Any feedback appreciated.
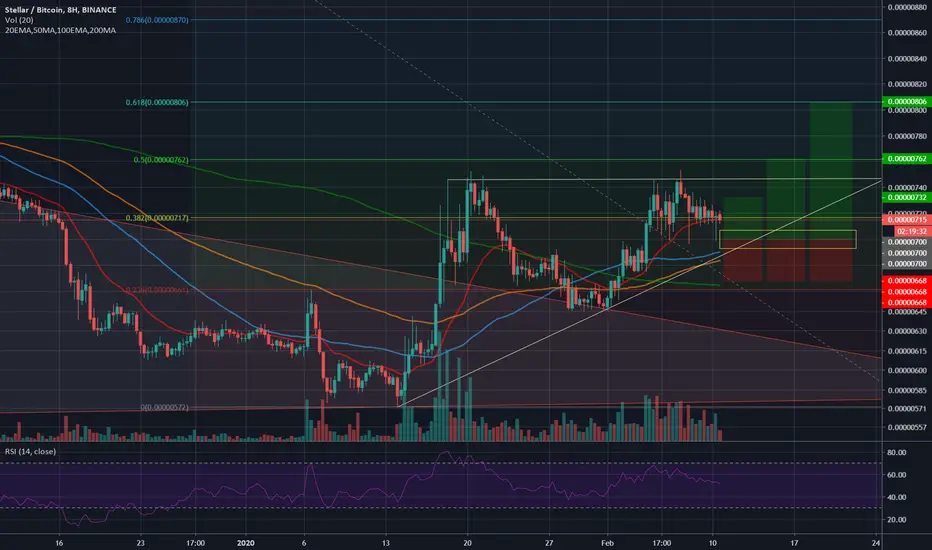
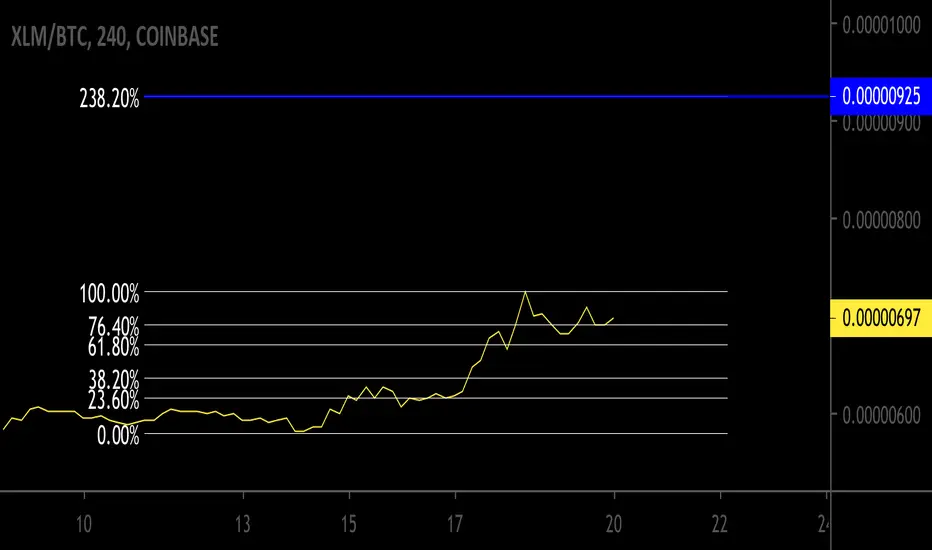
XLM/BTC 8H (Binance) Ascending triangle pattern in formationStellar Lumens is in uptrend and probably going for higher local high.
Keep an eye on that bullish pattern, the idea is to enter on triangle support, set-up:
Entry range= 0.00000693 - 0.00000707
Take Profit= 0.00000732 | 0.00000762 | 0.00000806
Stop Loss= 0.00000668
Risk/Reward ratio= 1:1 | 1:1.94 | 1:3.31
Expected Profit= 4.57% | 8.86% | 15.14%
Possible Loss= -4.57%
Fib. Retracement= 0.382 | 0.5 | 0.618
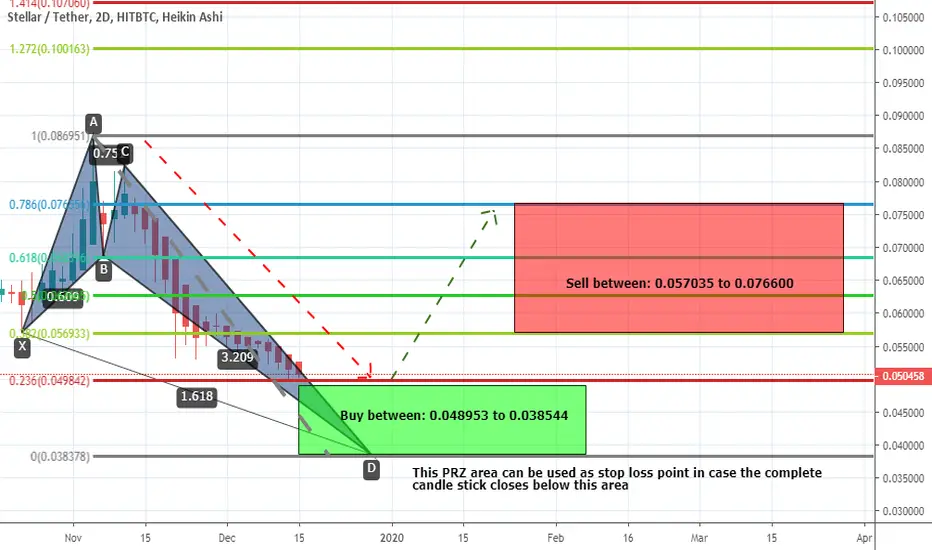
XLMUSD forming bullish Crab | Upto 98% bullish move expectedPrice action of Stellar / US Dollar is forming bullish Crab pattern and soon it will be entered in potential reversal zone.
This PRZ area can be used as stop loss point in case the complete candle stick closes below this area.
I have used Fibonacci sequence to set the targets:
Buy between: 0.048953 to 0.038544
Sell between: 0.057035 to 0.076600
Enjoy your profits and regards,
Atif Akbar (moon333)
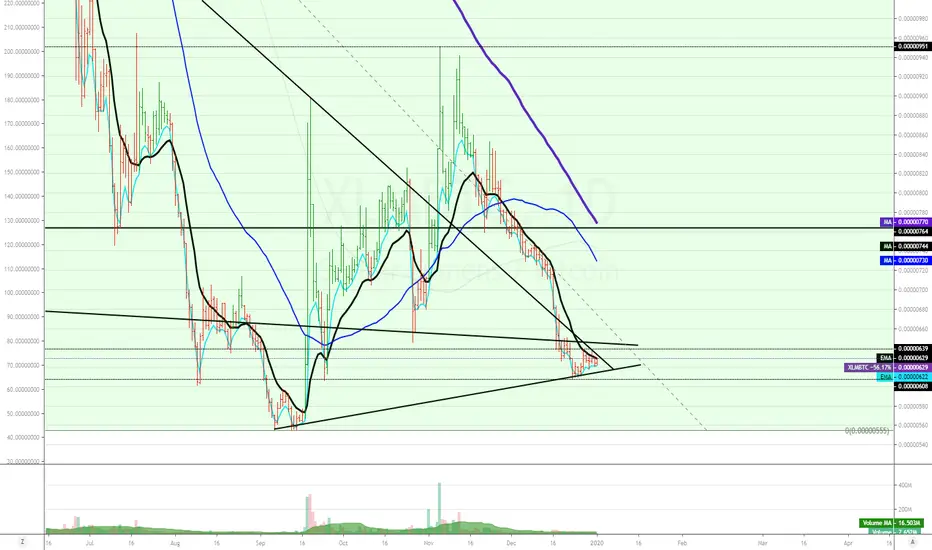
XLM testing a 2 year downward trend lineShould XLM break the red trend line as drawn ((shown here from June 2018 till date), I expect it to hit 0.094 to 0.098 range and correct itself to 0.07 to 0.074 range before starting its upward journey to 0.14 to 0.16 before the next resistance will come into play.
Am optimistic about this time.. Happy trading.

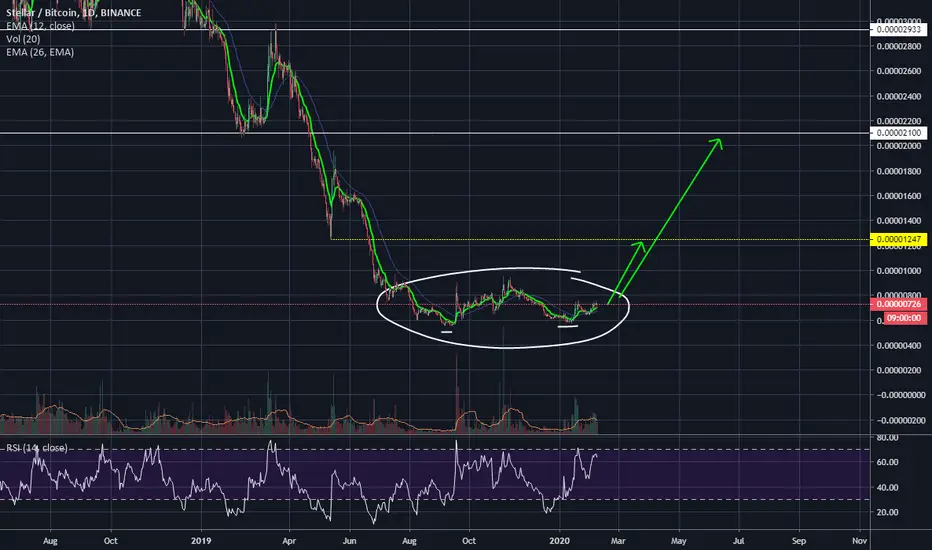
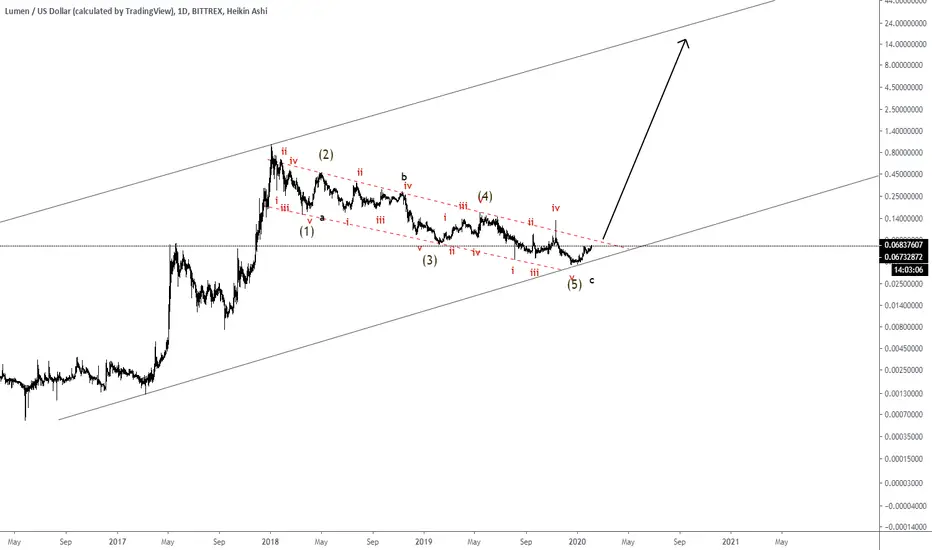
Steller (XLM) is warming up to a very strong bull marketHello everyone,
As you can see, i usually don't analyse a short period i prefer to look for the big picture. XLM and many other ALTS have almost the same structure, market cycles mean no bear market nor bull market will last for ever.
i will summarize the important points i relay on:
*Major and minor ABC 12345 waves was formed which means bear market is over based on Elliot Waves Theory
* XLM touched the major historical trend line coinciding with the end of wave 5 then retrace which gives us a great evidence we will start new waves formations to the upside
* XLM is not anymore making Lower lows and Lower Highs
* we have cup and handle on the daily chart (which means XLM is preparing to breakout the bear market channel
* XLM broke out 9,50,100,200 MAs and is trading above all of them and that is very strong sign of a start of bull market
* most indicators are bullish
this is only my opinion and not a trading advice
please don't forget to like and comment to motivate me to continue
thanks!
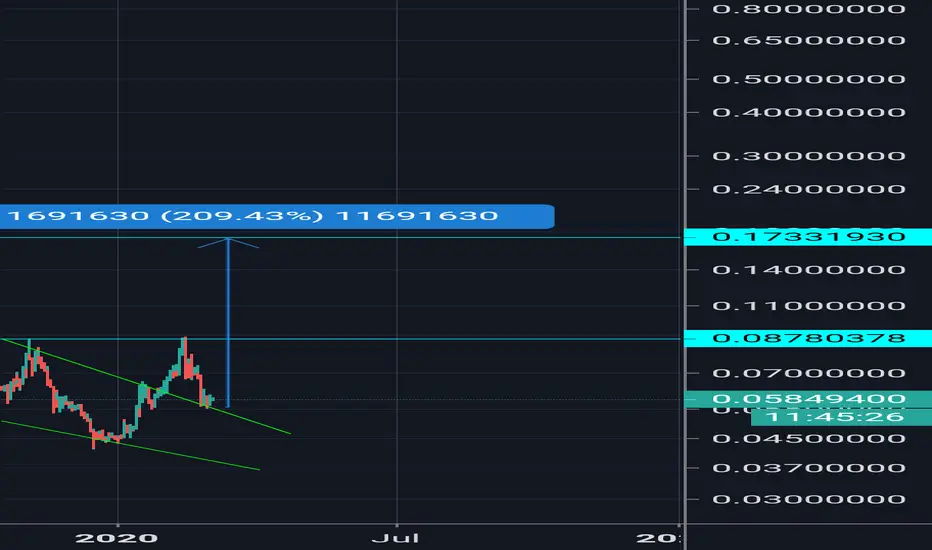
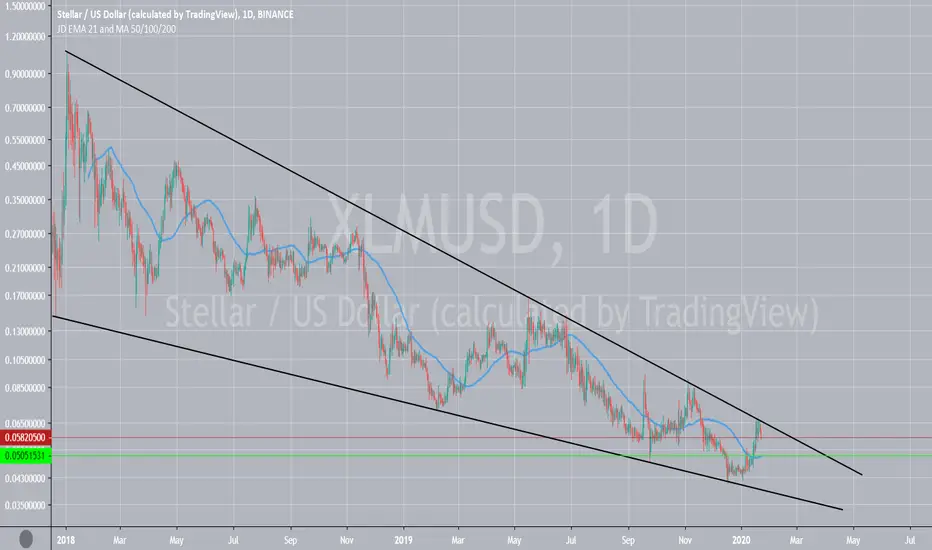
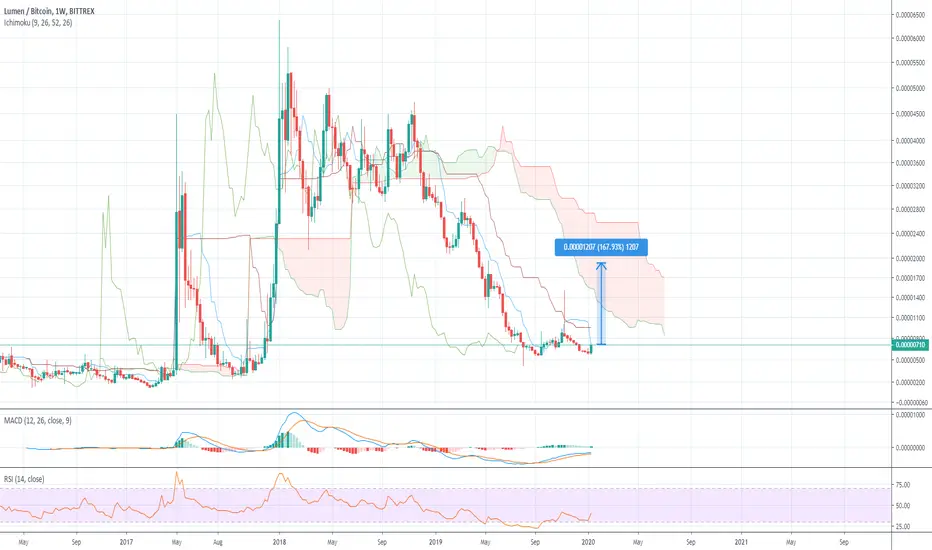
Stellar Lumens (XLM) ready to break 2-year old downtrend!A very simple chart for Stellar Lumens (XLM).
Retraced all the way towards the levels before the big surge in December 2018. Confirmed support there.
Bounced upwards & flipped the $0.053 level support as well and now facing a 2-year downtrend.
As long as $0.053 remains support, a breakout to the upside is likely to occur.
Main targets to aim for;
$0.09
$0.14
$0.19
The last one would grant a 195% move from here and would combine the XLM / BTC chart as well. The chart of XLM against BTC retraced all the way to the resistance in 2016 and is stuck in a range.
If a breakthrough of 910 sats occurs, space is open towards 2200-2500 sats.
Not financial advice.

STELLER ( XLM ) breakout trade setupprice closed above 50 ema and now having resistace at 100 ema if close above than confirmation that price will move upward
Buy : 700 - 715
Stop : 640
Target : 5% to 50%

Stellar/XLM Double bottom and Head and shoulders 2x to 10x.Double bottom and the head and shoulders indicators are great indicators that give indications of the start of a bullish movement. With a couple months of accumulation , Oversold xlm will look to price correct . The first true resistance test will be at around 850 - 900 . Once broken then XLM is confirmed bullish!!!!

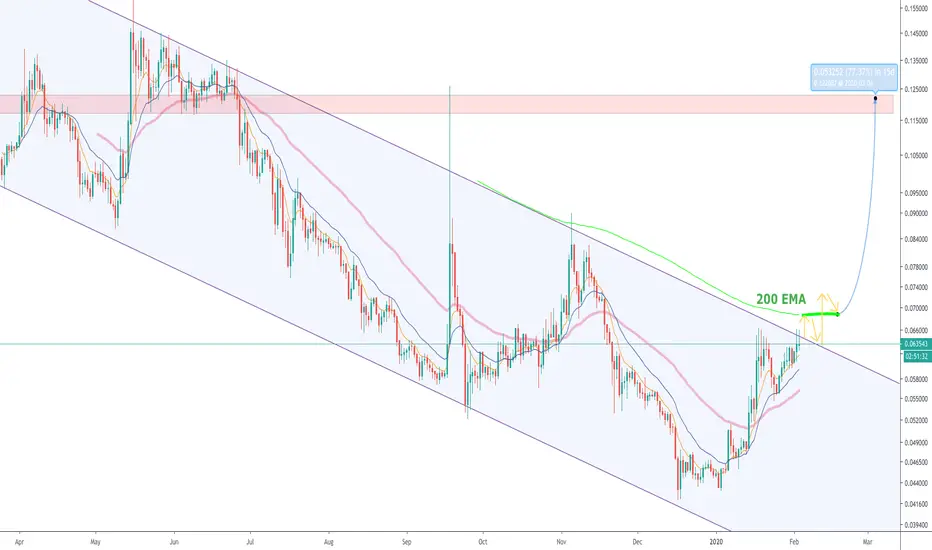
XLM Parallel ChannelPossible breakout to start a new trend.
200 EMA still a major resistance, expecting it to turn into a long term support once broken.
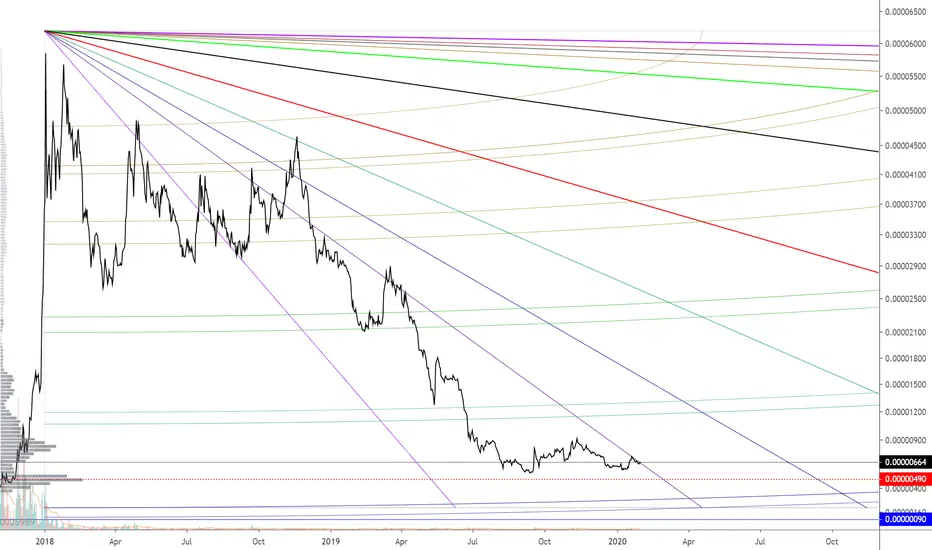
XLM Gann IdeaSet on weekly. Going out super far was the only way for it to make sense to me.
Looks ready for a breakout soon on the break of this 1/5 angle
XLM/USD, FALLING WEDGE (WEEKLY) NEAR APEXCurrently there is some bear div at the top of the previous pump on the hourly TFs so I am expecting a pullback. On the USD pairing, it looks near ready for a break out due to being near the apex of the falling wedge, additionally the stoch rsi on Monthly has crossed up. An area of confluence that I would look to long is .618 fib which coincides with the 50 MA.
FOR BTC PAIRING, REFERENCE
I AM NOT A FINANCIAL ADVISER, DO YOUR OWN RESEARCH.
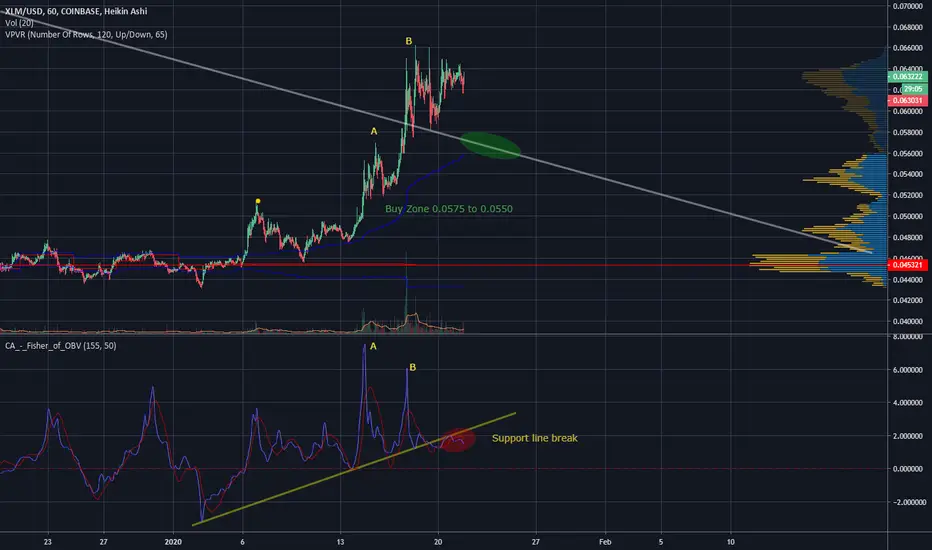
XLMUSD Temporary RetraceExiting position from last chart.
Re-entering in range specified in current chart.
Stellar Lumens - $XLM - Clean Count$XLM is one of the coins with a clean count. I will use it as a guideline to look for similar setups.
What's noticeable is the fact that there's bearish div on hourly timeframes so we'll range a bit now.
The second subwave of iii was simple so 4 will be complex.
#CRYPTO #XLM $STR #STELLAR #STELLARLUMENS

Xlmbtc: pump time!Short and simple.
Xlmbtc should pump while btc drops. Target indicated on chart. Will likely have subwaves along the way.
STELLER Daily breakout and Resistance | Trade IdeaBuy : 600 - 625
Stop : 7%
Target : 5% to 20%
1 ) Daily breakout
Daily RSI
2) price taking support at 12 ema .
3) 4 hour chart 21ema - 50 ema cross and 100 ema resistance closing above needed
overall loooks good for long

XLMBTC Daily Chartlets see what happens, crypto is very crazy and right now bitcoin just looks weird IMHO