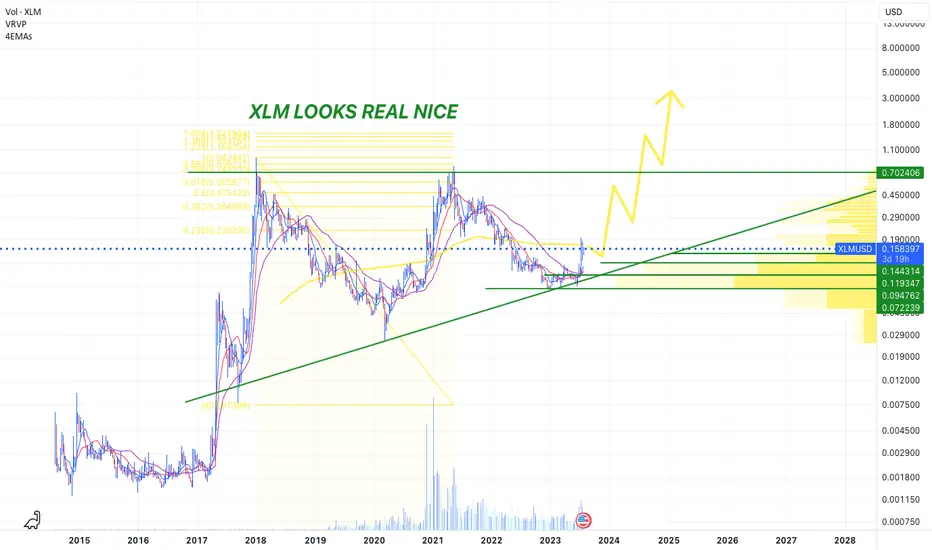
XLM - Daily higher targetsStellar Lumens (XLM) is on the move! The daily chart reveals a powerful buying momentum, signaling a rise towards the $0.2 mark as it aims to breach the resistance zone. This could be a pivotal moment for traders.
Stellarlumens

Tell me how its different this time.....XLM headed to the moon.Fractals.
If they are demonstrating the same pattern, then when do we stop ignoring the inevitable?
Yes, the last fractal didn't complete to the top.
Well, thats why I give a range between the two horizontal red lines for possible region that XLM might top at this cycle.
Personally, I think we reach the upper red line by the Nov-Dec 2025.
Liftoff has commenced!

An inverse head & shoulders pattern formed in XLM.Today was an incredible day for many cryptos, and not so much for others. But one thing you can be sure of is that XLM has been spending the past two weeks forming a perfect head & shoulders pattern on the 30 minute chart that, assuming it plays out bullishly, is almost near the take off point!
If price action breaks out of the dashed white line at the top of the wedge pattern, we could see a dramatic price increase in the coming weeks. This could also be a great sign that XLM could be well on its way to gaining ground, and starting a new bullish trend in the mid to long term.
Good luck, and always use a stop.

XLM will likely drop an additional 25% before it rebounds.XLM appears to be working its way to the bottom trend line of the wedge pattern that has formed on the daily chart. If it does, it will likely bounce, and make a run for the top trend line of the wedge pattern. This could present many opportunities for day/swing traders, and make it easier to determine entry and exit points if it plays out.
Good luck, and always use a stop.

Expecting #XLM #Stellar to play a long , good game+ Very long time accumulation in #btc pair
+ Lying on horizontal and historical support
+ Undervalued
NOT FINANCIAL ADVICE.

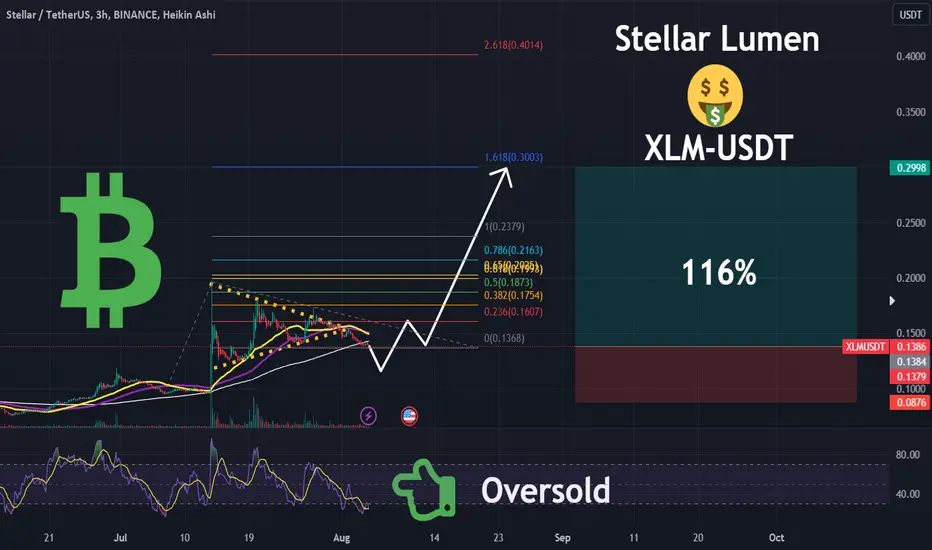
Going in Big on Stellar (XLM) - Target .18-.19 Cents!This one will be a longer-term swing. It may take weeks. It may take months. But the bottom line is that I like almost everything I see about this chart. Let's start all the way at the bottom. In mid-June price was at or near multi-year lows. RSI indicates we were way oversold. We started digging ourselves out of the hole then and haven't really looked back. That trend-line on the RSI is highly significant. Every time we've touched it our price has pumped. Our first touch was at the formation of the triangle bottom in mid-June at .07 cents. From June to July we went from .07 all the way up to almost .19 cents, nearly tripling. Every touch thereafter netted at least 30% from touch to top-out. And just recently, we have touched that sacred magical line once again. I believe this next pump is only beginning.
Now jump on up to the price chart. Feast your eyes on that beautiful ever-present bullish triangle. Isn't that amazing. But it's not just the size of it that I am excited about. Or the precision of touches to the top-side and bottom. Look at all those SMAs (50,100,200 day). Do you see how there all in the same area? And they are all providing us support rn. Additionally, just under all of them, we have a major horizontal TL. This provides us with a massive area of confluence that it become ridiculously hard to bet against.
I'm in at 11.8 cents with a SL comfortably under that last pivot low (9.5 cents to be exact). I will be taking profit along the way but will hold at least 25% of this trade to the final target unless I get stopped out of course. I will be raising my stops a comfortable distance along the way. Right now they are about 18% below my entry and I will draw them closer and closer to current price as we go. With any luck, we should be in the profit fairly soon and eventually so will my stops. Risk reward ration on this is 3/1.
None of this is fin advice of course. Just showing you all how I trade.
Best,
Stewdamus

$XLM targets $.25-.37?CRYPTOCAP:XLM is breaking out of 3 month bull flag.
Targeting $.25-.37 on the upside.
The first major resistance should be around $.22 which is the target of the flag.
Let's see what happens over the coming weeks.

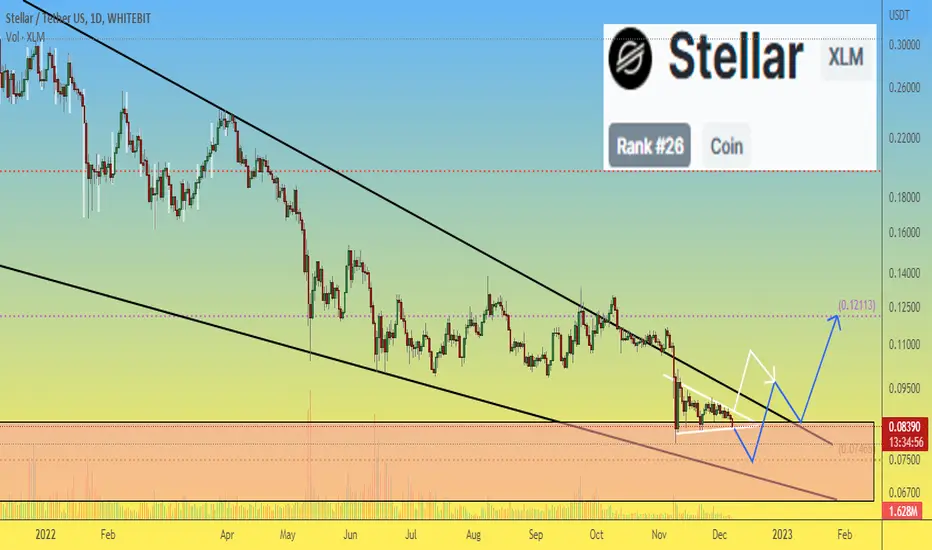
Stellar Lumens to bounce from range lows?Stellar Lumens has traded within a range from $0.111 to $0.1334 since 17 August. The past few days saw the OBV dwindling to show reduced buying pressure, which suggested XLM might not be able to defend the range lows.
Yet, it represented a good risk-to-reward buying opportunity for aggressive buyers
Entry- $0.111 (retest of support in the event of a BTC dip could offer an ideal entry)
Take-profit- $0.1334 (range high)
SL- $0.106 (more conservative SL can be placed at the bottom of 17 Aug's lower wick at $0.1053)
R:R- 4.89 (could fail if BTC drops below the $25.8k mark)

#XLM Bounce Zone, #STELLAR devam mi?Here i highlighted on the chart, this is good bounce zone for XLM, if #BTC does not dump , #stellar may bounce from this area and move up. NOT FINANCIAL ADVICE.
#XLM icin guzel bir bounce alani oldugunu dusunuyorum , bu destek asagi kirilir ve 4s kapatirsa stop olmak gerekir, #bitcoin de dump olmadigi surece bu destegin calismasini umarim. Yatirim tavsiyesi degildir.

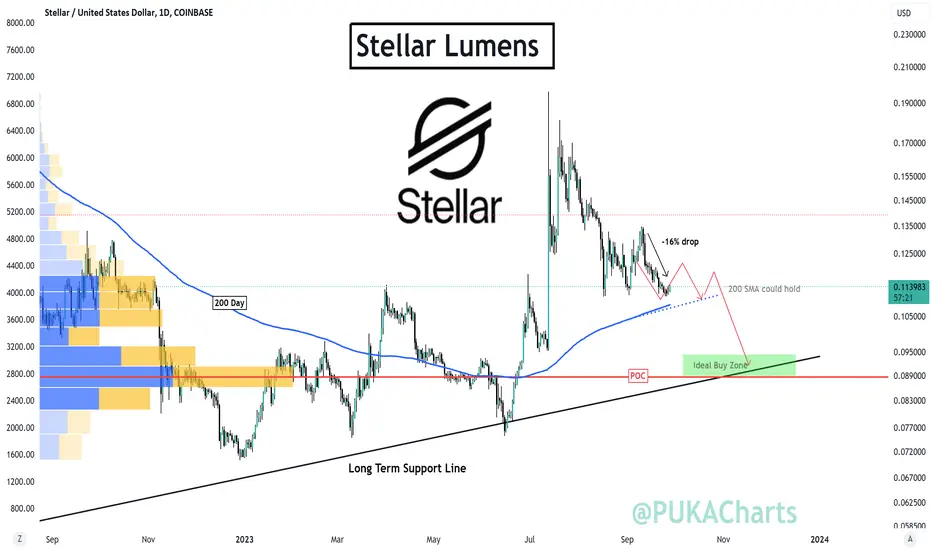
Steady with Stellar XLMStellar Lumens LSE:XLM
Shared originally elsewhere and forgot to post here. Since then we had this 16% drop as expected.
This sort of scenario would not surprise me and would be a great opportunity buy off of some strong support. That being said an entry on the 200 day SMA could be considered but its clear to me where the ideal buy zone is. Long term spot holders can ignore.
Please review the long term chart i completed for stellar, its paints a clear long term picture
PUKA
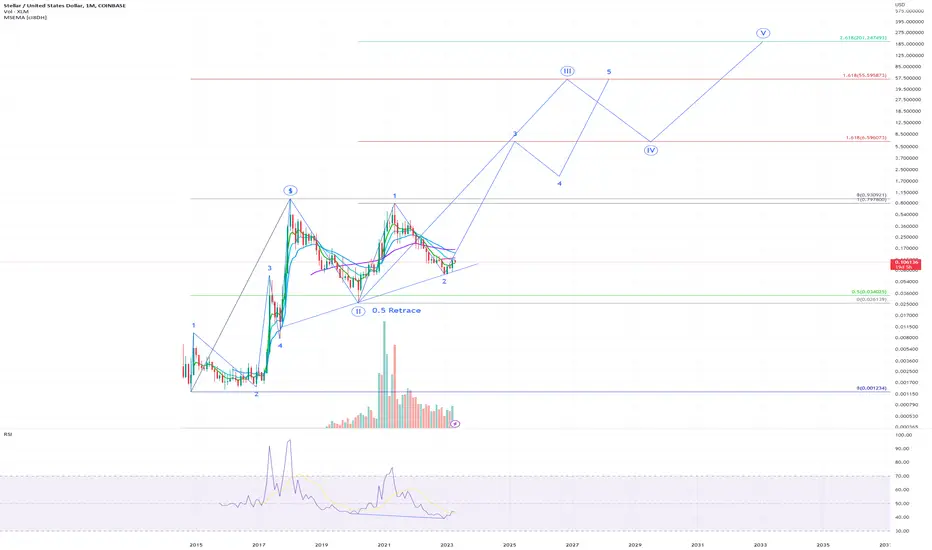
IS ELLIOT WAVE THEORY REAL? STELLAR LUMENS XLMHello Traders,
Here is the monthly chart of Stellar Lumens looking at this purely from an Elliott Wave perspective. I know little about the technical details of the protocol/token etc.
From an EW perspective price looks to be inside a bullish wave 3 with the target at the 1.618 extension.
Lets see what happens.
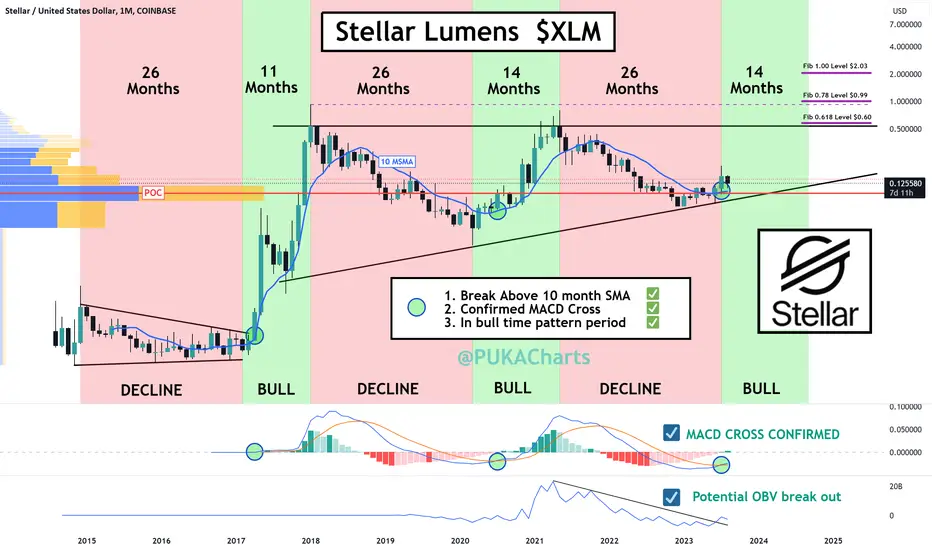
Stellar Lumens - A Hidden OpportunityStellar Lumens - A Hidden Opportunity
I cover the chart first and then some positive fundamental's and tokenomics.
The LSE:XLM Chart
I located and plotted trigger points, boundaries and of course a time structure.
There is a clear bull/bear time pattern. Open the chart and see the months and see how they move in similar increments both by month and by number for Bull and Decline periods.
Three positive price action triggers are marked on the chart and are confirmed by the following:
1. Break above 10 Month SMA, combined with
2. Confirmed MACD Cross, combined with
3. Both occurring in the bull pattern time window
All three have just occurred as of July 2023. IN ADDITION
4. This time we have broken above the POC, and
5. We have broken out of the OBV resistance line.
All of the above is extremely bullish for Stellar Lumens XLM for the long term.
The risk/return is ideal as a price just under the bottom of the ascending triangle can act as a stop loss for you and the upper end can act as a first main point to take profit.
Undesirables:
- If we close a weekly candle outside of ascending Triangle, Exit trade.
- If we fall below the POC or 10MSMA, reduce position size or hold off until this happens and increase position size.
This chart is another fine example of how timeframes can help us structure a trade. Please note that this is a long term 12 - 18 month trade minimum. You could be exiting at any stage over those months depending on the trigger events mentioned above, ideally closing the majority of the position at the first trigger point 0.60c (lock in your stake and some profit). Furthermore, you have to be able to withstand the volatility within the ascending triangle without capitulating your position. There is currently some room to the downside but a lot more to the upside, you need to be prepared for both.
Positive XLM fundamentals:
Stellar is already being onboarded as a potentially compliant global payments system:
Stellar (XLM) like Ripple Labs (XRP) is intending to be a layer 2 international global payments remittances provider and enabler, albeit while Ripple Labs is targeting big business and institutional networks/transactions, Stellar has an incredibly varied pipeline from on/off ramps, asset tokenisation, moneygram conversion and access, and much more. Stellar appears to be targeting the developer, the retailer, the consumer, the international payments community in their transfers/remittances, and the unbanked. The Stellar Blockchain is a decentralized consensus protocol making it very quick and very efficient with a distributed ledger updating globally every 2 to 5 seconds.
ISO 20022 is an International Organization for Standardization (ISO) standard for exchanging electronic messages on payments data between financial institutions. They set the international payment standards through the likes of the SWIFT system and for the likes of CITI Bank, HSBC, J.P Morgan and Deutsch Bank.
Currently cryptocurrency’s that are ISO Compliant or in the process of becoming compliant include Ripple CRYPTOCAP:XRP , Xinfin Network TSX:XCD , Algorand EURONEXT:ALGO , IOTA and Stellar Lumens $XLM.
Why is this so important? Well because ISO compliant payment networks will be the most likely to be called upon for the distribution or enablement of Central Bank Digital Currencies (CBDC’s) and other secondary payment protocols.
Private Partnership from the likes Ripple & Stellar will likely be called upon to develop, enable and distribute a new CBDC:
We are aware that most governments are in the process of developing CBDC’s and cannot complete this task without private partnerships.
For example as early as 2019 the Official Monetary and Financial Institutions Forum (OMFIF) outlined the following observations:
“Practically, the operation of a CBDC is likely to rely on some sort of public-private partnership. Central banks could outsource the distribution of the CBDC to private financial institutions, which could also be involved in the onboarding of users”
“most central bank respondents suggested they would outsource many of the public facing tasks involved in CBDC management to third parties.”
“Some central banks noted that certain functions – such as ‘onboarding and overlay services’, or the actual distribution of the currency itself – could be ‘outsourced’ to private sector participants.”
“Among respondents, 64% said ‘intermediation’ functions, such as customer onboarding, which could be ‘outsourced’ to private sector participants, would be important in CBDC implementation”
In more recent news the Bank for International Settlements (BIS) AKA the Bank for Central Banks published a report based on surveys and data collection called “Making Headway”, they advised that:
o 86 central banks took part in the survey (including the largest)
o 15 CBDC’s would be up and operational by the end of the decade 👀
o Confirmed that Central Banks can hold up to 2% of their balance sheet in cryptocurrencies from the January 2025.
Considering the BIS is usually very anti crypto this news is significant.
Positive Tokenomics Vs competitor XRP:
XLM is currently 21st largest cryptocurrency in the world with a market cap of €3.4 billion.
XRP by comparison has a market cap of $27.8 billion and is ranked 5th, thus XRP would have a harder time of it in terms of multiplying its larger market cap and price.
In November 2019, the overall XLM supply was reduced. Now there are about 50 billion lumens, total, in existence, and no more lumens will be created.
So XLM has a max token supply of 50 billion whilst XRP has a max supply of 100 billion making it a more price dilutable token than XLM. At present XLM have released 51% of their 50 billion max token supply to the market whilst XRP have released 50% of their 100 billion tokens - 52.9 billion tokens (equating to number greater than the full supply available in XLM). XLM’s price will be greater impacted by demand than XRP due to the lower max token supply, smaller market cap and the fact no more new Lumens can be created, it is a fixed supply.
The more participants that join the network and use the network the less Stellar Lumens are available thus creating a demand. From Jan 2020 to present Stellar Lumen accounts have increased from about 4.2 million to 6.7 million. In the same period total transactions increased from <250,000 to almost 1 million.
All in this 12 – 18 month trade comes with a lot of positive upside and limited downside. XLM has a reasonable fundamental narrative backing it that could make it central to future payment networks and the XLM tokenomics provide a lot more upside potential than those of its close competitor Ripple (XRP). I am a fan of both offerings however it seems reasonable to have an XLM position if you have an XRP one. Maybe we can be the X-Army and support one another…. Maybe “X” will use both for its payment platform. One can dream. Please have a look at my XPR chart which is similar to the this XLM one, you may find that beneficial too.
Hope all of the above helps frame XLM in your minds eye and also provides you with a structure for an XLM trade.
PUKA
XLM | It About That Time | LONGStellar (XLM) is a peer-to-peer (P2P) decentralized network created in 2014 by The Stellar Development Foundation or Stellar.org. The network officially launched in 2015 with the purpose of connecting the world's financial systems and ensuring a protocol for payment providers and financial institutions. The platform is designed to move financial resources swiftly and reliably at minimal cost. Stellar links people, banks, payment processors and allows users to create, send and trade multiple types of crypto.
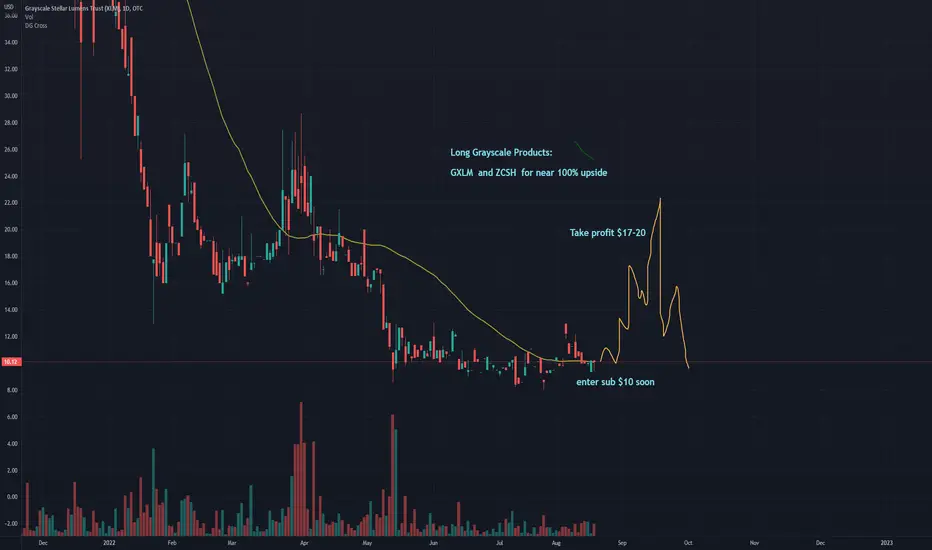
Long Grayscale Crypto Altcoin Products GXLM Stellar Lumens ZcashXLM Price Live Data
The live Stellar price today is $0.107277 USD with a 24-hour trading volume of $104,424,569 USD. We update our XLM to USD price in real-time. Stellar is down 3.56% in the last 24 hours. The current CoinMarketCap ranking is #28, with a live market cap of $2,709,539,393 USD. It has a circulating supply of 25,257,395,966 XLM coins and a max. supply of 50,001,806,812 XLM coins.
The Zcash trust is the other top opportunity. Both Stellar and Zcash have good setup to provide near 100% moves in a fast manner
Stellar Lumens Fractal to $4.00XLM has not put in a new ATH in 4.5 years.
XLM has been in a bear market for 65 weeks.
We await the light.
1X10^(-27)LM

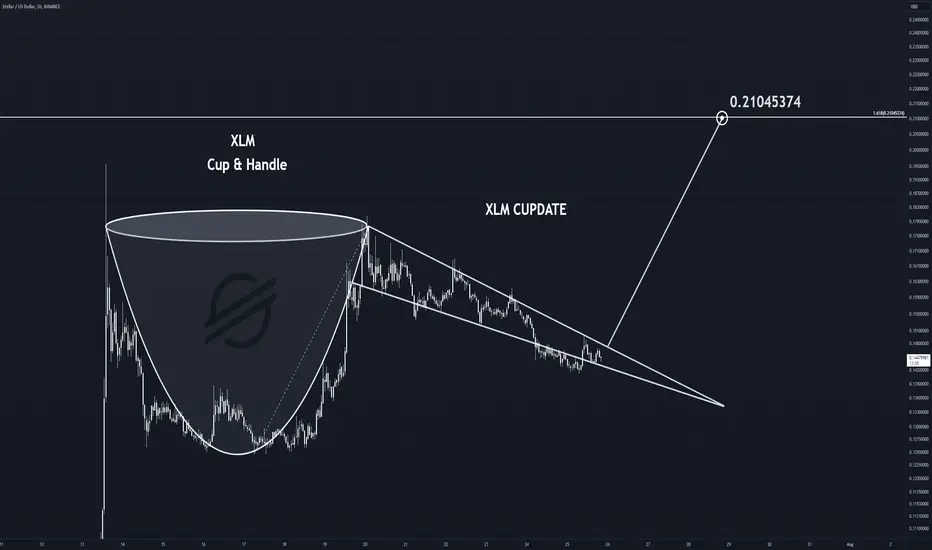
$XLM Targets 21¢- CUPDATE & HANDLELSE:XLM targets 21¢ with a Cup n' Handle Pattern
The target is the distance from the bottom of the cup to the top of the cup.
A 1.618 fib level from the bottom of the cup to the top matches the C&H target.
1X10^(-27) LM ☕🍵
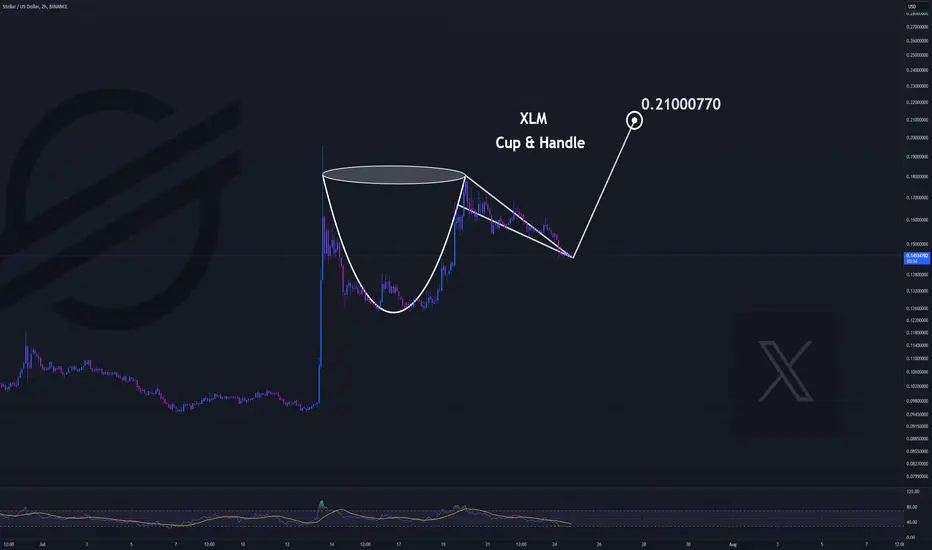
$XLM - CUP & HANDLE COMPLETE?XLM looks to have come close to completing a cup and handle.
Look for a breakout to claim support above 20¢
Tea-Time
Can you Handle it?
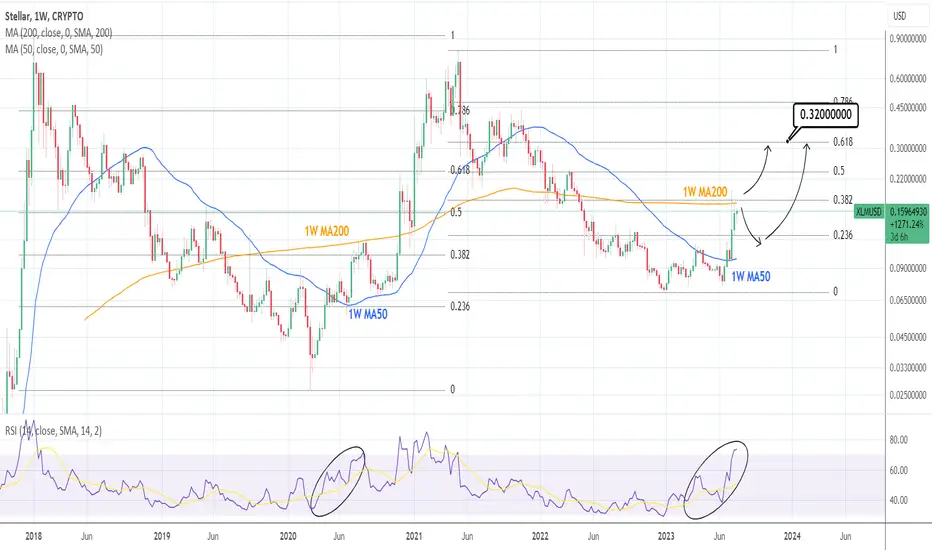
XLMUSD: Closing over the 1W MA200 can lead to 0.3200XLMUSD is on the third straight green 1W candle after the massive one that broke over the 1W MA200 for the first time in more than a year. However it closed the 1W candle under it, and so did last week's. Naturally, the uptrend needs a 1W candle to close over the 1W MA200 in order to confirm more upside.
The 1D timeframe is on healthy 1D technicals but 1W is overbought (RSI = 73.412, MACD = 0.010, ADX = 20.860) so failure to close above it, can deliver a pullback towards the 1D MA50 for one final buy entry.
Based on the price as well as the RSI pattern, the current trading sequence is comparable to the July-August 2020 1W MA200 tests. That gave the pullback but after it crossed over, the first target was the 0.618 Fibonacci level. That's now at 0.3200.
## If you like our free content follow our profile to get more daily ideas. ##
## Comments and likes are greatly appreciated. ##
XLM IS LOOKING TOO GOODWith the XRP SEC ruling XLM and XRP are both primed to keep building and eventually break out and enter a new phase of price discovery.
Stellar XLM price entered the procurement zoneIf you believe in the bright future of the Stellar project and want to buy XLM, then we have good news for you.
The XLMUSDT price came to the liquidity zone of $0.65-0.85 in which it is justified to place "buy orders with a grid".
It seems that in general, the XLMUSD price is approaching the end of the falling trend
And purely theoretically, a good potential for growth will open
Here is 3 months ago, we painted and showed the trade history of Stellar for 8 years, who is interested, welcome:
_____________________
Did you like our analysis? Leave a comment, like, and follow to get more
STELLAR LUMENS (XLM) new volume 💣🚀💣Hello 🐋
we expect to see more gain for the price in log term targets 🚀💣
before more gain, we can see correction to the downside ❌🧨
Please, feel free to share your point of view, write it in the comments below, thanks 🐋

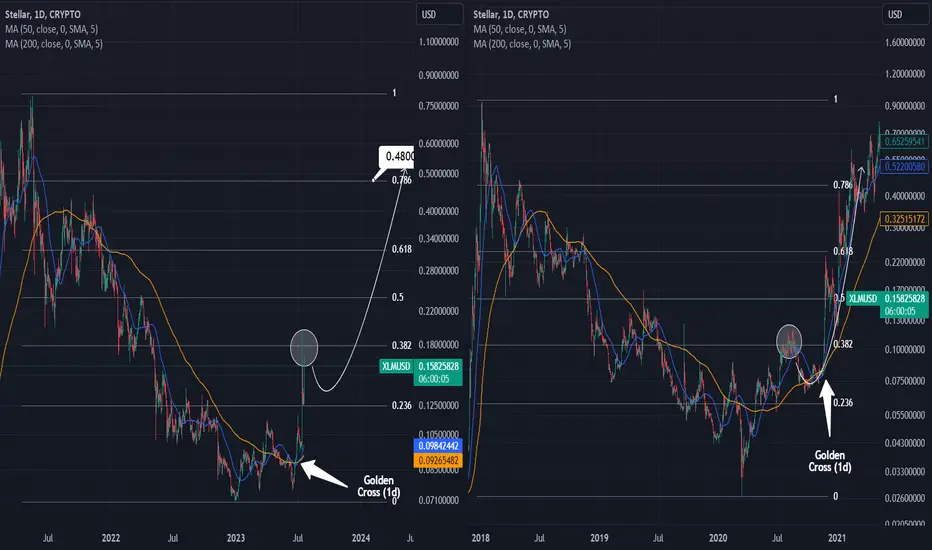
XLMUSD has started a parabolic rally to the former HighXLMUSD crossed last week over the 0.382 Fibonacci level and despited the subsequent pull back, it is again rising aggressively today.
The price action is very similar to the previous Cycle. When the price crossed above the 0.382 Fibonacci, it pulled back to the 0.236 and then started a parabolic rally that reached the 0.786 Fibonacci in 6 months.
Trading Plan:
1. Buy on the current market price.
Targets:
1. 0.48000 (Fibonacci 0.786).
Tips:
1. The price just formed a Golden Cross (1d), which is on the previous Cycle was formed right at the start of the Parabolic Rally.
Please like, follow and comment!!
#XLM/BTC 1D (Binance) Falling broadening wedge breakout & retestStellar Lumens is pulling back to demand zone where a bounce towards 200EMA would make sense, especially after a morning star.
⚡️⚡️ #XLM/BTC ⚡️⚡️
Exchanges: Binance
Signal Type: Regular (Long)
Amount: 12.6%
Current Price:
1) 0.00000317
Entry Targets:
1) 0.00000314
Take-Profit Targets:
1) 0.00000364
Stop Targets:
1) 0.00000289
Published By: @Zblaba
CRYPTOCAP:XLM #XLMBTC #Stellar #Lumens #P2P
Risk/Reward= 1:2
Expected Profit= +15.9%
Possible Loss= -8.0%
www.stellar.org
