XLMUSD formed Shark | A good buying opportunityPriceline of XLM / US Dollar cryptocurrency has formed a bullish Shark pattern and entered in potential reversal zone.
This PRZ area should be used as stop loss point in case of complete candle stick closes below this area.
I have used Fibonacci sequence to set the targets:
Buy between: 0.068239 to 0.067357
Sell between: 0.069275 to 0.071303
Regards,
Atif Akbar (moon333)
Stellarlumens
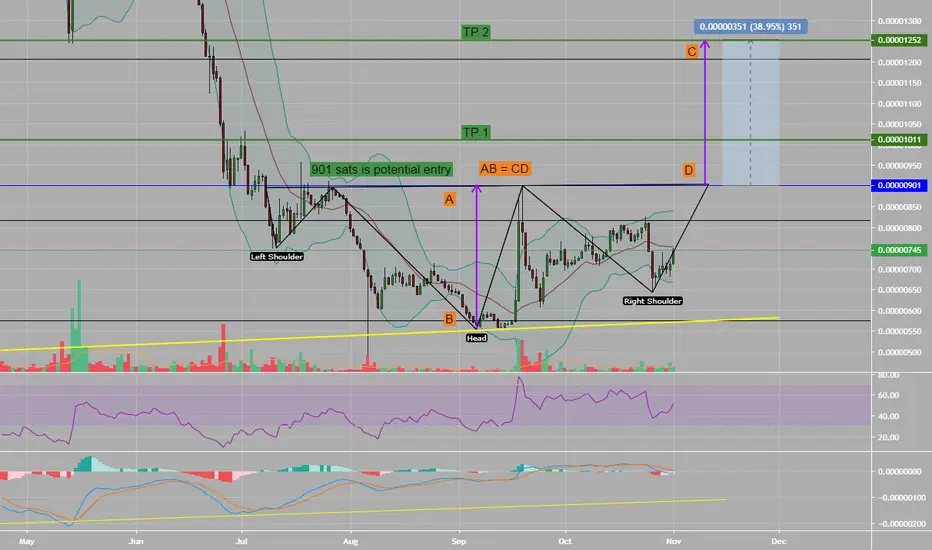
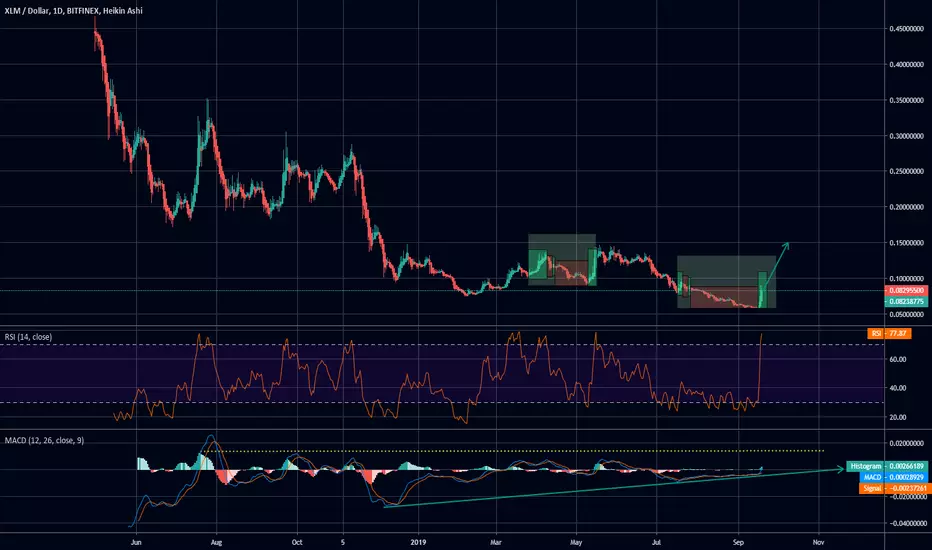
Stellar Lumen ($XLM) is fueling up before new run.$XLM finally reached a strong support line from 2016 and since then has been stuck in a range.
According to the chart we are forming inverted H&S with potential entry at 901 sats and two potential TPs:
1. 1011 sats
2. 1252 sats
Do not forget about stop-losses.
It's not a financial advice.
Trade carefully and good luck!
Stellar Lumens XLMHello, Traders!
Monfex is at your service and today we overview XLM/USD log scale.
By breakout the first resistance line, Stellar will begin to target to the second, MA200, zone of resistance.
RSI is also movng to the overbought zone.
XLM will upgrade Q4 Protocol to the end of this year.
The resistance zone ~ $0.875
The local support zone ~ $0.65
Market Cap
$1 381 862 646 USD
Volume (24h)
$391 688 458 USD
Circulating Supply
20 054 779 554 XLM
Share your thoughts, ideas about the market under the chart.
Watch for our Updates to be the first who gets well-timed signals !
GOOD LUCK AND LOTS OF PROFITS !!
Disclaimer
This report is for information purposes only and should not be considered a solicitation to buy or sell any trading assets. Monfex accepts no responsibility for any consequences resulting from the use of this material. Any person acting on this trade idea does so entirely at their own risk.


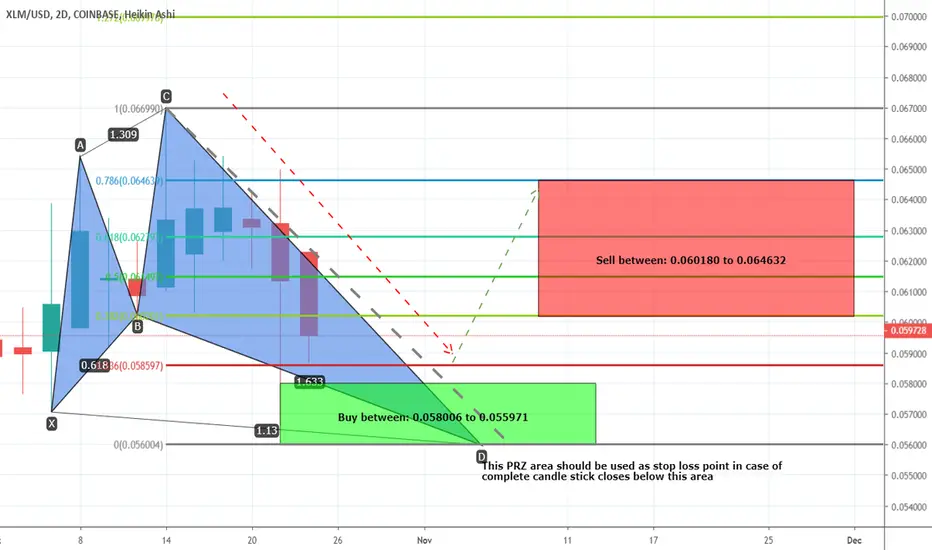
XLMUSD formed bullish Shark | Upto 15% move expectedPriceline of XLM / US Dollar cryptocurrency has formed a bullish Shark pattern and entered in potential reversal zone.
This PRZ area should be used as stop loss point in case of complete candle stick closes below this area.
I have used Fibonacci sequence to set the targets:
Buy between: 0.058006 to 0.055971
Sell between: 0.060180 to 0.064632
Regards,
Atif Akbar (moon333)
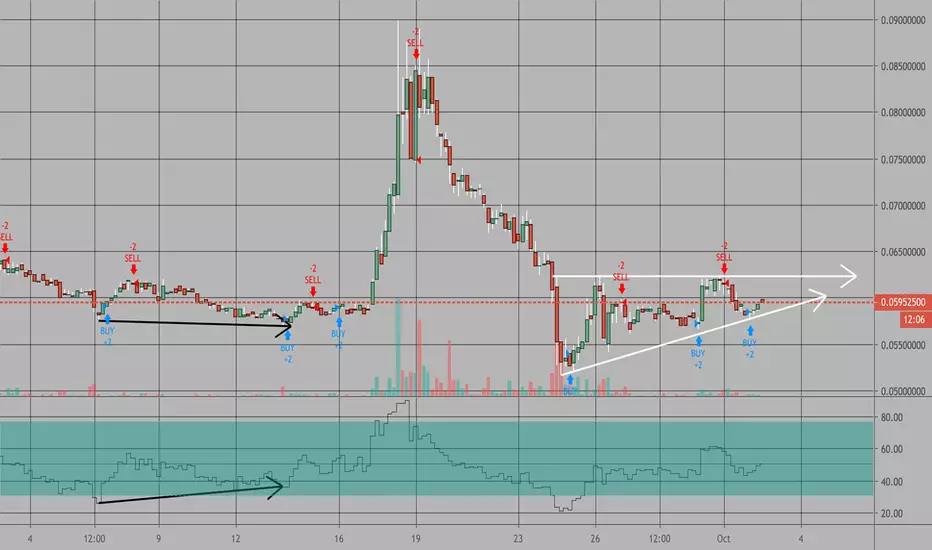
XLMUSD LONG - BREAKING EMAsDaily chart. Every indicator is showing bullish while PA is breaking EMAs and the bullish crossover is near. Volume defines S/R areas on red line, more or less where i will take profits.
Indicators:
- MACD signal crossing ZERO line
- RSI breaking 50 and supporting
- ADX on sideways but DI+ dominating.
- STOCH is crossing bullish outside the overbought
PA broke 21EMA and is testing 55EMA. Crossover 21-55 is near. I chose the closing price candlestick on the past as the target resistance area. LONG it is!
Just my journey, not an advice!

XLMBTC LONGLarge moves coming for alts. Dont sell the initial pumps. Wait for the home runs.
God Speed,
Mr. Manbearpig
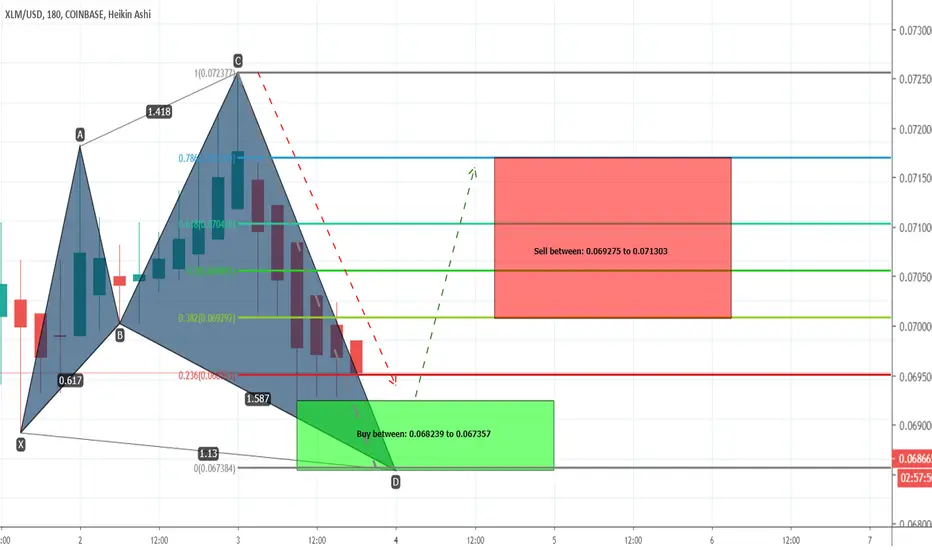
XLMUSD forming bullish Cypher | A long opportunity aheadThe priceline of XLM / US Dollar cryptocurrency is forming last leg of bullish Cypher pattern and soon it will be entered in potential reversal zone insha Allah.
This PRZ area should be used as stop loss in case of complete candle stick closes below this zone.
We have strong support of 100 simple moving average within PRZ area.
Volume profile is showing less interest of traders at PRZ level but MACD is strong bearish and Stochastic is in bear cross so for secure trade we can wait for MACD to turn weak bearish or for stochastic to give bull cross then buy from the potential reversal zone.
I have used Fibonacci sequence to set the targets:
Buy between: 0.060683 to 0.059328
Sell between: 0.061773 to 0.064335
Regards,
Atif Akbar (moon333)

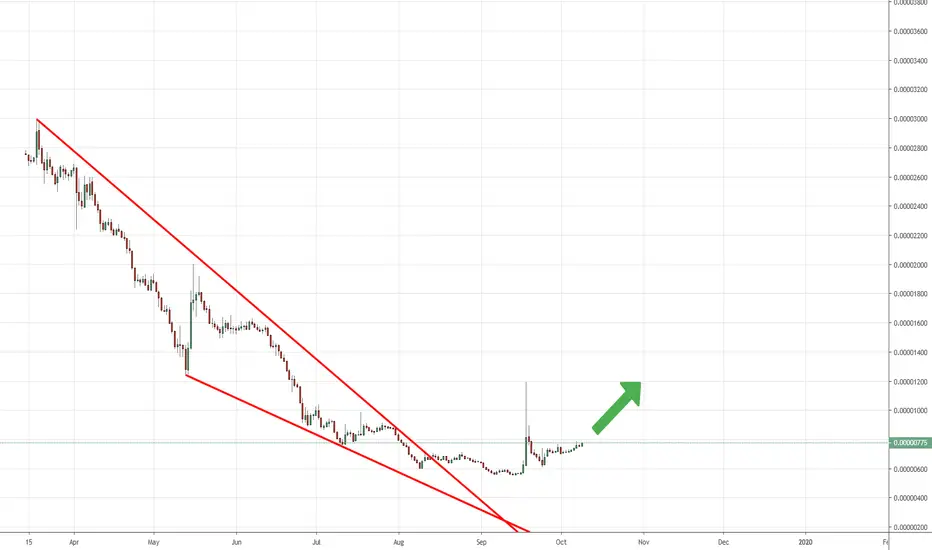
Good time to buy XLMXLM has broken up from its downward wedge and looks to aggressively regain ground as Bitcoin's price comes under pressure.
XLM has partnerships with IBM, Deloitte and other national banks in emerging countries.
XLM is a much quicker payment system, much cheaper and much more decentralised than Bitcoin. Furthermore it is open source and therefore is likely to get more and more efficient over time as a result.
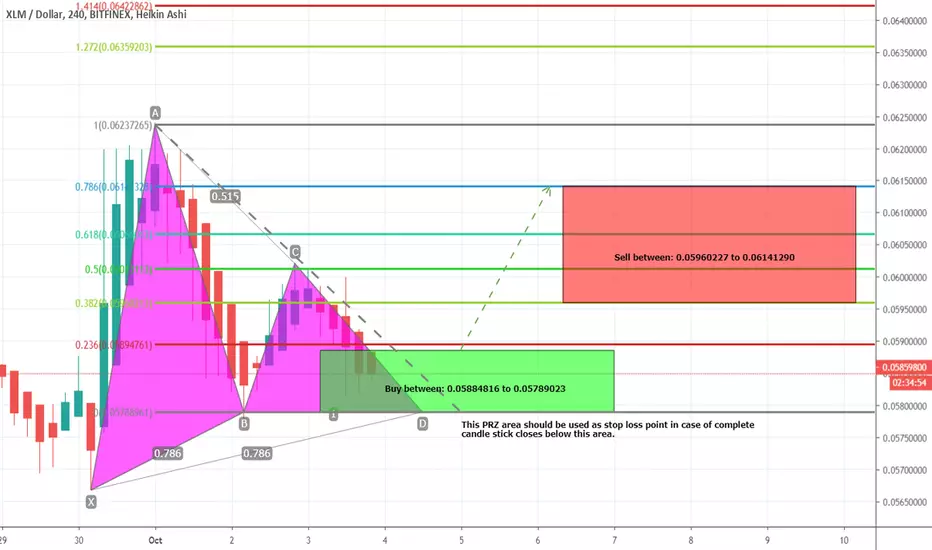
XLMUSD formed bullish Gartley | A buying opportunityPriceline of XLM / US Dollar cryptocurrency has formed a bullish Gartley pattern and entered in potential reversal zone.
This PRZ area should be used as stop loss point in case of complete candle stick closes below this area.
I have used Fibonacci sequence to set the targets:
Buy between: 0.05884816 to 0.05789023
Sell between: 0.05960227 to 0.06141290
Regards,
Atif Akbar (moon333)
XLM .0755 target Bullish divergence on RSI (4hr) led to relatively high volume and 50% price increase, ending in a crisp ascending triangle that is tracking nicely.
Just an idea!
Keep an eye on XLM if XRP rallies.XLM/BTC, much like XRP/BTC, is currently trading above its 10 week moving average for the first time in months. With XRP/BTC looking pretty bullish on a weekly basis, XLM is likely to follow any rally higher by XRP as these 2 coins tend to move together. Also, for any crypto traders out there, Binance just launched their US exchange (Binance US.) If you need a link to go sign up, click here--> www.binance.us
MA Guide (All Weekly for this post):
10 MA in Orange.
20 MA in Pink.
-This is not financial advice. Always do your own research and own due-diligence before investing and trading, as for investing and trading comes with high amounts of risk. I am not liable for any incurred losses or financial distress.

Stellar Lumens (XLM)After a double bottom, buyers are showing massive interest with a 40% impulse move on 10x the average volume. The second up leg has already started and is showing support at the previous range high.
Waiting for price to reclaim the grey line and show a good set up.

Long XLMBTCNice tight stop. Looks really good. alt season is here. We just dont know how long it will be.
God Speed,
Mr. Manbearpig
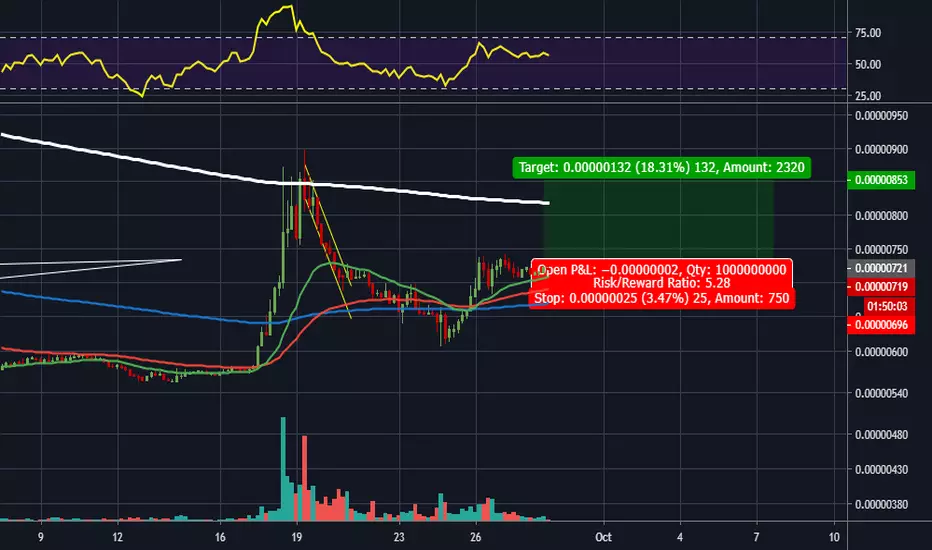
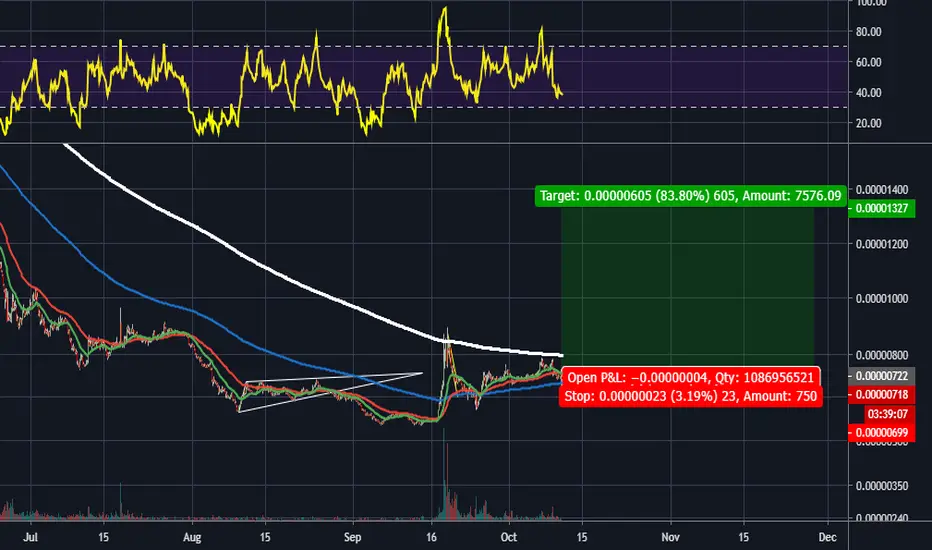
Stellar Lumens Price Analysis: Bullish Opportunity on the HorizoConclusion for today's Stellar Lumens price analysis:A break above the long term trendline can be used as part of a conservative strategy to go long (i.e. buy) Stellar Lumens.
A log scale of Stellar Lumens price is presented on the 6 hour timeframe with coverage of market action since May 2019.
The long term bearish trendline is plotted on the chart with peak of the price spike on September 18, 2019 used as the second pivot in drawing the trendline. The 200 and 50 moving averages are also drawn to track price for possible trend change(s).
Signs of hesitation for the downtrend as shown on the chart include the formation of a double bottom (ideally bullish) chart pattern between September 6 and September 14, 2019. Confirmation of the pattern occurred on September 17, 2019 when price broke and closed above ~0.00000597.
A retracement to the aforementioned price level i.e. ~0.00000597 can be observed after the price spike, suggesting that Stellar lumens’ price could potentially find support at the price level. A second test would provide additional evidence of bullish momentum picking up and hence change in the trend from bearish to bullish.
The September 24, 2019 bullish crossover (50 moving average above the 200) also does favor a bullish scenario for Stellar Lumens as opposed to the continuation of the long term bearish trend.Confirmation of support at ~0.00000597 (second successful test) provides a great risk/reward ratio for long (buy) positions.
More conservative strategies for initiating long positions however involve waiting for price to close above the long term bearish trendline.Price closing below ~0.00000563 presents a great challenge for the continuation of price action to the upside, therefore invalidating the bullish analysis for Stellar Lumens.

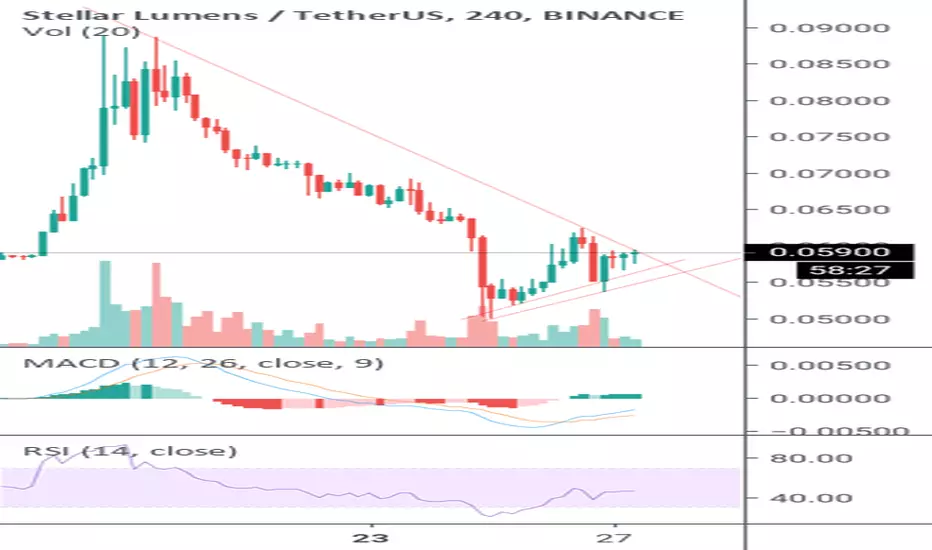
XLMUSDT Breakout idea , bullish RSI Very nice setup if you have usdt just because of bears we have to move money
Buy : 5870 - 5900
Stop : 5%
Target : 5 to 30%
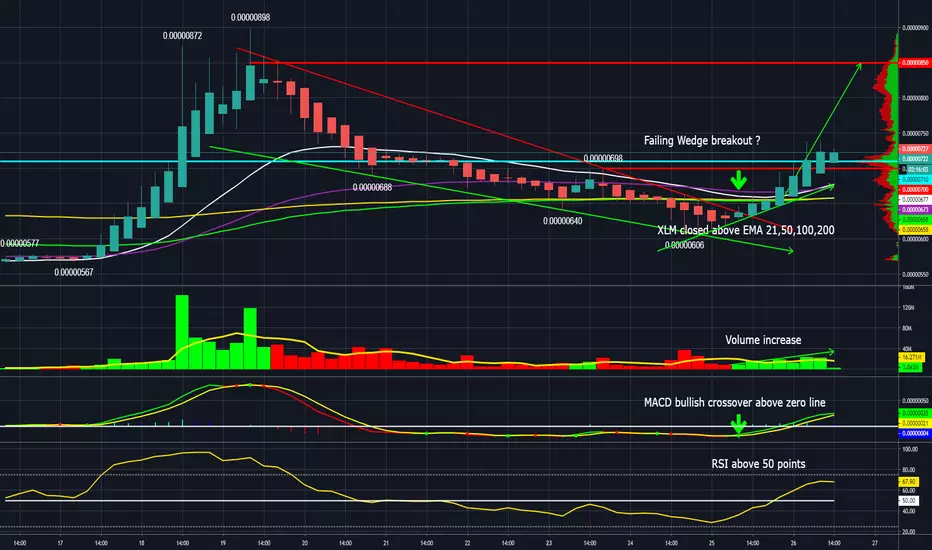
LONG XLM bullish failing wedge breakout ?Price Action(PA) XLM closed above 700 sats resistance level . Closed above EMA 21,50,100,200 Uptrend.
Indicators: RSI above 50 points, MACD bullish crossover above zero line ( bullish sign)
Pattern: Failing wedge bullish breakout.
Bullish Volume respond. Confirm trend.
S/R : Strong support at 600 sats , Resistance at 850 sats .
Disclaimer: THIS IS NOT FINANCIAL ADVICE. All the information shared here is for learning and entertainment purposes only.
Just buy6 cents is coming, the next wave pattern to the peak begins on or after september 19. Price isn't going to get much better. This is speculation of course, come to your own conclusion and make your own decision. Preferred vehicles are speculative and losses may or may not be assumed. Investing in cryptocurrency carries an inherent high degree of risk.

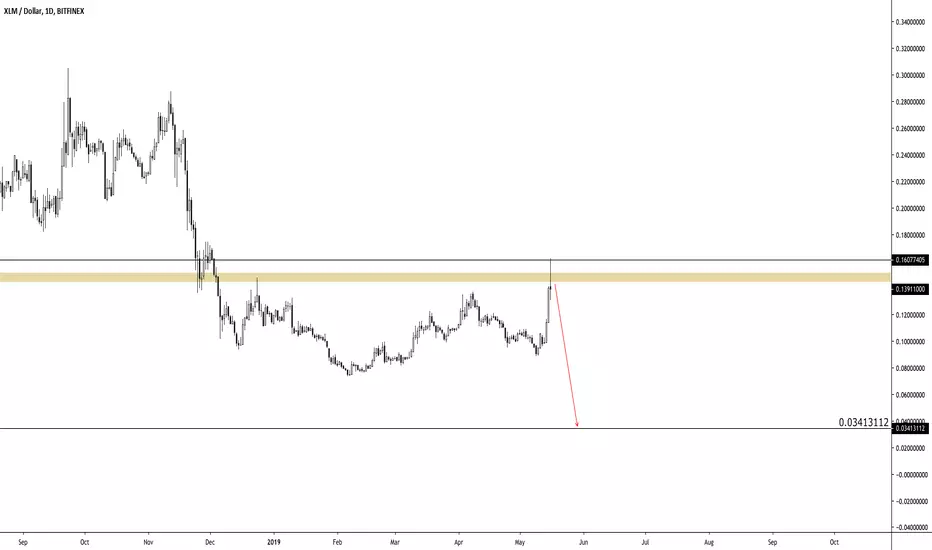
$XLMUSD | Potential Move Down | BearishThis move may have been a set up for strong sells. I'd look at 0.16~~ as a battle ground as well as the highlighted area on chart. If we do indeed get a failure here, I would expect price to hit the defined target of 0.03413112. From there, it will be a great buy opportunity.
Stellar in reversal zoneStellar retraced to nearly 0.236 zone from its last pump
Stock RSI & CCI oversold
Back in previous resistance zone
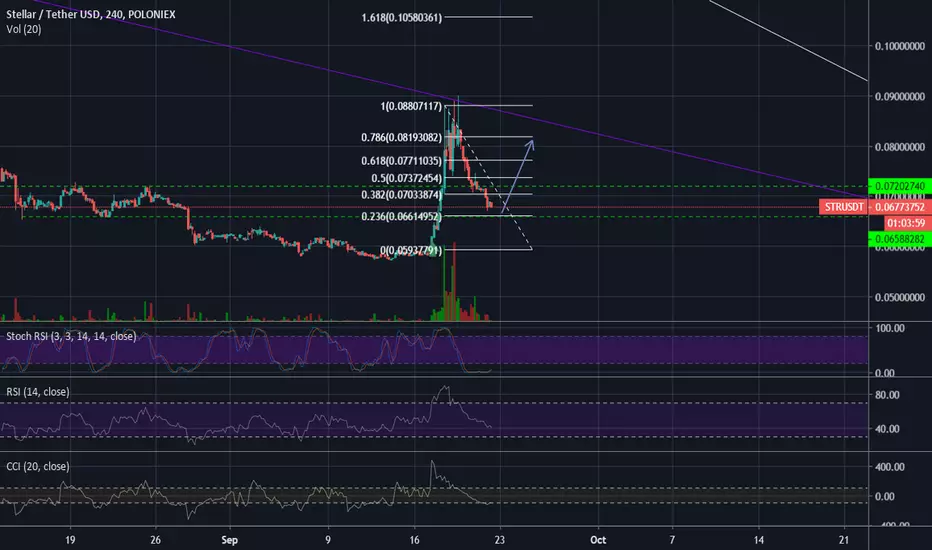
XLM possible movments It seems that BTC has knocked some fins out of most alts, less so with XLM. But there are still multiple plays on the table.
Version 1 is that we push through the 0.08900 resistance. Version 2 we fall through first support at 0.07770 level and there we bounce back up again. Eventually Fib 0.618 should act as the strongest support here and if that holds, then the next leg up has a strong momentum to push beyond 0.09000.

Stellar XLM - End of the Year Breakout?There has been lots of new developments with Stellar. Lots of exciting releases coming from the team behind Stellar. These all add up to prospects of handsome returns:
MACD has plenty of room to move up.
The RSI is high, so this is one to watch. It may come down a bit before heading back up. This should translate to $0.075, before heading back up IF the RSI is to be followed.
The entire crypto market is starting to shape up into a 2017 style bull run. We see the same trends and moves that we did in 2017. Fundamentals:
RSI and MACD are in a long term bullish movement with plenty of room for a breakout.
Comment: Disclaimer: Cryptocurrency market is notoriously unstable and are easily influenced by external events. This is no guarantee of a breakout. This analysis is based on past events and indicators.
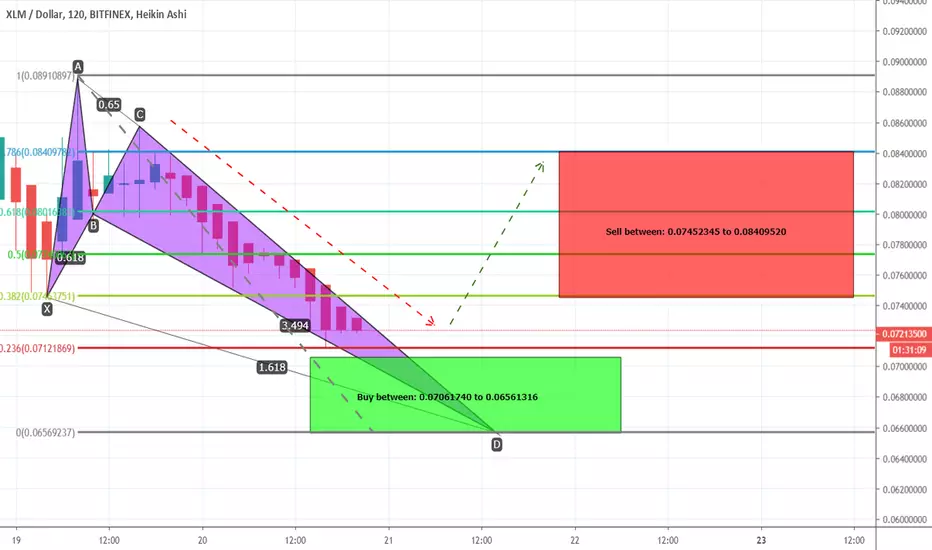
XLMUSD is foming a bullish Crab | Upto 28% expectedPriceline of Stellar Lumens / US Dollar cryptocurrency is forming a bullish Crab and soon it will be entered in potential reversal zone insha Allah.
This PRZ area can be used as stop loss in case of complete candle stick closes below this area.
I have defined the targets using Fibonacci sequence:
Buy between: 0.07061740 to 0.06561316
Sell between: 0.07452345 to 0.08409520
Regards,
Atif Akbar (moon333)