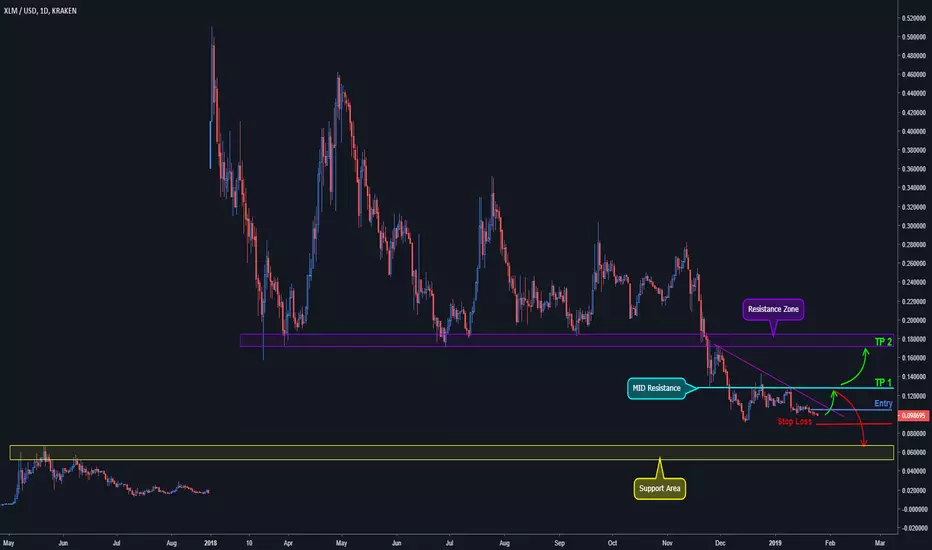
STR/BTC XLM/BTC - Preflight Research -Technicals on the Chart.
For Education Only Please...
Longmoney
PS. TV has some scaling issues
Stellarlumens

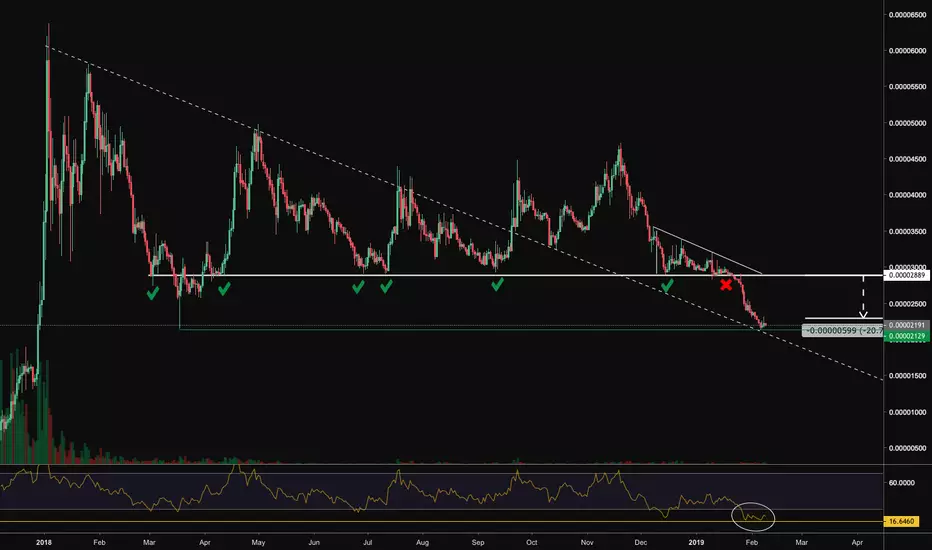
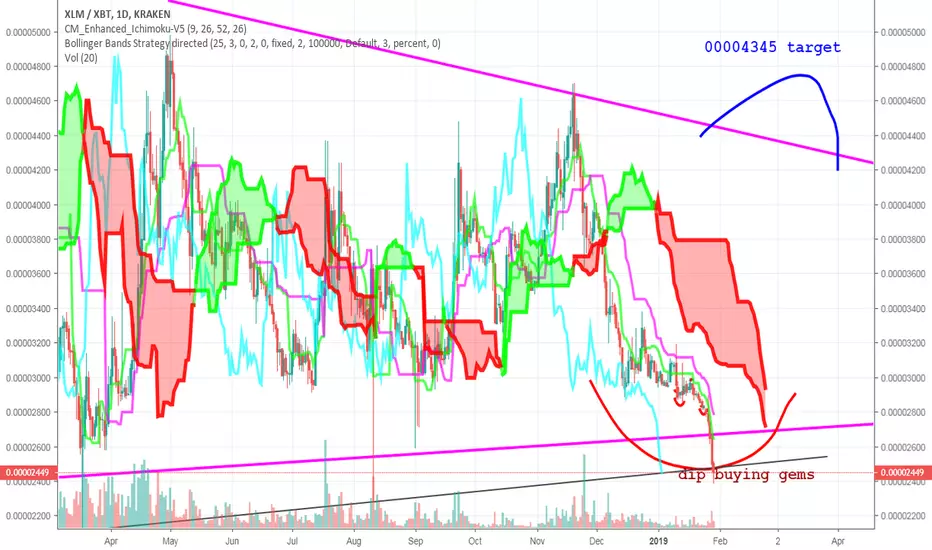
Daily Bullish Signal $XLM #XLM (10 Feb 2019)RED ARROW indicates the EXPECTED Time and Targets
Level Stoploss point up to maximize profit and reduce risk
I'm working all the time, even in Bearish Market
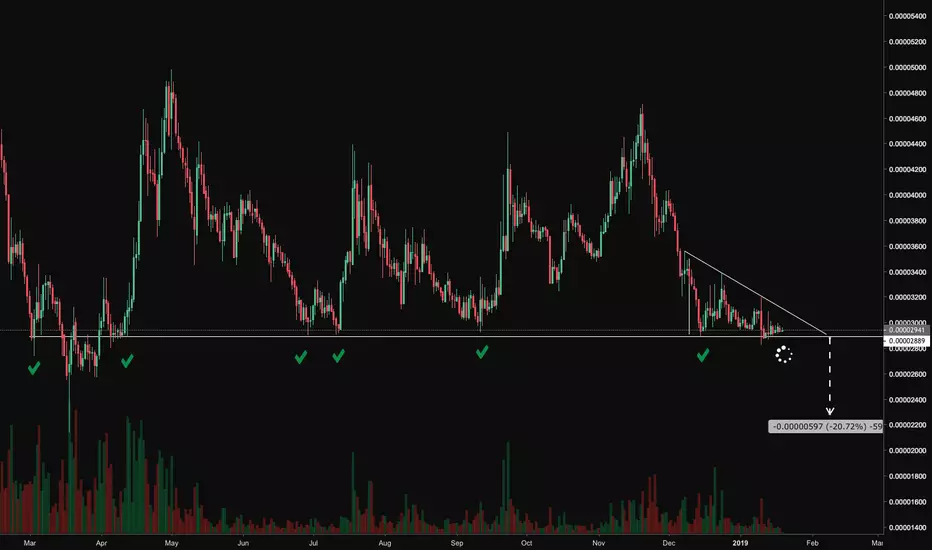
$XLM Stellar Lumens downside target acquired!$XLM update
The descending triangle pattern breakdown, which I mentioned in previous posts, was able to reach the full measured target of 2250 sats, plus a bit deeper.
Price ultimately found what could possibly be its local bottom exactly where we bottomed in mid March, as you can see where the green horizontal line meets the deep March wick.
RSI dipped below 20, which is pointed out by the white circle. This level is the lowest daily RSI we've seen on XLM's chart history (Bittrex). While we did get some relief here, and the RSI is signaling drastically oversold, I'm not yet convinced that this is anything more than a dead cat. Price reached a point of bounce or face the potential of significantly greater downside. Lower TFS hinting that bulls could be tiring quickly, but Bitcoin looks better than it has in days, which could help. I'd be looking for lower TF RSI and Stoch RSI to reset before things looks interesting for longs.
Notably, you will see the diagonal dotted line where price found support. Although not perfect, this diagonal does have relevance as price has respected it for over a year, since its peak last January. Worth keeping an eye on.
Still flat, waiting for more info.
-Bueller
@BuellerFund
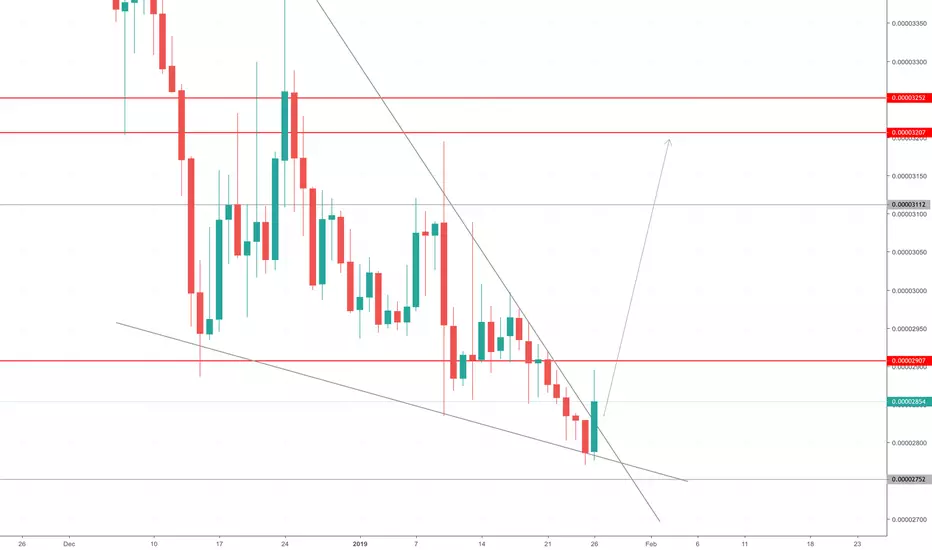
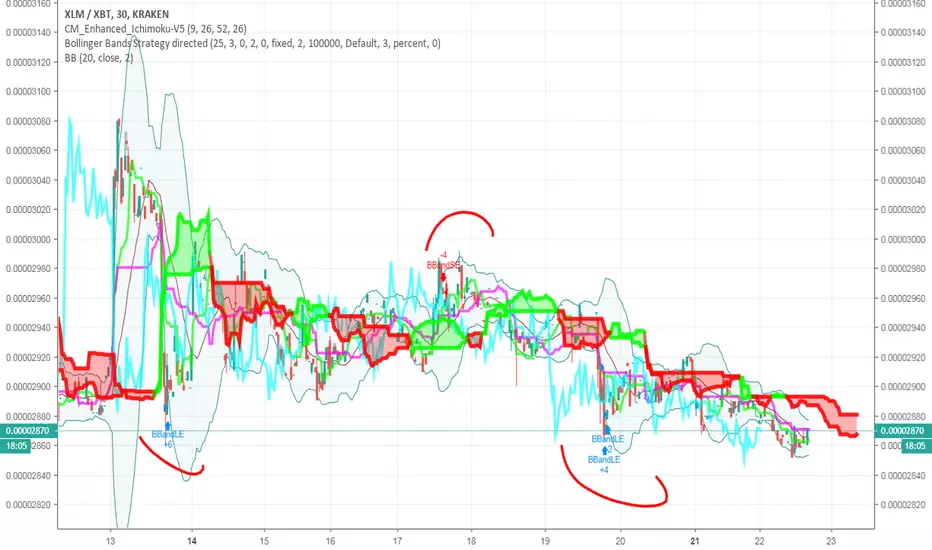
Parabolic Collapse - Dip Buying GemsNow Is The Moment For Fear Buying
play the swing back to 00002855 and 2990
Stellar (XLM) – Searching for the BottomOur Stellar (XLM) article about its forecast in February 2019 will mention some Stellar price prediction ranges from various sources as the question whether Stellar will soon find a bottom is a very challenging one.
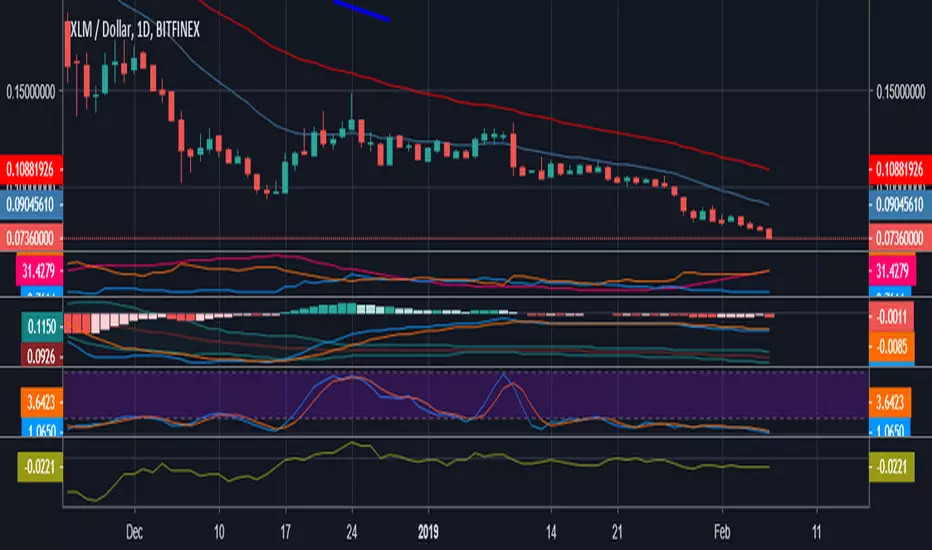
As of Feb. 3, 2019, Stellar has a price of $0,082543, a 1-year performance of -74.50%, and a year-to-date performance of -$26.51. It has declined from the high price of $0.35 in February 2018 to the low price of $0,082543 and has made a recent top at the price level of $0.12 back in January 2019.
Some key statistics for Stellar as of Sunday, Feb. 3, 2019 are:
· Market Cap: $1.582.140.630 USD, 455.573 BTC
· Volume (24h): $116.923.545 USD, 33.668 BTC
· Rank 9 on CoinMarketCap based on top 100 cryptocurrencies by market capitalization
· Circulating Supply: 19.167.472.059 XLM
· Total Supply: 104.682.543.032 XLM
· 52 Week Low-52 Week High: $0.0824- $0.4798
Stellar price prediction bullish scenario
The weekly chart shows a strong downtrend with not any confirmed signals of trend reversal from a downtrend to an uptrend. The daily chart is also very bearish for the price of Stellar.
We can mention only two positive signals, a positive divergence for MACD and a Stochastics indicator (14,3,3) being in deeply oversold levels, below the level of 20. If price is to bounce, a target would be the level of $0.0970, where there is both strong support, now turned to resistance and a declining 20-day exponential moving average. A higher target would be the upper daily Bollinger band, currently at $0.1123.
Stellar price prediction bearish scenario
The well-known motto in trading ‘do not fight the trend, until it reverses’ is highly applicable to the current trend of Stellar in 2019, a continuation of a very strong downtrend started in 2018. It is very challenging to try and find a potential bottom for the price of Stellar Lumens at these very low levels. But it is just an opinion and not any investment recommendation.
The weekly chart shows a strong downtrend, with not any support levels below the current price of $0.082 as of Feb. 3, 2019. MACD indicator is pointing down, the strength of the trend measured by the ADX/DMI indicator is strong, and the Stochastics indicator is at extreme oversold levels but with not any signs of making a bullish crossover yet.
The daily chart is similar to the weekly chart. The support level of $0.096 which was formed in December 2018 was retested and broken to the downside. With declining 20-day and 50-day exponential moving averages and a strong downtrend, it is very risky to be optimistic about Stellar price at these levels. The odds are in favor of a further downtrend continuation. We cannot find any support level as potential price target, but an estimate would be lower prices near the level of $0.007-$0.06.
The technical analysis for now is very bearish for Stellar and is too risky to predict a bottom. Our Stellar price prediction, just an opinion is therefore that downtrend most probably will continue in February 2019.
Stellar (XLM) - 21 Week Trading Program (LIKE + FOLLOW)The goal for every technician is that his or her chart should be so easy to understand that someone with zero trading background can follow it.
After a week of brainstorming I'd like to formalize my TA into specific blocks and give viewers different options that best fits your needs/expectations. Here's the plan starting Monday, February 4th as I launch my 6 month trading block. So I hope you come follow and join me for the ride.
Mondays - Market Forecast ( Publish Top 10 Coins report)
Tuesdays - Video upload on Trading View (10 minutes of TA on Bitcoin and Alts + News + TA training topic)
Wednesday - Market Forecast (Publish Top 10 Coins report)
Thursday - Video upload on Trading View (10 minutes of TA on Bitcoin and Alts + News + TA training topic)
Friday - Market Forecast recap (Review our weekly analysis, what did we do right or wrong and game plan for the following week)
Here is a taste of what my charts will look like going forward
Regards,
Bobby
-Don't hate the hair, hate the game

XLM Looking very bullishXLM has formed a double bottom with a textbook bullish divergence formation, indicating it is in a perfect position for a decent burst upwards.
- Double bottom
- RSI very bullish
- MACD very bullish
XLM, do justice to your logo!

Stellar Lumens Failure Weekend, or Reversal decisionThe problem is that nobody is buying, meanwhile SDF and Jeb are dumping their billions of XLM for fiat during an exit dump

XLM/BTC Weekly OutlookHey Buds, today I'm taking a look at the weekly chart for BINANCE:XLMBTC . Been watching this chart for a while now and with today's price action the long term support box in blue has seemly been violated. If we get a weekly close below this box I expect a further drop in the XLM/BTC pair. This support box has been respected since the first week of April since last year which one would expect will act has a decently strong resistance if we drop by a hefty amount. If you're interested in this project and want to get in my opinion I'd wait for a better entry.
Cheers,
Chloster

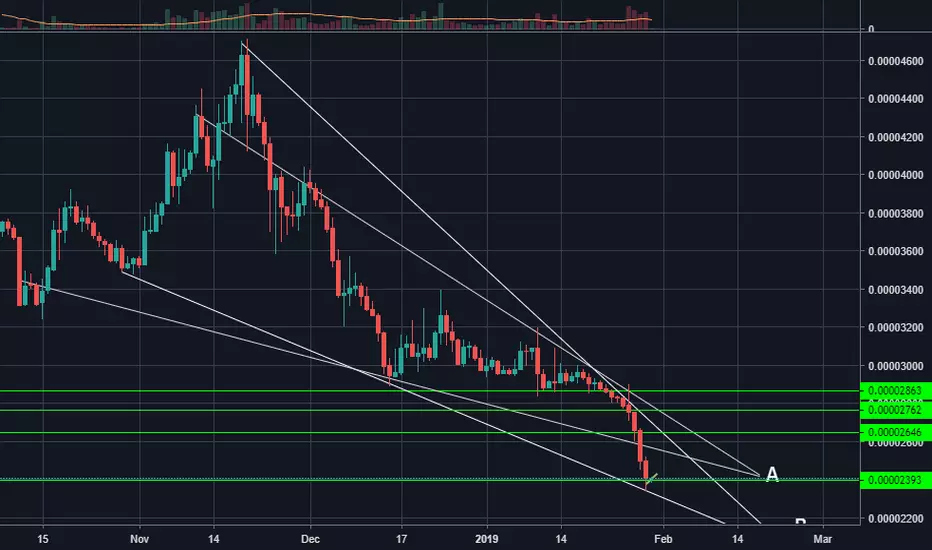
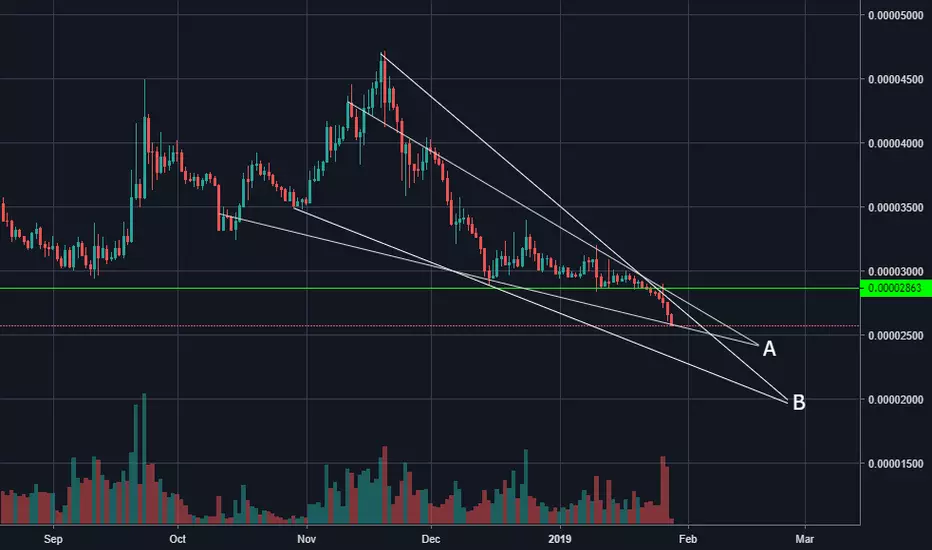
$xlmFollow up from last post. I was hoping for option A route but the alt coin wanted to go with option B
I bought on the way down on this coin and i just doubled down hard on the last line on the bottom. Be safe with your tades everyone. this crypto be crazy
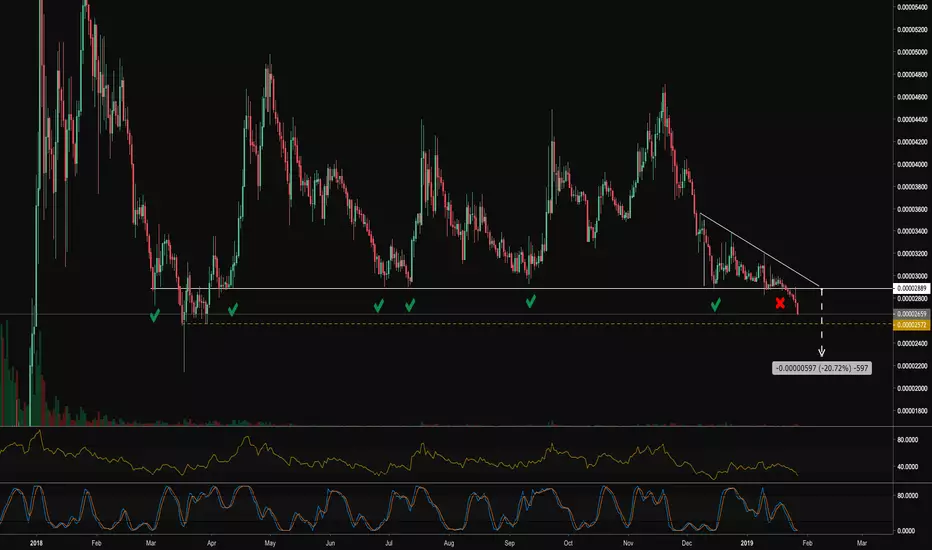
XLM/BTC Low Risk/High Reward RatioXLMBTC currently in a falling wedge. These past few weeks BTC lost quite a few percentage points in regards to its dominance with alts. XLM has not broken out this falling wedge and it's currently sitting on a big support, where in the past, in at least 4 occasion has bounced from and broken out of a falling wedge. Moreover, RSI is showing a slight bullish divergence. Target would be around 0.00003600 satoshis. It could fail if the whole market as a whole dumps. I will keep an eye on BTC, if BTC appears to be breaking up, I will invest in XLM.

Watch out Stellar. Can boom in near futureXLM is holding support zone.
We should now break this level but if we break this then more drops we can expect in coming days.
You can take fresh trade here.
Buy here at between 2520-2530
Stop loss:- If 1D candle close below 2500.
Target are given.

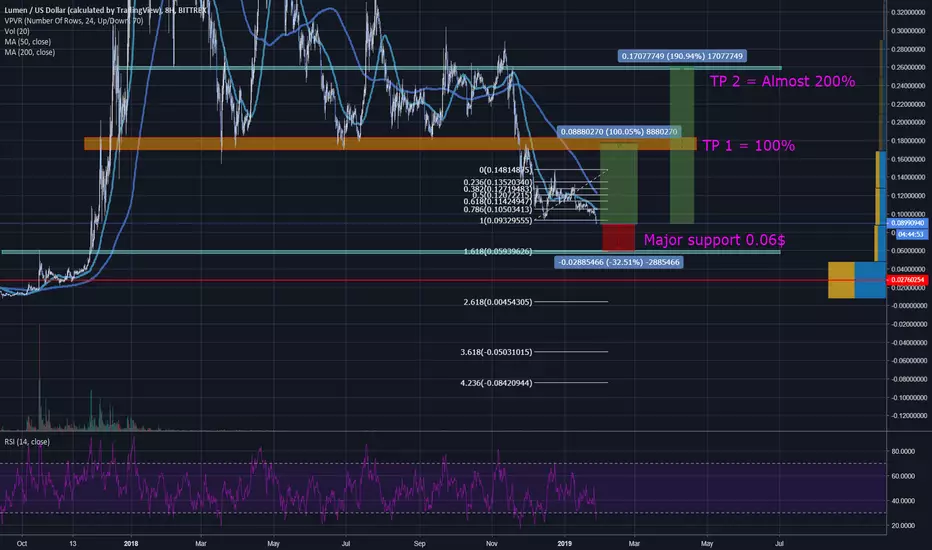
XLM oversold in dip territory ! A best buy ? Let's seeHi guys,
XLM never really pump recently, a massive accumulation phase is currently happening on this coin.
We are actualy on 0.09$ levels, with a really strong support and fibbo 1.618 at 0.06$ level.
The RSI is oversold in every timeframes.
Risk ratio reward -30% for 100-200% gains.
Maybe the good time for a little entry ?
By the way, we continue to follow BTC moves, hope 3500$ will handle.
Disclaimer : This is not an advertisement of investment, just technical analyse.
$xlmThis market could literal go anywhere but i could see two ways this can go.
Option A or option B. What do you think?
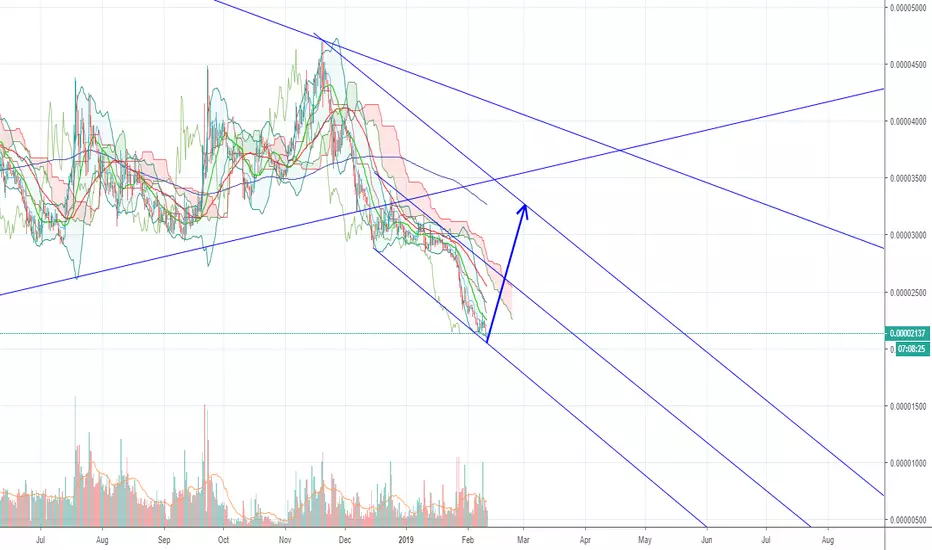
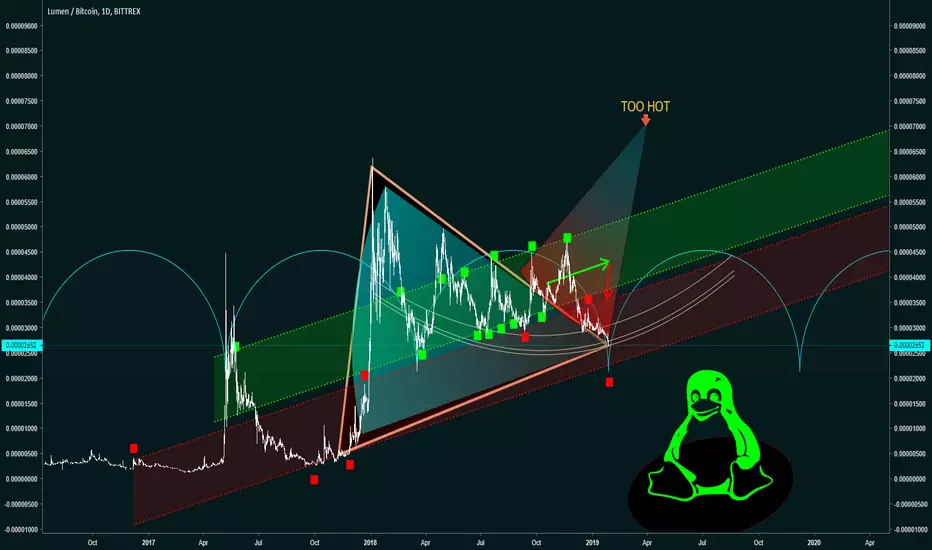
XLM/BTC - The price is back where it should be Compare each shape, line, and channel to price action and touchpoints. It looks like XLM was way ahead of itself and running in a upper channel away from the common wedge pattern. Now compare that to the time cycle trend and you will see XLM is back where the ALGO wants it. This is what happens when a coin starts to decouple from BTC. The master exchange Algorithm is strong.
Bears in control of $XLM$XLM update
Price did, in fact, fail to hold key support level of 3k sats. About to close a 7th straight red daily, with today's candle gaining downside momentum.
Its oversold on all timeframes, as you can see on both the RSI and Stoch RSI. So, I wouldn't be surprised to see a relief bounce around the March 2017 swing low at ~2550 sats, which is the yellow dotted line on the chart. I'm not interested in playing it until price finds footing, but if I were looking to get long I'd want to see sellers loosing momentum and buyers stepping in near that swing low area.
Measured move of the failed descending triangle does land around 2250 sats.
-Bueller
Twitter @BuellerFund
Is XLM about to tank? ...or are we on the verge of a rebound? Since my last XLMBTC analysis, we broke down and have reached for my bearish targets. Currently, XLM is looking very weak. It looks like it's on the verge of a total wipeout. Below here, we do have some support in the 2500-2600 area, and then bigger support at 2000. However, we appear to be in a bit of a falling wedge, which is a bullish pattern. All throughout 2018, XLM did very well compared to a lot of other alts, but has only recently caught up in terms of lost value. This tells me that the year long pennant was probably distribution. This makes sense, since XLM is one of the coins that saw the biggest gains in 2017.
Even though this looks like it's going to break down, we could have a risky long setup here. It's very possible that the coin has simply been under price suppression and will explode upwards rather quickly. Daily RSI has been in oversold for a while and it hasn't bounced at all since the big breakdown, unlike other coins. XRP has behaved similarly, but has yet to make a new low in both USD and Bitcoin value. A while ago, I speculated that if any coins were going to challenge Bitcoin's market cap, it would be XRP and XLM. Recent price action has told me that the XRP and XLM bulls have vacated the scene....but is that really the case? Maybe they're just waiting. We've reached my initial bearish target of around $0.10. Maybe others have been eyeing this level. Who knows? The market looks pretty horrible at the moment, but sometimes when things look the ugliest, they turn around. Often the time you feel like giving up is the time to keep on pushing.
RISKY LONG:
Buy here or between 2500 and 2600.
Stop loss below 2500, although I don't usually use stop losses in this market if you're day trading, since stop hunts are very frequent.
If we go below 2000, this coin will take a long time to recover.
TARGETS:
3200
3500
3700
4000
5000+
POSSIBLE SHORT SETUP:
Below 2500 or 2000. I guess here would be a risky short, since we're already close to a major support.
Although the best short setup was really the breakdown of 3500. A lot more obvious.
This is not financial advice or a recommendation to buy or sell. I'm not a professional. I'm just a hobby analyst.
Good luck!
-Victor Cobra
Previous XLM analysis:

The fall of Lumens XLMStellar advertises itself as an open-sourced, distributed payments infrastructure, built on the premise that the international community needs “a worldwide financial network open to anyone.” The project is filling this need, connecting individuals, institutions, and payment systems through its platform.
XLM-XBT followup small timeframePeter B has called this worthless
125 million dollars worth are being given away
what else is there to say?
Stellar Lumens / Bitcoin (XLM/BTC): Support, Pivot & ResistanceFind Winning Trades In Seconds >> efcindicator.com (Special Discount)
Stellar Lumens / Bitcoin (XLM/BTC): Supports, Pivots & Resistances – Short-Term

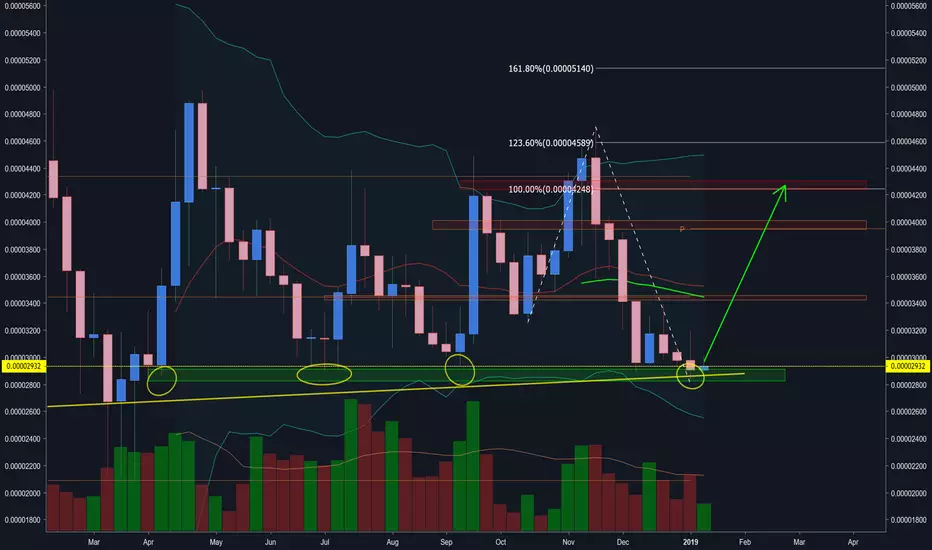
XLM Stellar LumensXLM Looks bullish for long term
Bottomed many time around 3000ish area.
All in the graph.
1st Target 3500ish
2nd Target 4000ish
3nd Target 4300-4400ish
Happy Tr4Ding !