XLM Long Idea In the realm of crypto, Stellar claims its throne,
XLM shines bright, a trade strategy to own.
Fibs and channels, a flamboyant affair,
Unleashing gains, with a confident flair.
With parallel channels, we set the stage,
A path to follow, as profits engage.
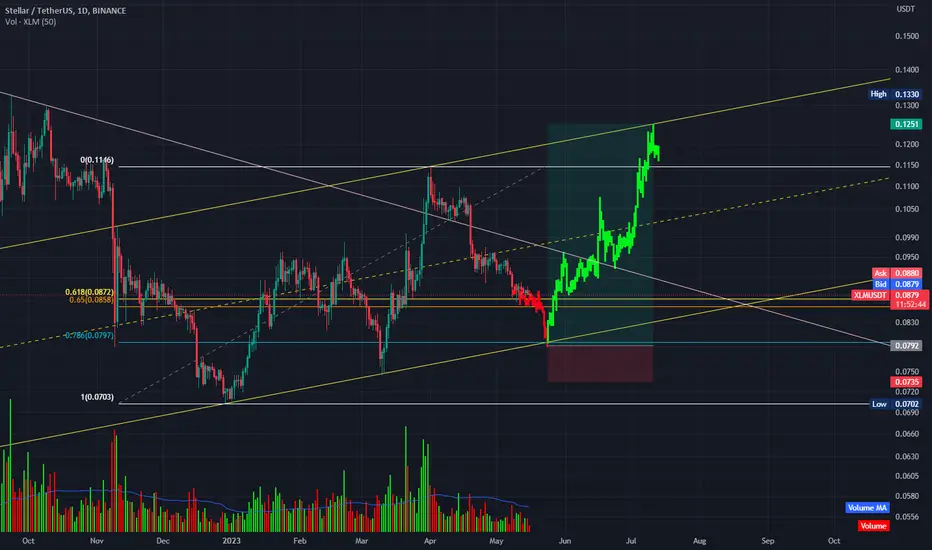
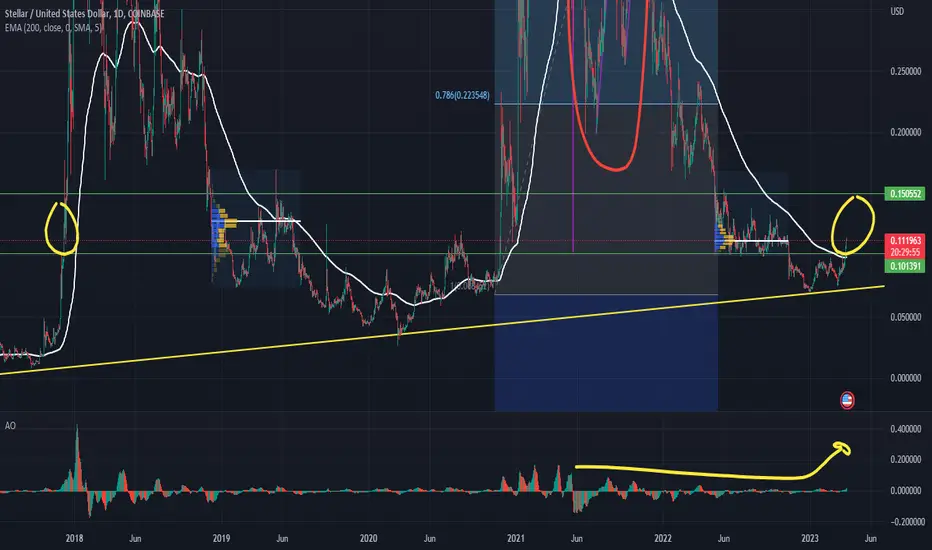
Fibonacci's charm, in the 0.786 zone,
Where the lower trendline beckons us to own.
Stellar's dance of triumph, a sight to behold,
As it touches that level, a story unfolds.
Outrageous gains, like fireworks ignite,
In this trading game, we'll bask in delight.
So let's embrace the XLM trade,
With strategy and style, we'll make the grade.
Fibs and channels, our guiding light,
As Stellar's potential soars to new heights.
But let's not forget, in this thrilling quest,
To be mindful of risks, and trade with finesse.
With calculated moves and passion in place,
We'll conquer the markets, with grace and embrace.
potential targers
tp1 0.0955
tp2 0.1070
tp3 0.1205
DONT FORGET TO SET SL below 0.074
Stellarlumens
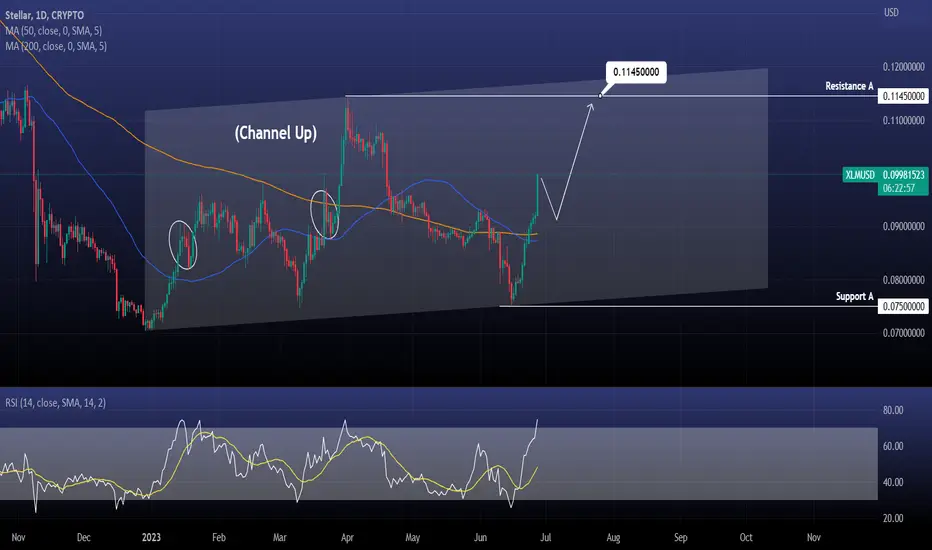
XLMUSD Buy the next pull back and target 0.11450Stellar / XLMUSD is having the strongest 1day candle since March 21st, which was the bullish break out candle half way of the uptrend leg that peaked at 0.1145 on April 1st.
That sequence pulled back first to the 1day MA50 before completing the end of March rally.
With the 1day RSI deep into the overbought zone, it is highly likely to see a repeat of this scenario.
Buy the next pull back and target 0.11450 (Resistance A).
Follow us, like the idea and leave a comment below!!
Bullish on XLM after 0.08$ area is visitedNoticed there’re quite a lot of bullish ideas on XLM shared. I’m also bullish on the long run, but see no reversal signs yet: XLMBTC is weak, EFI and RSI aren’t showing any divergences. I believe more downside is coming and I will consider to step in at 0.08$ area for mid term exposure all the way up to 0.16$ of the upper boundary of the bullish megaphone. Thoughts?
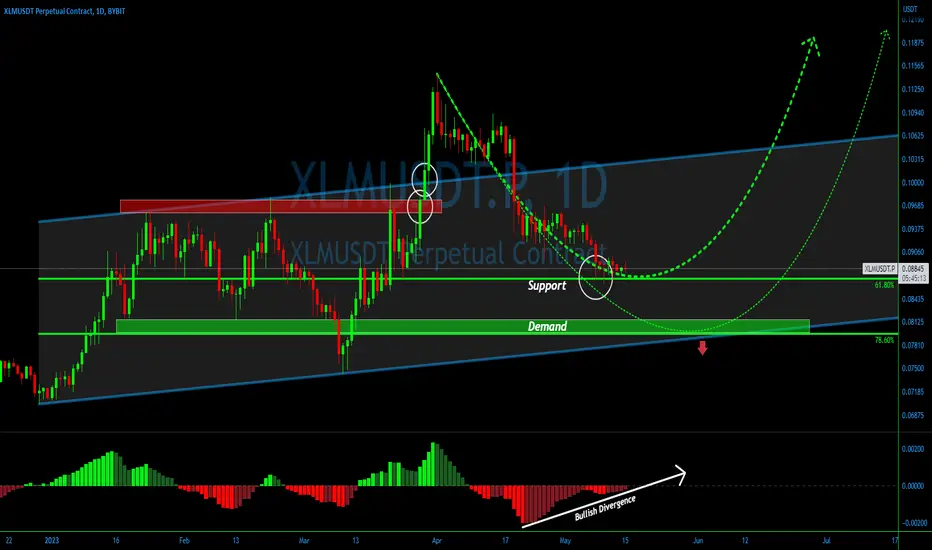
Turnaround in Progress: #XLMUSDT Pullback Nears Completion💎#XLMUSDT successfully shattered the key resistance, signaling a significant shift in market dynamics. The subsequent breakout from the ascending channel propelled the price higher. A subsequent pullback found support precisely at the crucial 61.8% Fibonacci retracement level, underscoring its significance.
💎Notably, the emergence of a bullish divergence on the MACD indicator hints at a potential conclusion to the correction phase. However, to solidify the long-term uptrend continuation, the formation of a new higher high becomes a pivotal requirement.
💎Stay vigilant, closely monitoring the price action for confirmation of a sustained upward trajectory. Exciting times lie ahead for #XLM as it seeks to build upon its recent gains and potentially embark on a new bullish leg.
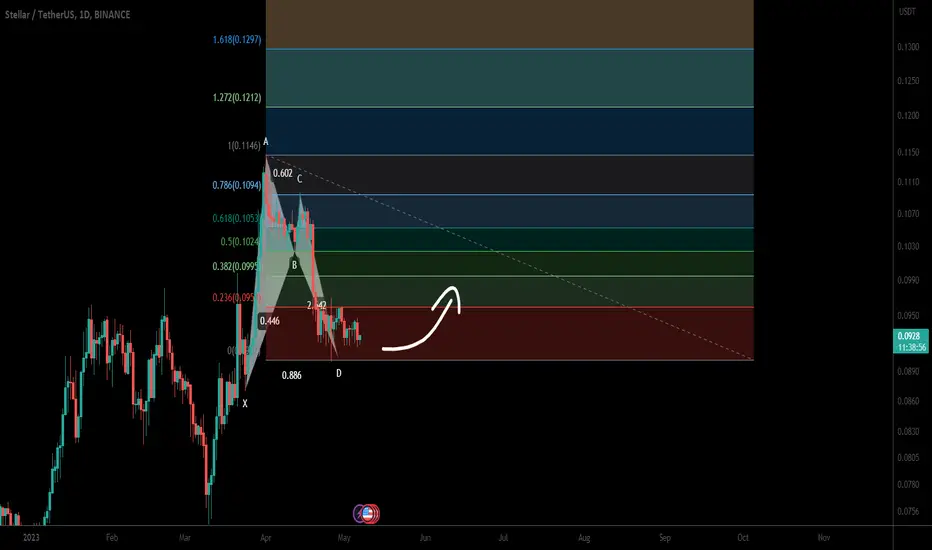
Stellar Lumens XLM formed bullish BAT for upto 25.50% moveHi dear friends, hope you are well and welcome to the new trade setup of XLM with US Dollar pair.
Recently we caught nice trade of XLM as below:
Now a daily time frame, XLM has formed a bullish BAT pattern for the next price reversal.
At the moment after the completion of final leg the priceline has slightly moved up, therefore, we can wait for some price correction to catch from the buying zone.
Buy between: $0.0901 to $0.0870
Sell between: $0.0995 to $0.1094
Stop loss: Below $0.0870
Possible profit ratio:
As per above targets there is a profit possibility of almost 25.50% and a loss possibility is upto 4%.
Note: Above idea is for educational purpose only. It is advised to diversify and strictly follow the stop loss, and don't get stuck with trade
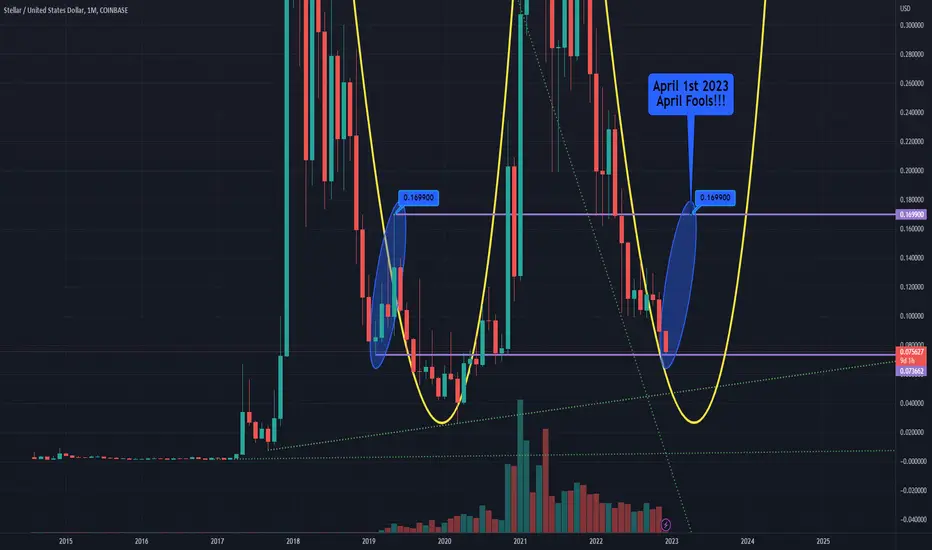
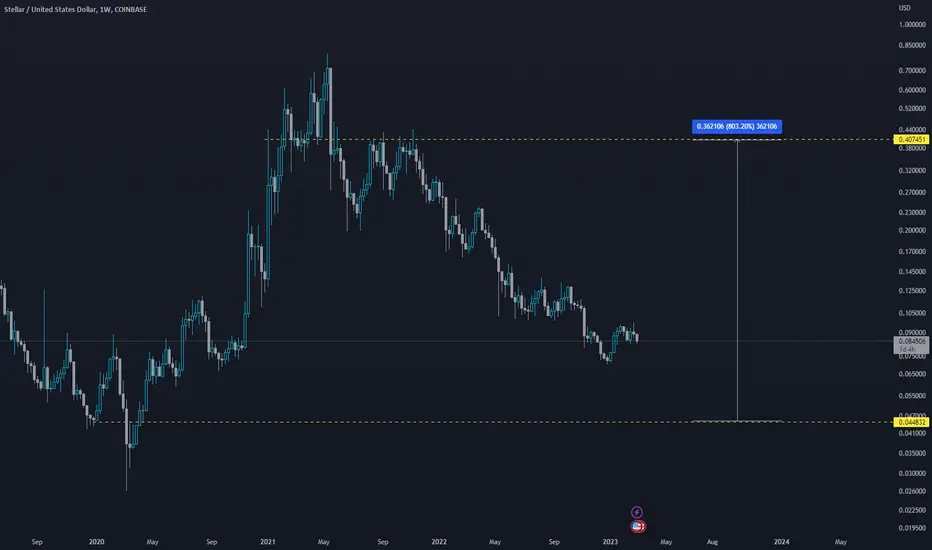
XLM TO $.1699 on April Fools DayXLM to $.1699
What Symmetry!
April Fools!
WE AWAIT THE LIGHT
1X10^(-27) LM
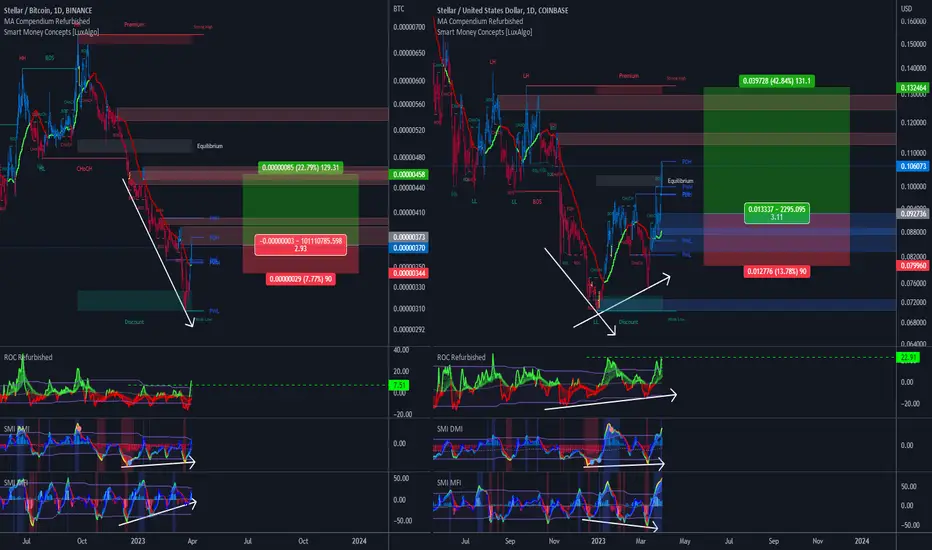
Buy Opportunity in XLM/BTCLooking at the Bitcoin quoted chart on the left side, we have a bullish divergence on volume, as per the Stochastic Momentum Index (SMI) of Money Flow Index (MFI) indicator.
On the chart quoted in Dollars, a divergence was signaled beforehand in the ROC (Rate of Change), allowing an entry at the breakout of the 0.91 value.
XLM - Good Time to BAG RROFITS 💰Hi Traders, Investors and Speculators of the Charts 📈📉
Ev here. Been trading crypto since 2017 and later got into stocks. I have 3 board exams on financial markets and studied economics from a top tier university for a year.
Taking a quick look at Stellar / XLMUSDT which already increased nearly 60%. This is an altcoin that's been on my watchlist since early this year, and I believe a pullback seems logical from this point.
The technical indicators RSI is showing overbought in the weekly. The Momentum in lower timeframes shows that sellers are taking control and the LSMA has fallen under 50.
This point to a possible short term correction, which is only natural after a bullish 60% upward move.
While you're here 👀 Check out LINKUSDT :
My early accumulation plan for XLM :
_______________________
📢Follow us here on TradingView for daily updates and trade ideas on crypto , stocks and commodities 💎Hit like & Follow 👍
We thank you for your support !
CryptoCheck

Stellar's highsI had put all analysis last year before yellow lines there, and the pattern is still predicted until nowadays jaja
It is pretty interesting we have a nice chance with this coin, let's wait.
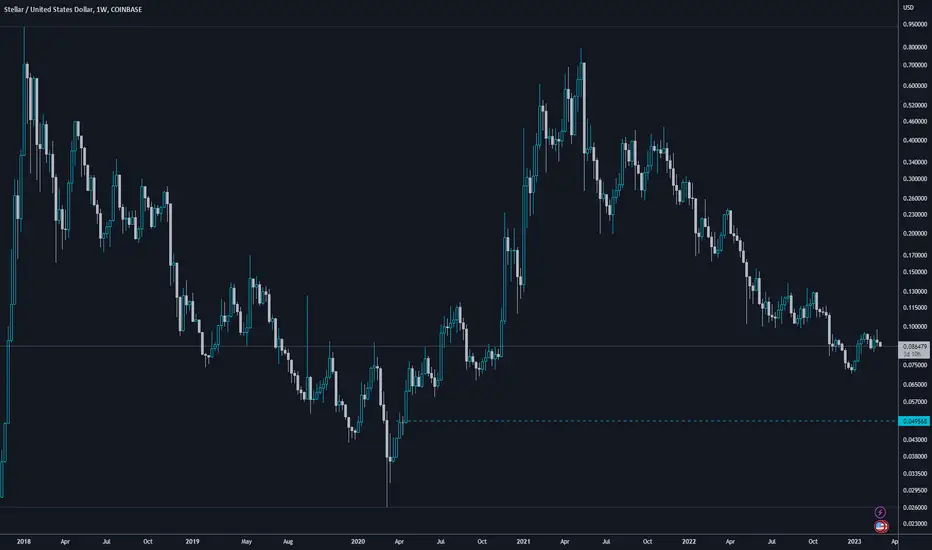
XLM Lights Out on April Fools 2023Don't be fooled...
XLM to .017
XLM Lights Out on April Fools 2023?

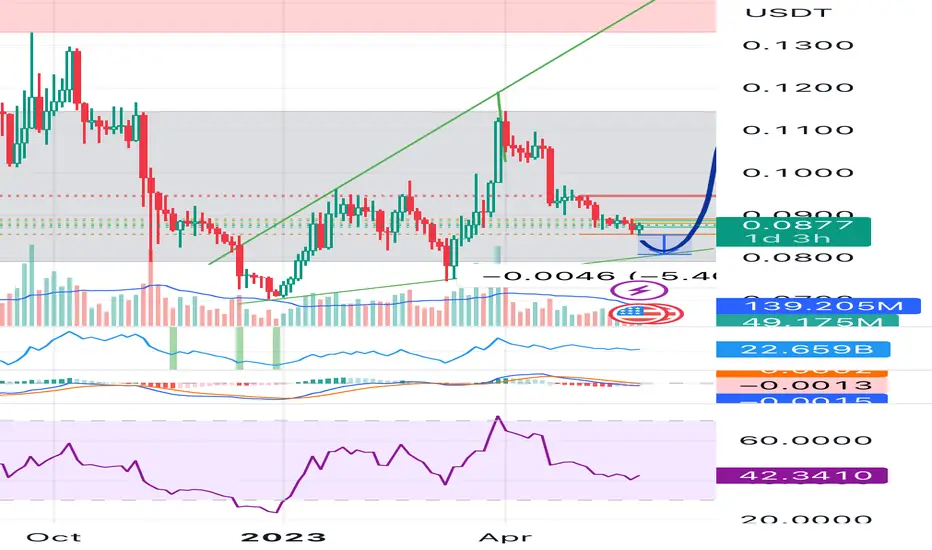
$XLM/USDT 12h (#Bybit) Falling broadening wedge breakoutStellar Lumens looks good for bullish continuation from here after pulling back to 100EMA support.
⚡️⚡️ #XLM/USDT ⚡️⚡️
Exchanges: ByBit USDT, Binance Futures
Signal Type: Regular (LONG)
Leverage: Isolated (5x)
Amount: 6.2%
Current Price:
0.09070
Entry Targets:
0.09060 - 0.08800
Take-Profit Targets:
1) 0.09625
2) 0.10150
3) 0.10670
Stop Targets:
1) 0.08350
Published By: @Zblaba
$XLM #XLMUSDT #StellarLumens
Risk/Reward= 1:1.2 | 1:2.1 | 1:3.0
Expected Profit= +38.9% | +68.3% | +97.4%
Possible Loss= -43.2%
Estimated Gaintime= 1 month

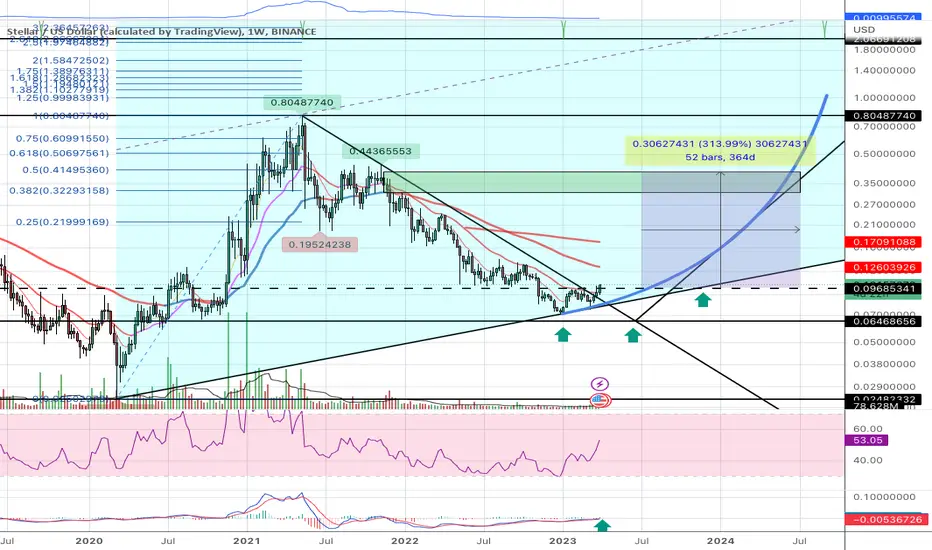
Stellar Lumens Flipping Trends Weekly MACD and RSI beginning to turn bullish suggesting a great opportunity for bulls to take a long trade
First target .35-.40
XLM trying to breakout.XRP has been pushing in the past few hours. XLM looks like it's trying really hard to breakout of the pattern above. If XRP continues north, XLM may follow.

GOOD POTENTIAL FOR XLM!As you can see here, XLM is forming a very good bullish candle on daily timeframe (still have 7 hours to close from the time of writing, but still nice)
I predict that XLM may go testing the 200 EMA, or at least go up to the levels I draw on the chart
Let me know if you think my analysis is useful

This coin is Stellar! XLMnice idea here for the crypto veteran. a bit more downside a nice slice of around 50% but after that its rocket ships boys. potentially new ATH just spitballing here with a conservative effort to .40
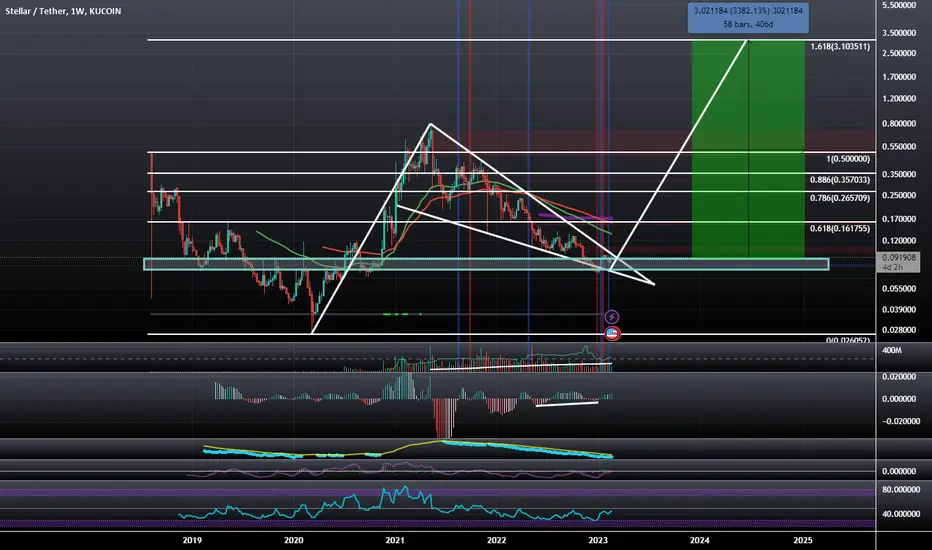
XLMUSD: Falling Wedge Sitting Above Support/Resistance ZoneXLM has showing Bullish Divergence within this Falling Wedge at the very important Support/Resistance zone at around 9 cents and looks to be ready to brakout soon. If it does Breakout i think it will start an AB=CD move that would take it to the 1.618 at $3.10 but the measured move of the wedge alone would take it to the much more conservative 0.886 target up at $0.35 this will likely move whenever XRP decides to move.
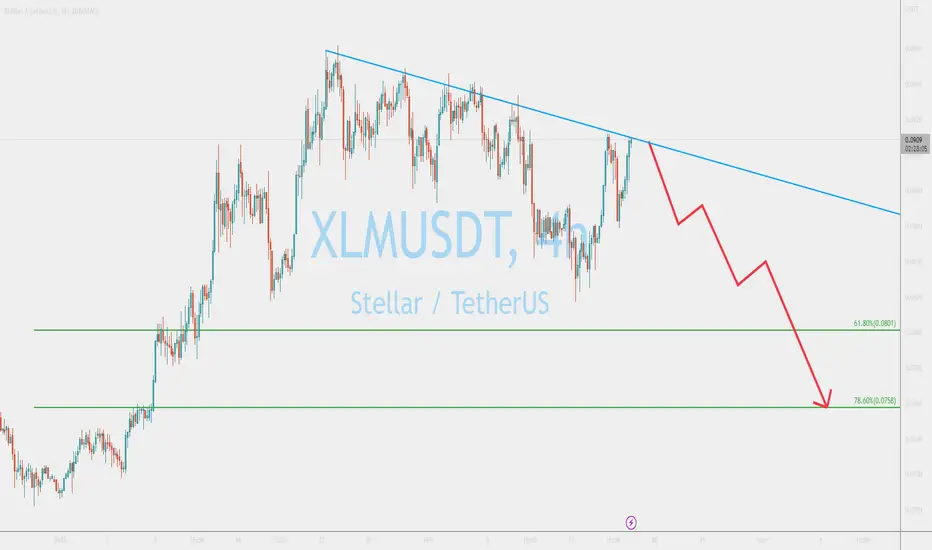
XLMUSDT downside risk has increasedWe had a strong uptrend across the cryptos, although XLM remains one of the weakest gainers. In fact, short-term trend is turning bearish, and there could be a substantial price decline.
Stellar Lumens - Looks good technical and fundemental - 2023!!This is not financial advise to go all in big, DCA and use risk management otherwise if you like go big on this investment
Stellar Lumens is more than an investment hold to 2025 and more, you can trade it if you like
On the fundamentals side Stellar Lumens has so much going for it. Too many turning a blind eye on this because it moves slowly
Would not be surprised if intuitional investors buy up big in big volumes for 2023
Some links to do with Stellar Lumens for own research
www.coindesk.com (IBM partnership with Stellar Lumens to issue stablecoins through World Wire)
stellar.org (USDC stable coin running on the Stellar Network)
stellar.org (Moneygram partnership with Stellar for remittance payments)
satoshipay.medium.com (SatoshiPay partnership with Stellar for micropayments)
stellar.org (Representing Blockchain on the Commodity Futures Trading Commission’s Global Market Advisory Committee)
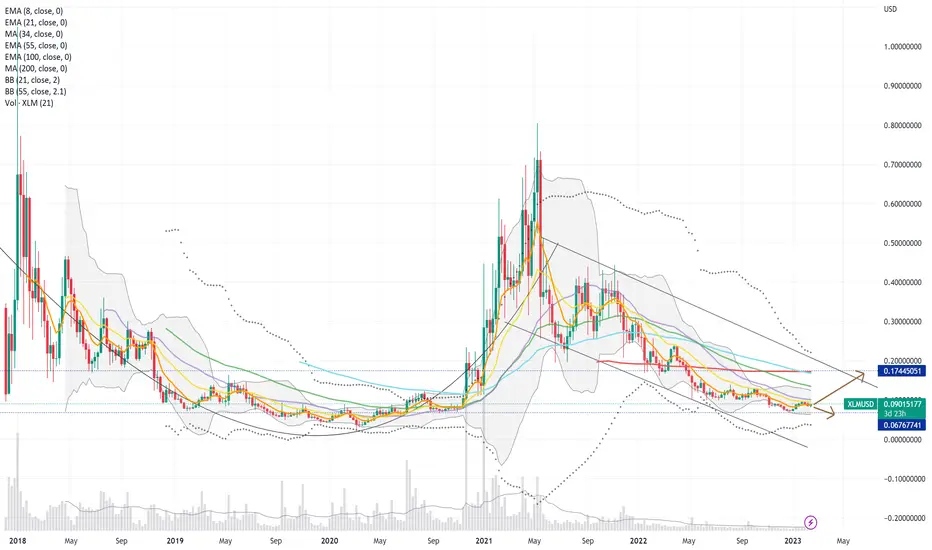
Stellar Lumens Coffee Cup pattern on the Weekly chart - see the handle of the coffee cup? Once break it on the weekly, it has to close above $0.175 US and than it can do 10x - believe it reach $1.75 US, instead of the $0.82 US last high. Now it can bottom out 1 more time till about April 23 around $0.0676 US, the last bottom on the weekly was $0.07 US and believe it has bottom out. You can wait or DCA now. I believe it's still a very good buy now, trying to work out the perfect bottom forget it. On Weekly Stellar Lumens can still be bearish around June 23rd however for that case it going up slowly till it breakouts
If you confident about Stellar Lumens I would like this article post to have more research links for other bullish scenarios for the Stellar Network
Could SWIFT payments be replaced on the Stellar Lumens network as the alternative faster and reliable form of payment transfers?
Could Nasdaq exchange allow digital payments for trading on the Stellar Lumens network?
XLM STELLAR What Is Stellar (XLM)?
Stellar (XLM) is a peer-to-peer (P2P) decentralized network created in 2014 by The Stellar Development Foundation or Stellar.org. The network officially launched in 2015 with the purpose of connecting the world's financial systems and ensuring a protocol for payment providers and financial institutions. The platform is designed to move financial resources swiftly and reliably at minimal cost. Stellar links people, banks, payment processors and allows users to create, send and trade multiple types of crypto.
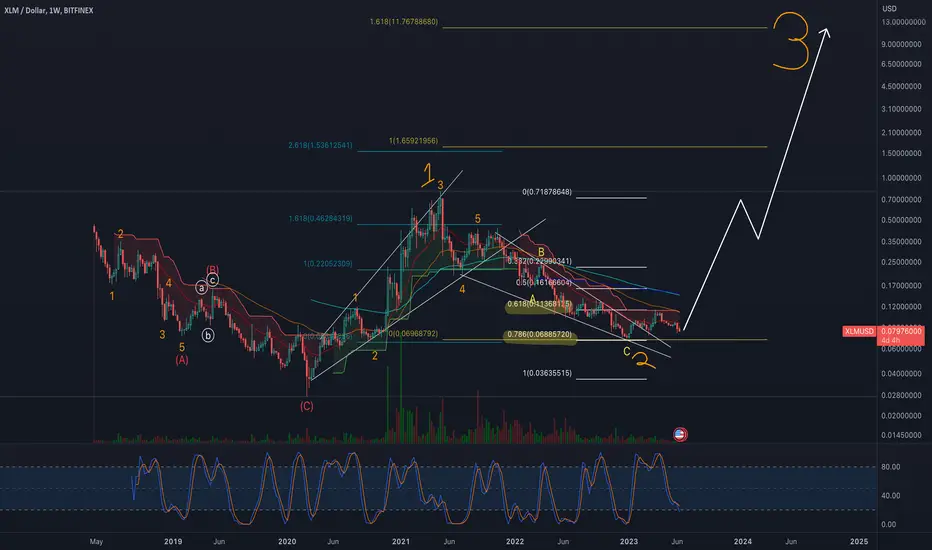
AW Stellar Lumens Analysis - The Overall View Explained...Viewer discretion advised: Some XLM bag holders may find my views disturbing, don't shoot the messenger.
In this video I produce some commentary on where XLM could fall back down towards.
I also go into some detail about the current Wave C which I believe is currently in a third-of-a-third wave.
If you have seen my recent updates on Oil, Dow Jones and the Euro you will understand how this is no different.
On the positive side, this could be the last move down before we see a bottom or lowest point within the correction.
If you believe that we are in Wave 2 overall, then it is not hard to see why this correction is a deep one.
This is why they refer to Wave 2's as a second chance to enter the market.
Whether or not you like the idea of this happening is completely irrelevant.
Remember to use Disciplined Money Management Principles to ensure longevity as a trader.
If you don't know the long term pattern shouldn't you be doing your research instead of just following the crowd?
Just remember: I am not a financial adviser; I suggest using this only as a guide. Always do your own research.
***AriasWave is not the same as Elliott Wave so your counts may differ to mine if you happen to use it.***

XLM - One of the Sexiest High-Time Frame Charts Out ThereOh yeah! You're seeing that chart right. This looks like a great long entry to me, bouncing off two strong support levels and breaking out of a long-term trend. I'm long, really really long!
