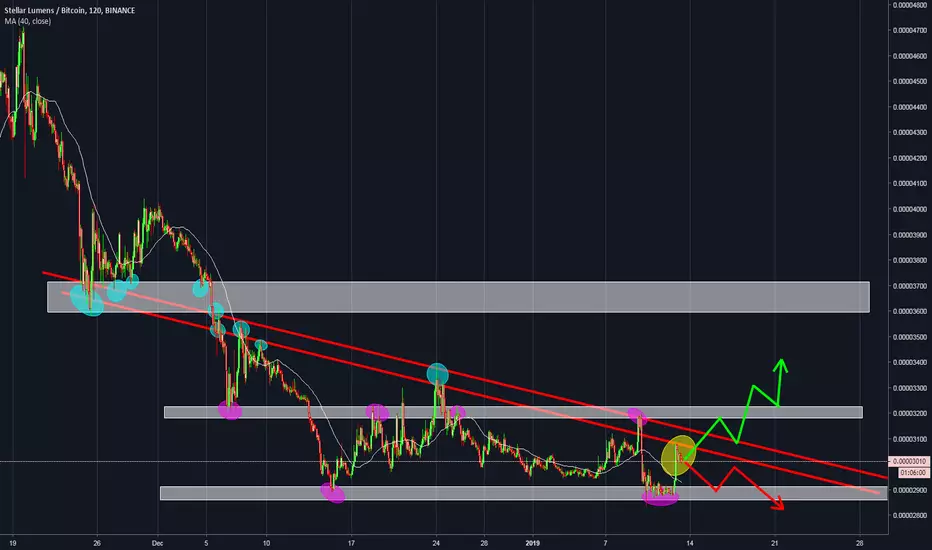
Stellar Lumens SHORTvemos a stellar en tendencia bajista formando un triangulo descendente, en las dos directricez, bajista marco dos juntas , ya que no es solo una simple directriz si no , que es una area gruesa y por lo cual recurro a utilizar dos directrizes en vez de una , para poder demarcar , mejor el area de trabajo , esperemos buscar una buena venta en la parte superior de ese triangulo en la directriz o en las rupturas de los soportes inferiores , por ahora no veo compras!
Stellarlumens
Can Fall Some more 0000275 long @ spot for 65% 000045solid counter trade against the booming ETH TRX LTC WAVES and others
when swing traders pivot to other highly liquid macro Altcoins, Stellar will soar (perhaps XRP BSV ETC ZEC also)

XLM Double Bottom: Setting Up For Big Move Higher $XLMClassic double bottom reversal. Big risk reward trade idea.

XLM PUMP INCOMING!!!!Hey fellow traders,
Here we can see a clear bullish divergence in the RSI and the PRICES.
It's the perfect time to Buy-In as we will see a great rally soon!!!
Happy Trading,

XLM (Stellar Lumens) Elliot Wave AnalysisHello guys,
XLM started its wave around November 23rd 2018 and finally reached wave (5) December 15th.
Zigzag correction wave to be valid:
1. B wave needs to retrace between 0.786~0.886 of X to A.
2. C to retrace to 1.12~1.272 of B of A.
It is now on 'potential' corrective pattern. Assuming that the wave is playing a zigzag correction pattern, B validates when it retraces to 0.886 exact point from X to (A).
And now heading towards C.
Other things to consider:
1.It also broke out from falling wedge pattern supporting point (B)
2.Has a strong support 2900~3000 area from Jun, July and September.

Stellar Looking Good for a Quick ShortIts been a long, long time since we’ve had the chance to look at $XLM. So, we’re going to take the time to do so now:
In the above chart, we’re in the H4 resolution.
However, before we cover what’s going on in that picture, here’s another one of the same chart resolution with a little more detail added for insight:
In the picture above, we can see:
1. Mini-downtrend resistance that’s just above where the price is now. RSI(14) is already overbought after a ridiculous surge in the past few periods. There’s a chance that exhaustion could be reached with the bulls on this coin, which would lead to a consolidation.
2. The RSI(14) is a big deal. The reason why is included in my annotations for XLM’s RSI on the H4 resolution.
Let’s look at some support and resistance points on this time frame as well:
In the picture above, the two dotted green lines represent two major points of support and resistance.
There is a third, slightly less potent, overhead resistance that must be accounted for as well:
Again, this is the H4 resolution for $XLM (Stellar Lumens) using the Binance Exchange as the source for price data (its the most reliable and where the most volume for $XLM is at).
Putting All of This Together
In my opinion, just the information that we have here is enough for us to come to a conclusion on the position that we want to enter here on $XLM.
My idea here for $XLM is to enter into a short position (temporarily). For those that are subscribed to the Patreon, I’ll explain what my longer term strategy for this coin would be moving forward from this point.
Here is my R/R on the trade:
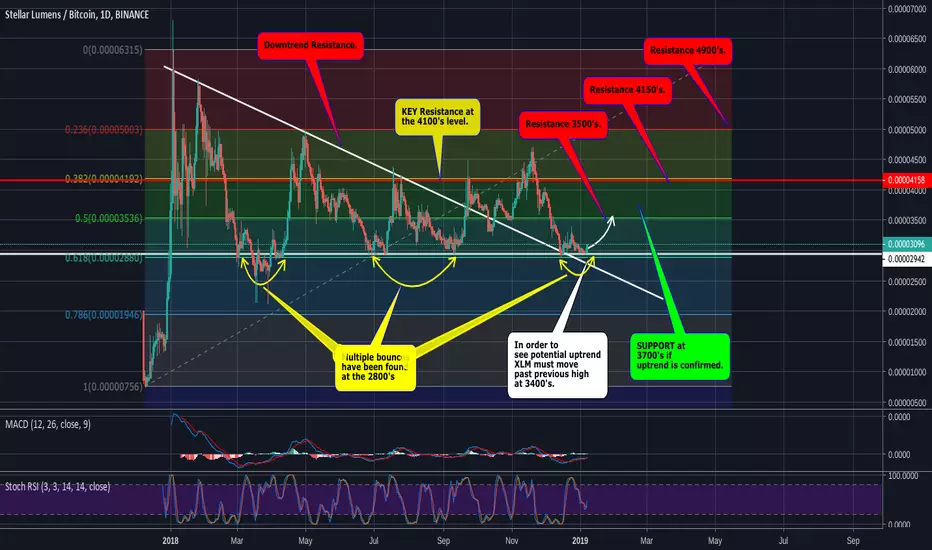
XLM "STELLAR LUMENS" 3500's INCOMING...Will we hold!?!Hi guys! I have done a quick analysis on XLM.
Make sure to LIKE and FOLLOW as this helps others to discovery my content.
Lets get right to it!
XLM on the DAILY time frame, Stochastic RSI crossing to indicate bullishness
as well as the MACD crossing upwards to indicate Bullish divergence.
On Binance the current volume in BTC is at the time of writing this 1,539.
I will be monitoring the incoming volume on binance in order to see if we can see
enough volume to start a uptrend on XLM. Right now i still am not yet convinced
on this breaking out as i will sit on the sidelines and just watch until i see
XLM move past 3700's following a retrace i will enter on CONFIRMATION!
Thanks, LiquidMEX
DISCLAIMER:!!!This is not to be considered financial advice is my personal opinion, always do your own research before entering or exiting trades as i will not be held liable for any of your trades!!!
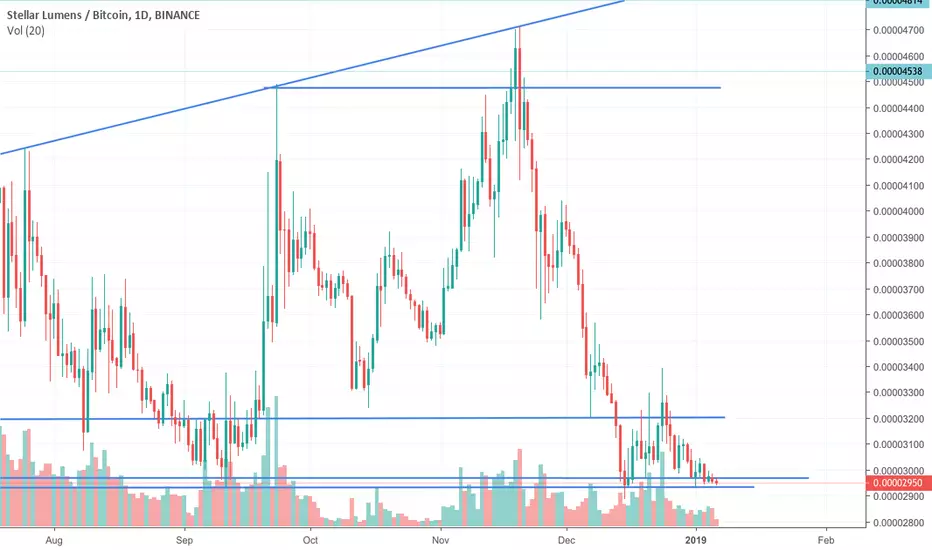
XLM Support as strong as Hercules!! We are READY FOR TAKE-OFF XLM shows strong support at level 2930-2970 and has never been broken since April 2017. At this moment XLM is hanging around this same support level and is ready to bounce off to new highs. Expecting a bounce at 2930. New resistance at level 3010 and 3260. Expecting level 5200 somewhere in February or March.
Support Level: 2930 - 2970
Resistance Level: 3010 & 3260
This article is for education usage only.
XLM breakout!Hello!
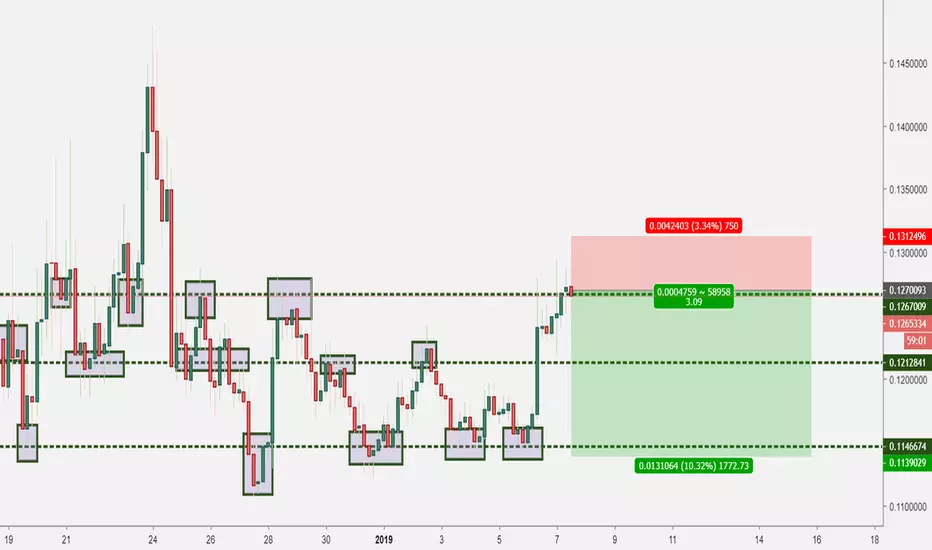
XLMUSD has been showing some bullish signs after finding support in between the 50-60 % retrace from the miniature bull flag whilst squeezing on the monthly moving average with the drawn trend line signaling a breakout if we have a rally that breaches and closes with a few lines above the MA.
In the case of a breakout we can expect a surge upwards 0.14 level marked with the dotted line before a retest of validity on MA monthly current area, which also is the top of the flag pole. After the retest a surge towards 0.18 can be expected forming a finished BEAR flag in the bigger picture signaling a down move.
If the breakout fails (small bear flag completion) at the break of the the trend line expect a move to the 0.10 (if worse 0.05) level forming a double bottom (if 0.05 its a stop loss hunt for larger orders) where most likely a lot of buy orders will be sitting lurking for an opportunity to be filled.
if you like my short summary make sure to like this analysis as i will try to make more of these and update them regularly!

XLM ready for first pump of 2019 ?!XLM testing again 3k support, rebound now but we need more volume for our first pump of 2019. FUD from TRX on social networks lately, but pretty sure incoming new partnerships/airdrops and latest develppment updates will dissipate the clouds!


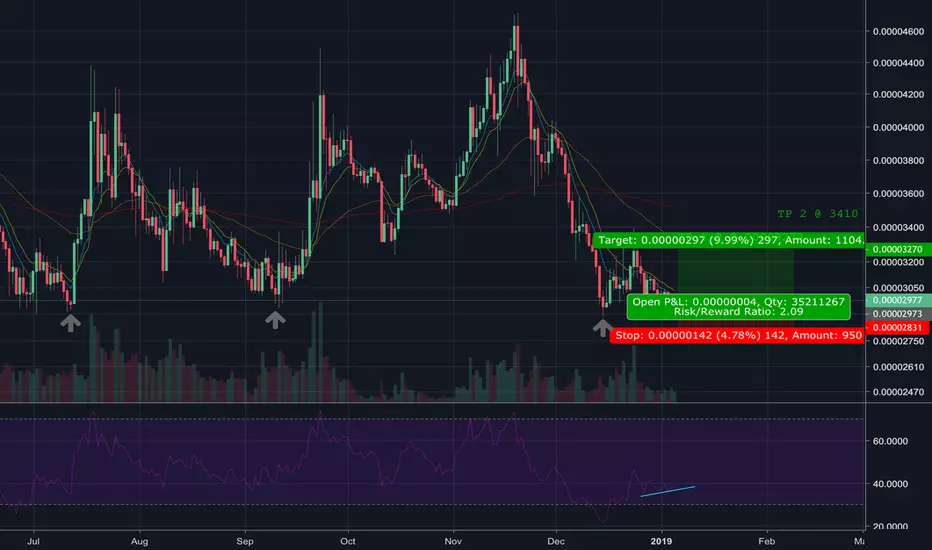
Stellar Lumens - Looking for a BounceHello chaps!
I'm looking at a long here with the first target set at 0.00003270.
My theory is; a double bottom style bounce due to strong previous support on the swing lows.
Now, I know Altcoin support zones are laughably thin, so my stop would be set quite aggressively at around 0.00002830 mark (just under any previous wicks).
RSI might be just teasing us here, but you could be mistaken for a whiff of bullish divergence.
That's all for now. Cheers!
---
Getting my feet wet with TA, so I'm open to criticism and willing to listen to any advice from the more seasoned out there.
In the words of Carter Thomas "None of this is professional advice, just a random dude on the internet giving his opinion" :D
when stellar, stellar? $xlmits here or there, we need a convincing break of triangle or we head to 2k but i feel its here.
saw a great fractal of ripple in this zone before it took off.
we watch on...

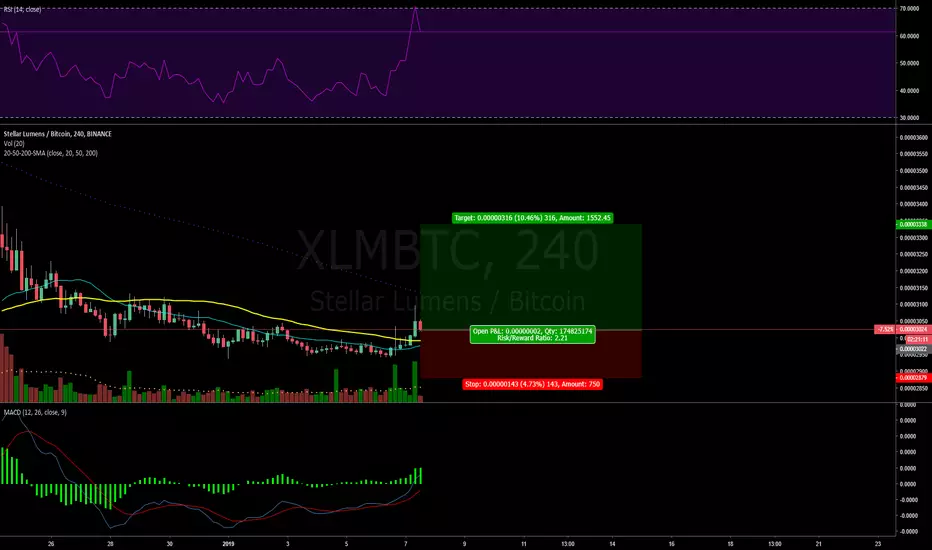
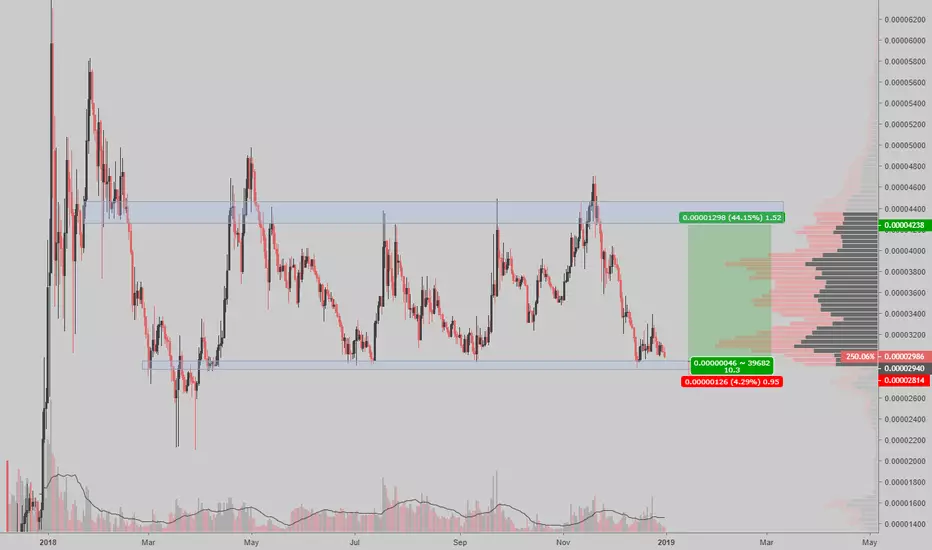
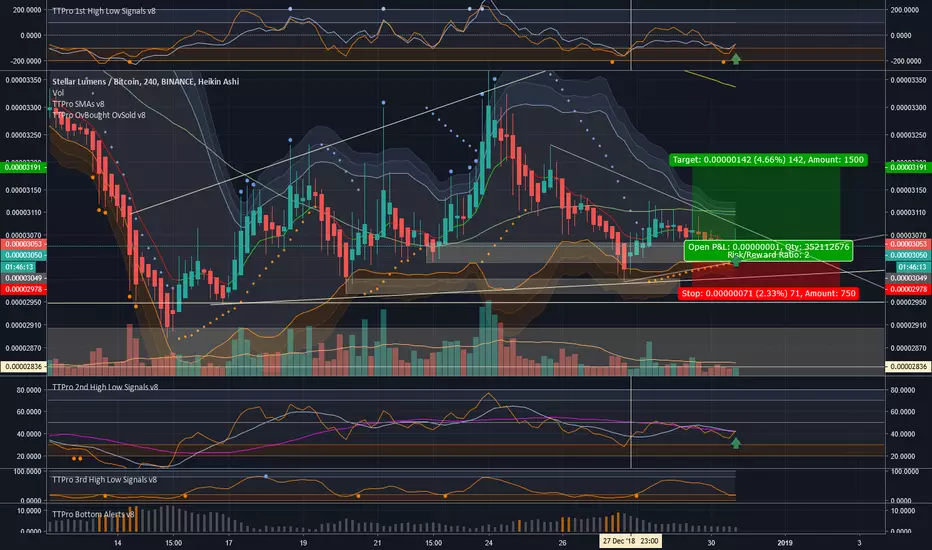
Stellar Lumens at the base of the range, long setupStellar Lumens at the base of the range. After so many attempts the support may fail but the ratio is great (4% stop vs 44% profit). Active development and recent good news may help the rise.
$XLM long of this green heikin ashi 4hDouble click the price column to see the chart. My trade set-up $XLM Stellar Lumens. Im in for the mid to long haul with swing trading along the way to build my account. Not financial advice.
Wait for confirmation. Keep short for now..$XLM under a sell signal from the UCTS since Nov 22. Around 30% drop since that call. Right now on a descending channel, really close to a strong support around 2900Sats. Set up alarms at that level if price breaks down. Volume doesn't look strong for now, $XLM
If price breaks out from this channel, I would expect it to raise at least to EMA50-100-200 that are very close to each other. For now I will just wait for some confirmation in order to buy XLM. $XLM #Stellar

Stellar: XLM Buy Opportunity !!Buy XLM At Current Price and HOLD For Mid term then XLM Gives a Amazing Profit upto 60%.
You Can Also set Own Risk reward.
Let see what Will be Next Move.
Warning- I m Not a Financial Advisor this idea Only For Educational Purpose Only.
Thank You !!

Daily Bullish Signal $XLM #XLM XLM/USDT (27 Dec)BLUE ARROW indicates the EXPECTED Time and Targets
Level Stoploss point up to maximize profit and reduce risk
I'm working all the time, even in Bearish Market

Stellar seems good buy here.Stellar lumens is following an uptrend in 2h chart.
You can buy some stellar here at current price.
Target is given in chart with stoploss.
Second reason for holding Stellar decentralised exchange is to be launched on 31st december.
Hold your bags.
Invest at your own risk. profit is yours and loss is also yours.
Follow me to get instant update of market.

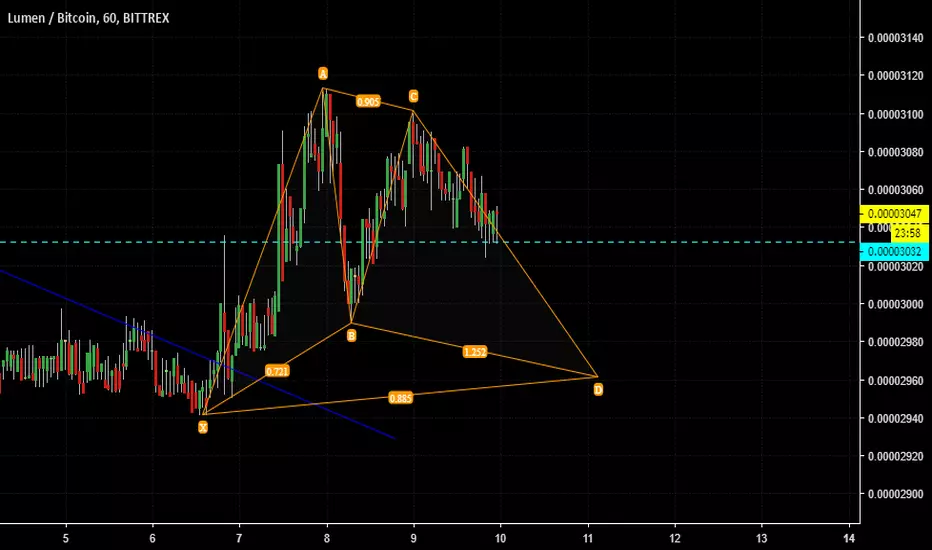
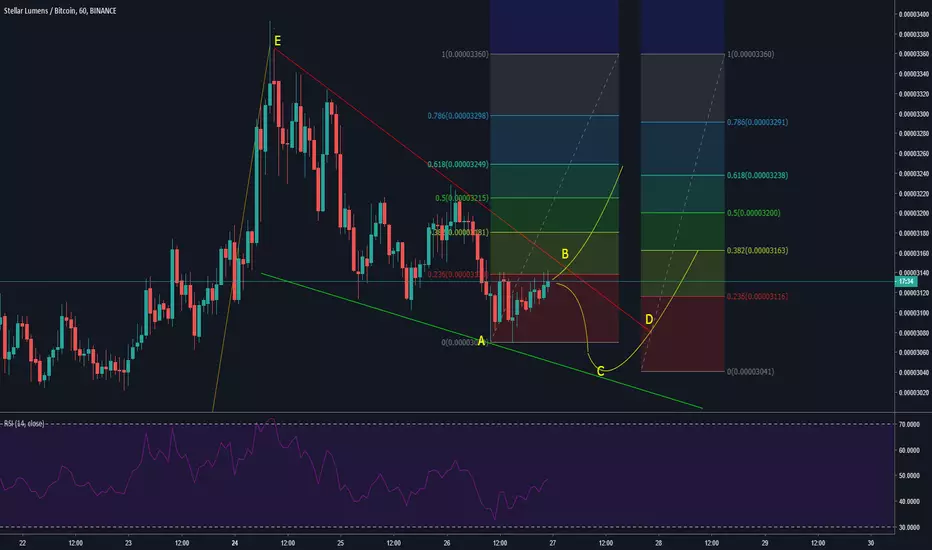
Falling wedge forming for XLM on BinanceFalling wedge forming on Stellar Lumens. A falling wedge is a reversal pattern and we should watch closely to see if the price can break through the upper trend line of resistance (red).
If the price breaks through near point B, then we take our Fibonacci retracement between EA (highest to lowest).
If the price breaks through nearer to point D, after another small movement down towards our lower trend line of support, then we take our Fibonacci retracement from point EC (highest to lowest).
In both cases, our entry point would be directly above the upper trend line (red), expecting a breakout upward. Then look for an exit at one of the Fibonacci levels to take profit. A good stop would be just below the lower trend line (green) in case it falls back into the wedge and continues to move downward.
XLM GOING MOON !!!XLM is seen from the graph he is very strong to ride and also the RSI supports strongly and the upcoming xlm news at the end of this month, Buy and Holdd for 20-50% profit
#YoungMillionaire
