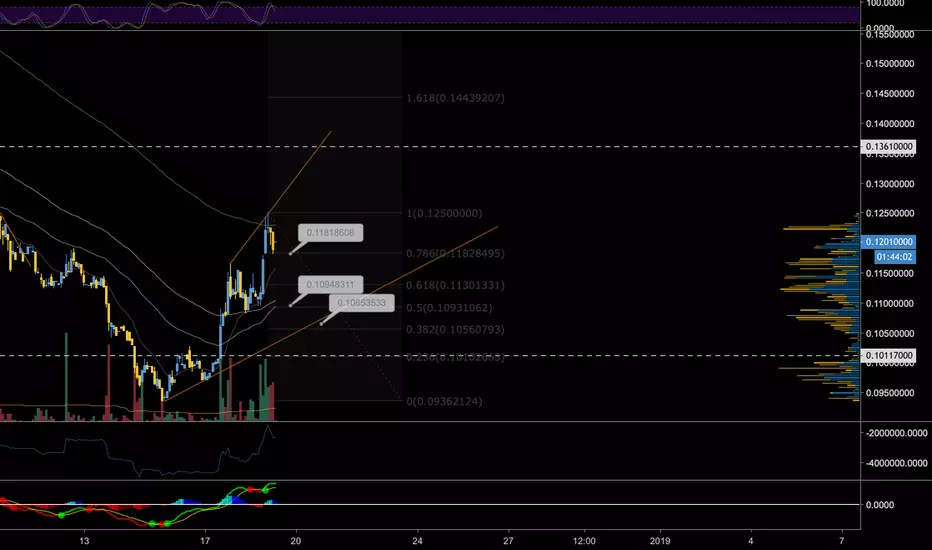
XLM Daily Analysis: $0.13 & The PossibilitiesXLM, the fourth largest Digital Asset has seen a 12% increase, before 2% being shaved off last night as it seeks to cool down before making the next step to $0.13.
What do the charts say?
Bullish
XLM cooled off to the 0.786 fibonacci at $0.118 before making another leg up by 0.45% - it appears that is where XLM will find temporary support before it bounces up to seek to break the $0.13 resistance.
On the lower time frames, the 15/55/90 MA's are set to cross-over the next few hours, that will provide it enough momentum to break past the temporary resistance.
Accumulation despite topping up during the past few hours, is slightly increasing up 2% on the day.
Market sentiment is slowly increasing; partly owing to anticipation of a Coinbase listing shortly.
Bearish
A close below $0.108 would represent a bearish cooling off period - especially over 48 hours.
Nouvive Says: XLM has found temporary support at $0.118 seeking to wait for both how BTC is able to find a definitive support and for the Moving averages to cross-over. It is more than likely we will see a $0.136 break during the course of the day.
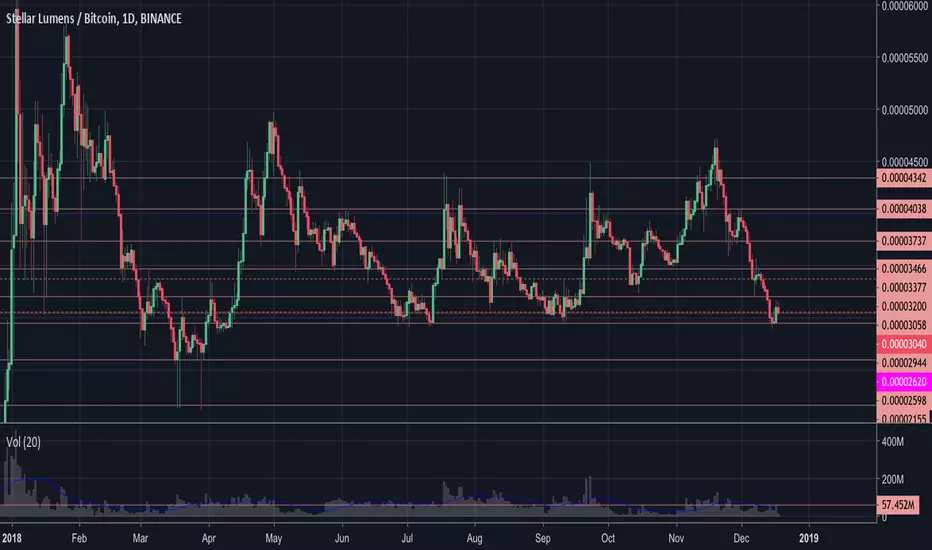
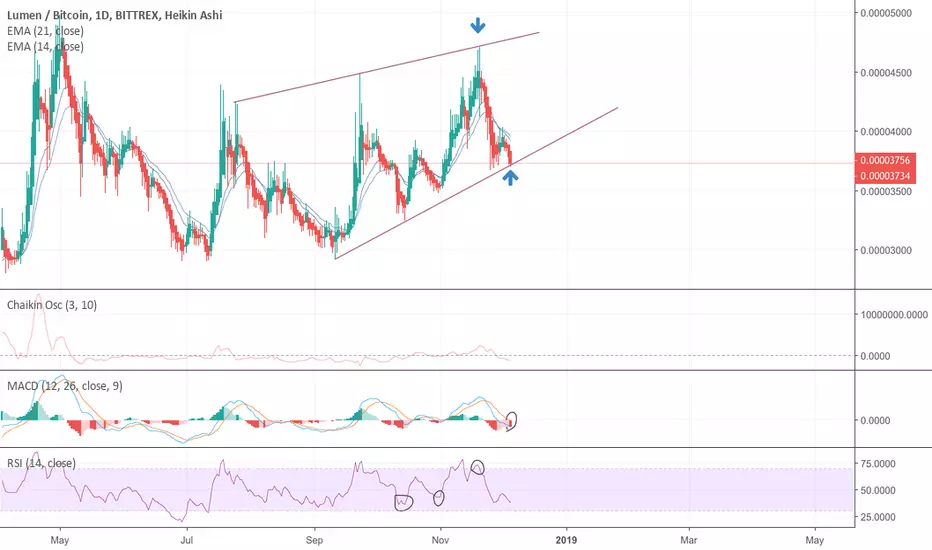
Stellarlumens
Is it falling or rising star? Analytics XLM/BTCSince December 16, the growth of the coin has been observed, but the overall review, in our opinion, does not give grounds for optimism. First, the price is in close proximity to a strong support level at 0.00002945. It reinforced by the rebound of the rate from it, almost the entire purchased volume of the coin has already been sold out. Despite the positive price trend, the sales prevail.
Secondly, the current fall, which began on November 20, is characterized by low, compared with previous recessions, the activity of buyers. It shows decline interest in the asset.
In addition, the current growth going with on average, or even lower volumes, which is not enough for a confident asset growth. Judging by the chart, the highest possible price at the moment is 0.00003377. After that, we expect a fall and a breakdown of the support level of 0.00002945. The next support is at 0.00002600, and probably it will be broken also. But in this area, you should observe the behavior of the price.
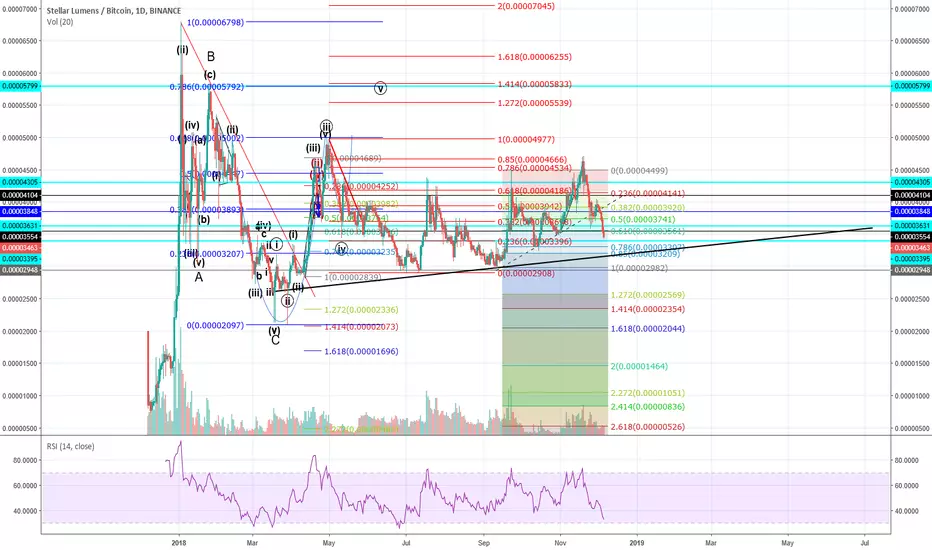
XLMOption 1 Bearish 1-5 Impulse: Bottom at 2910-3040, ABC correction to 3310-3520
Option 2 (not shown in this chart): ABC correction finished around 3300, now could start a new 1-5 Impulse to 4310-4470.
Option 1 is more likely to happen due the presence of Falling Wedge structure (shown in the chart) and two H&S patterns completed (not drawn).
Educational

Stellar (XLM) Recently Broke Its Previous LowStellar (XLM), which is currently the 4th largest cryptocurrency by market cap, recently broke its previous low and lost 7.25% over the last 24 hours. This is quite a big drop considering that most of the top 20 cryptos have slowed their descent and are forming support.
The recent break shows downtrend resumption and suggests that another leg of said downtrend has begun. Next support is located at 0.082, a price that was last reached in December 2017. However, before that mark can be touched, we will most likely see a bullish correction based on the oversold condition shown by the Relative Strength Index which is below its 30-mark. The overall bias remains negative.
Support zone: 0.082
Resistance zone: 0.11 (potential resistance; not confirmed at the moment) and the 2 EMAs
Most likely scenario: re-test of 0.11 from below, followed by sideways price action
Alternate scenario: possible move up based on the RSI oversold condition
XLM/USD scenariosStellar has grown 3,736.57% since it first started trading. Stellar had about 42.00% winning months of its total trading age of 52 months. The price of Stellar dropped as much as 26.00% in a single day on Tuesday, January 16th 2018. Stellar grew as much as 50.91% in a single day on Thursday, January 4th 2018. Stellar increased as much as 428.05% in a single month, in November 2017.
However, we are currently looking at a Stellar Lumens bullish confirmation. The outcome is likely to be one of the 2 following scenarios:
Scenario #1: A sideways movement between 0.17 and 1 USD. The longer the price evolves within this purple price channel, the more potential upside for Stellar’s price.
Scenario #2: Follow through that leads the price to 0.35 thus the upper side of the horizontal channel which will ultimately lead to the major breakout once the price crosses above 1 CAD.
Stellar (XLM): There are more than 1,900 crypto coins in the market today and each has a solution it is trying to solve. Surprisingly, none of these can claim monopoly in their jurisdiction but some have superior value propositions backed by a strong unique technology and Stellar Lumens (XLM) has so far impressed the investor as a global financial system.
Stellar (XLM) is rated the sixth largest and most valuable coin in the world. However, its success is based on its development progress for the last nine months. The bearish market has not deterred the platform from gaining more visibility and this has resulted to additional adoption. Here are 5 reasons why Stellar will dominate the financial sector in 2019 and beyond.
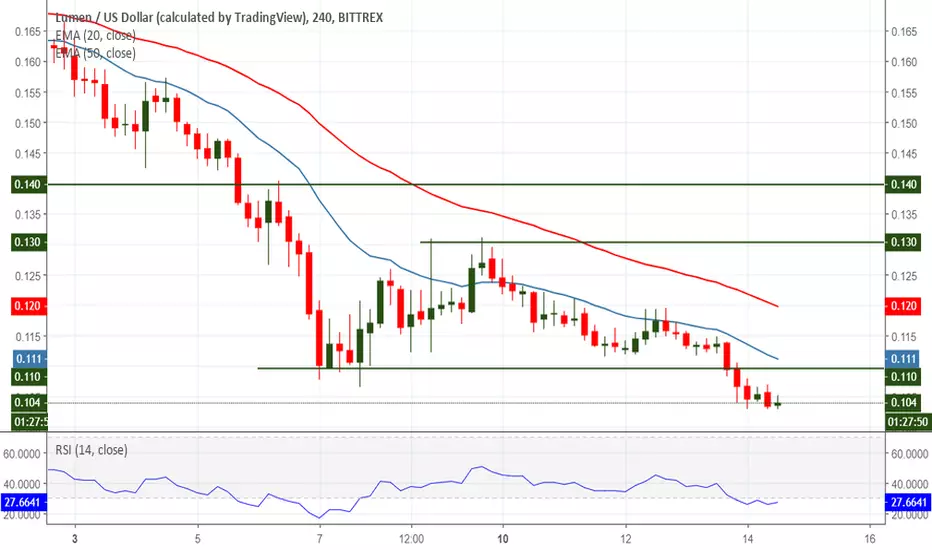
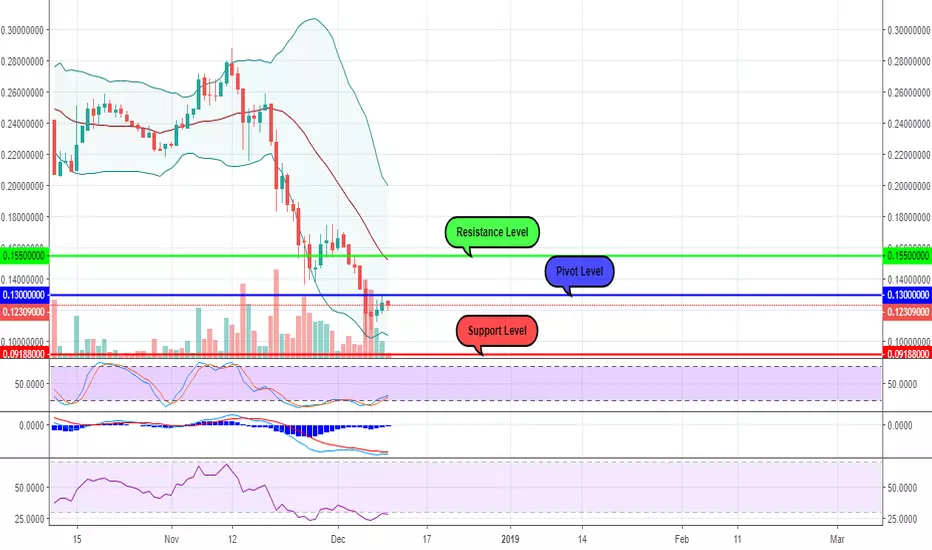
XLMUSD - 1D Chart AnalysisAs with other crypt coins, although we have seen a slight "correction" over the last few days, it seems that the bearish trend of Stellar which has started on the 19th of November is "here to stay".
This is due to the price which is still between the 20 days Moving Average and the lower standard deviation of Bollinger Bands and seems to have a considerable distance to recover until this indicator will show the opposite.
On the short term, we can observe some very low price fluctuations due to the decrease of the trading volumes and also of the technical indicators which are in contradiction as it follows:
- The Stochastic has registered a crossover on the 7th of December, indicating the slight increase which we could see in the days after, but another crossover that shows the opposite may be seen anytime soon.
- The RSI is 28 and is also indicating an "oversold" position which can be followed by another price increase but this scenario could be seen starting with the 4th of December and the price changes were not impressive;
- On the other hand, the MACD is still below the Signal and in line with this indicator, the price can go even lower.
At this point, it seems that we have two possible scenarios:
1.We will be able to see the MACD crossing the Signal, which would be considered as a confirmation of a possible short term uprend, supported as well by the RSI and the Stochastic. In this case, we can consider the "Buy" positions with a possible target price around 0.1550$ which is also the first Resistance Level.
2.If the MACD remains below the Signal , we may consider that the RSI and the Stochastic are indicating more a slow down of the price movemets rather than an increase and this period will be followed by another drop. For this scenario, we can consider $ 0.0918$ as possible target price, which is also the first Support Level.
Stellar thoughtsDear reader,
Thank you for your interest. So far I have been very successful in predicting XLM's movements since mid-2017.
(Please have a look at my "Lumeneer" Twitter feed's media forsome good past calls.)
I'm a strong supporter and believer in Stellar Lumens as a project however I think a break from downward trend is unlikely in the near future. I see XLM going as low as 0.07 - a pessimistic outlook for such a promising project.
I am very confident that long term XLM will break $1 so any "buy and forget" strategies will work but if you want to maximise the amount of Lumens you hold you may wish to provisionally set stop losses at expected resistance or indeed short & buy/long at expected support lines.
Another bounce off 0.15 - 0.18 likely and will be a good indication if we're going any deeper as a strong rally from there should fill future projections with an optimistic outlook. If not we have another support line before 0.07 which I see as bedrock - time will tell.
A shallow or failed rally from 0.15-0.18 will likely fall quickly & break support which will see us go further with an expected stop at 0.13 and well down the support lines we go until strong rejection...
As with all patterns and projections, the market is dynamic. We must adapt to moderate-strong deviation quickly and minimise losses. Any trader that losses small amounts has plenty of time to try again!
I have seen some comment about habitually losing out on trading with margin etc. If you are on a losing streak you have to acknowledge that you are doing something wrong. Step back, re-assess put your trades on paper, develop a good track record before commiting capital again.
Otherwise I wish you all good trading and many Lumens.
-Geek
STELLAR LUMENS / SHORT OPPORTUNITY / H1XLMBTC
Trading Bias: Short
Technical Strategy: Harmonic Bat
**FULL DISCLOSURE. I AM NOT TAKING THIS TRADE**
The only crypto I will trade is Bitcoin/Eth/Ripple
I happened upon this chart by request of a TradingView user and made analysis for them.
--> Wait for price to reach the D point / Sell Zone. Once in the Sell Zone shorts may be taken. If you need help with what a trade trigger looks like, watch my video on trade triggers <--

XLMBTC - HARD FORK - 9TH DECEMBERBuy Price: Green Zone
SL: Red Line
Profit: Blue Lines
Invest Suggestion: 20 Percent
Profit Expectations: 10 - 30 Percent
Looking at the chart of XLM, we could see all indicators pointing to sell it! But we have a hard fork on this coin on 9th December( this might causa a reversal tendency)!
Also, RSI is oversold!
Guys and Girls, this is a risky trade due to the majority of indicators point sell and due to BTC crashing, so, if hit the SL, SELL IT!
Sell when you get some profit, according the way you trade.
Keep following us and please like this idea.
Any doubts? Send in the comments or in our telegram or Inbox here.
Thanks for visiting.

XLM/BTC will the 0.786 Fibo level stop the price? As you can see, I've been following XLM for the long time.
XLM has broken its local trend support line, and now is going down with no retracement.
But down there are several strong supports:
1) 0.85-0.786 Fibo zone
2) Trendline Support
3) Strong support line on 0.00003300 BTC
4) RSI is on its lowest value since Jun.30 , 2018
Signal: Place your orders equally on the mentioned levels.
Additionally: Very Good Fundamental!!!
Watch Out For XLM!Stellar will always be one of my favorite coins, but right now, it's on the verge of breaking down. Watch this 3500-3600 area. If we go below, there are some fairly low targets, especially in USD value. XLM has made it to the top 4, which is promising, but it's starting to lose some steam. We really need to see a bounce now in order to continue the bullish trend against Bitcoin. I hold a fairly large position in this coin, so it would be unfortunate to see it drop further, but it's a very real possibility.
We have a potential long opportunity here with a buy in point between 3500 and 3600 for XLMBTC, with targets upwards for 4000. However, a stop loss is recommended, as we can get a pretty severe breakdown (look what happened with EOS recently, for instance). I'd set a stop below 3500, depending on your risk tolerance.
As you can see, on the XLMUSD chart, we are right at a yearly support zone. If this breaks, we have support in the green zones. Resistance is around 18 cents, and we have recently failed to get back above it, which is pretty bearish.
However, a bullish case can be made if this bullish divergence plays out on both the USD and BTC charts:
Resistance:
3900
4000
4500
4700
5000
Support Levels to Watch:
3540
3500
3300
3000
2900
2100
1800
1300
This is not financial advice. This is for educational purposes only.
Previous XLM chart:

AS much as it hurts to say, XLM still has room to fallHi again, I really didn't expect such a dramatic fall in BTC recently so my prediction of buying XLM at 0.195 ended up being wrong For that I apologise.
What I expect from here is BTC to fall a little further over the coming days and weeks and with it the rest of the cryptosphere. 0.08c is a strong support for Stellar but not a lot in between unfortunately. Ideally I would be looking to buy a little at these targets
T1: 0.135
T2: 0.12
T3: 0.8
Remember, a bottom can only be called many weeks or months after the fact. Don't believe anyone who says this is 'definitely' the bottom.
This is not trading advice just an example of how I will trade this mother. Have fun and be careful out there.

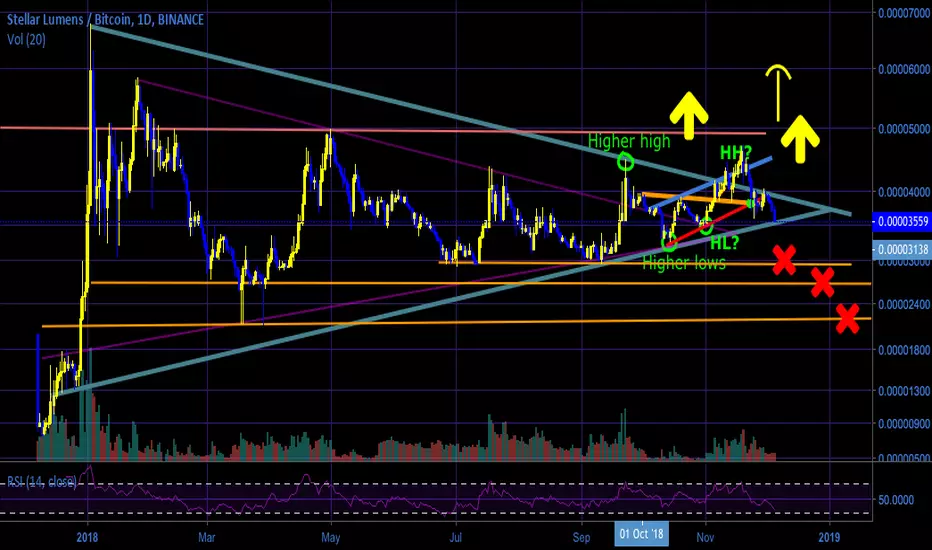
XLM - Exploding in DecemberStellar (XLM/BTC) is looking incredible right now for the month of December due to both TA and FA. Let's start with the TA first.
Technical Analysis (1D Timeframe):
XLM/BTC has been holding a rising channel since September and looks like it is starting to bounce off of support at 3,600ish sats. Not only that, but RSI has reversed direction and there is a lot more buying momentum than sell-offs, even during these major market crashes. MACD is curling up and looking like it will have a golden cross, pushing some bullish moves within the next few days. Oscillators look like they are going to flip from negative to positive.
Fundamental Analysis:
There are two major projects set to release by 2019, meaning next month. The first is SDEX, a Stellar Decentralized Exchange which claims to offer some of the lowest fees out of its competitors. We saw what happened to BNB as Binance became popular. If this exchange picks up it has the potential to explode. Additionally, Stellar is testing their lightning network in a few days and plan a release in the next few months. This update is said to dramatically increase their scalability and usability.
Two big events coming within the next 30 days and technical indicators looking bullish within the next week. This is a GREAT opportunity that you shouldn't miss on.
My plans for getting into XLM/BTC are as follows:
Entry: 3,600-3,800 sats (some at 3,800 - more at 3,550ish)
Stop Loss: 3,500 sats
Target 1 (Short term): 4,100 sats
Target 2 (Long term): 4,800 sats


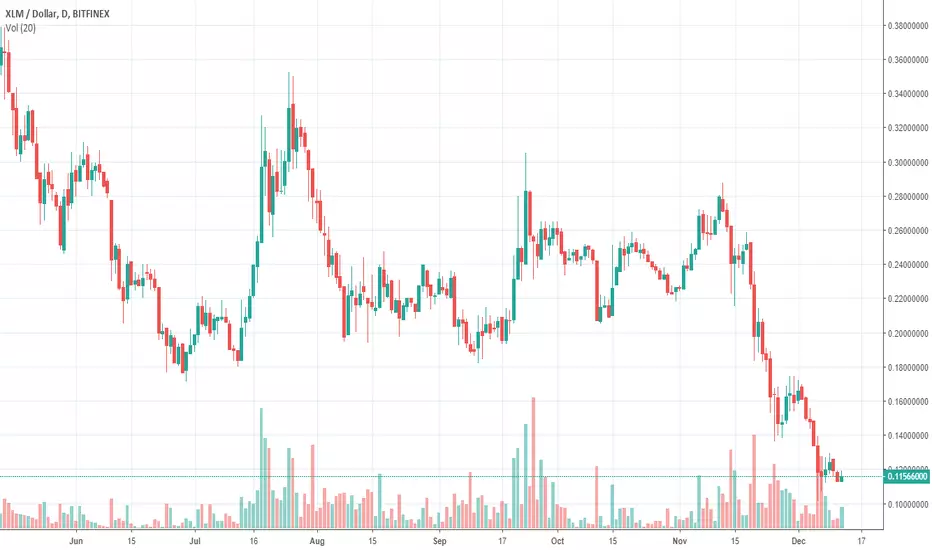
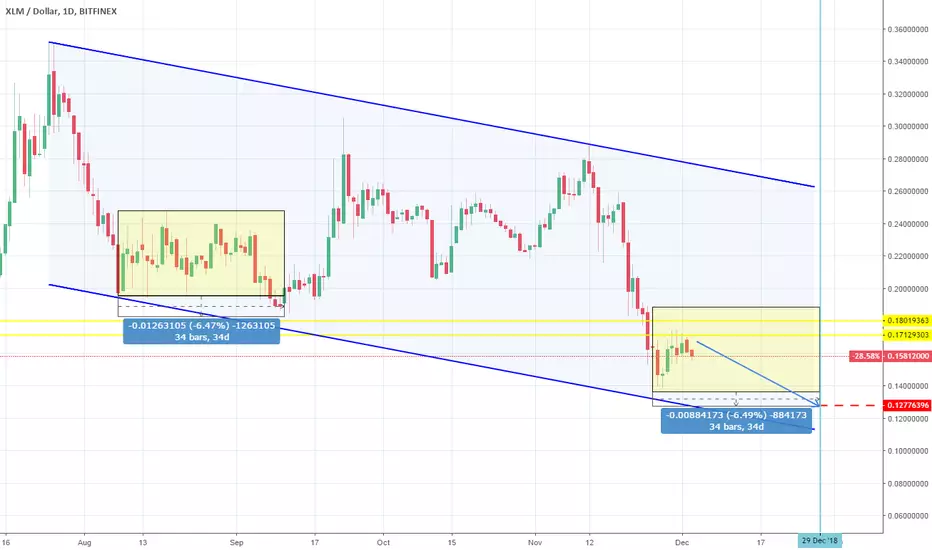
XLMUSD: Long term sell targets accomplished. Consolidation aheadBoth TP = 0.1802 and 0.1713 (July, June lows) got hit following the late November collapse of the whole market. As with most coins, the achievement of the last short targets marks the end of our shorting strategy on XLMUSD as we believe that the market is near a long term bottom zone. Traders who wish to keep trading Stellar Lumens can consult the 1W chart which is now a Channel Down (RSI = 40.059, MACD = -0.029, Highs/Lows = -0.0439) indicating that there may be a recurring pattern sequence within the Channel. This shows a 34 day consolidation at the end of which another -6.50% drop potential to 0.1277. We are personally waiting for a bottom to be formed before engaging again.
** If you like our free content follow our profile (tradingview.sweetlogin.com) to get more daily ideas. **
Comments and likes are greatly appreciated.
XLM: Stellar Next Wave 30% !!XLM on the Channel Bottom if you are trade XLM then you can pick around 3600-3700 Set StopLoss 3400 and Target 4500.
Let See What Will be Next Move ..
I hope that Next Wave will be Move to our Target.
if you are doing Trade XLM then ,
you can also Set Stop Loss own RR Ratio.
Warning- I m Not a Financial Advisor this idea Only For Educational Purpose Only.
Thank You !!

Stellar Another Weak WeekThere is not much to say about crypto this week. It looks to be another continuation down. Well, let's get to it.
On the weekly chart, stellar is in a freefall as with the majority of the cryptoworld. If we look at the chart, we see that stellar has broken below the blue dash line which was acting a major support line. Now that it is broken, I can only assume the worst case scenario and that would be that stellar will fall to the next major support at 0.01usd mark. So why am I saying this? It's because from here on, there is no support and the closet thing to a support is around the 0.04usd mark on the weekly chart. If we look at the monthly chart, there will be support at the 0.02usd and 0.01usd.
Stellar has an excellent project going on. It will be an excellent investment in the future as well. We have to come to understand that all the markets is in a bear market. It is not just crypto. With that said, keep your money safe. Look to invest in great projects and accumulate on the dips :) Happy hunting.
Remember this is not a signal to trade. DYOR.

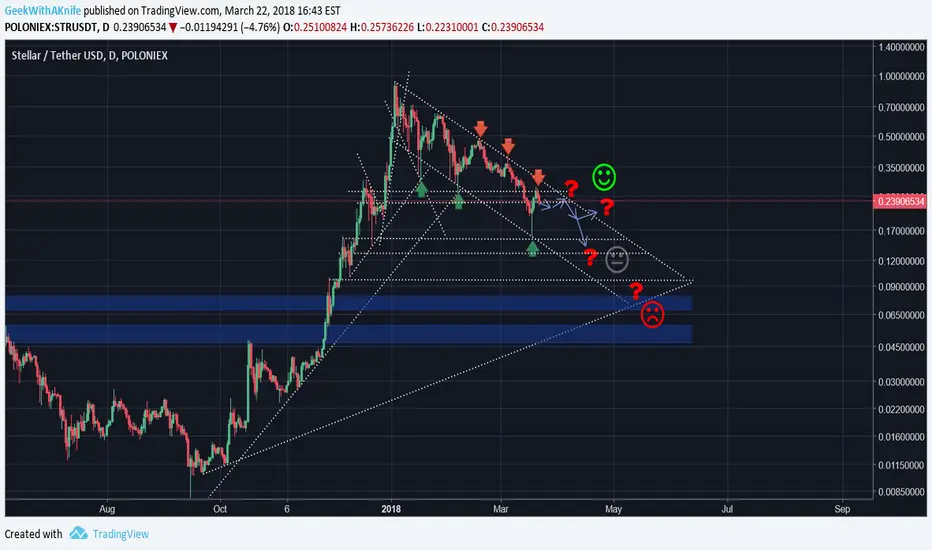
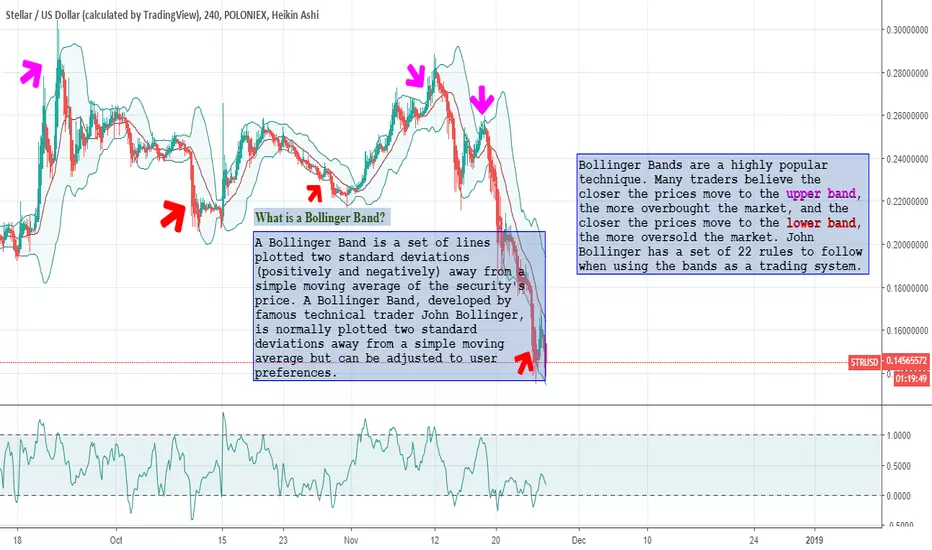
Bollinger Bands for DummiesA quick look at bollinger bands on the STRUSD chart (Stellar on Poloniex).
Hope you find this helpful.
Lets discuss cryptocurrency and how I win against it.In becoming a trader their is so many different methods to trading to learn and to try. Without someone to show us the right way we are usually destined for failure from the start. I have probably spent way to much time trying out how to find out what works the best and what doesn't work at all. You name a strategy and i have probably learned and tried it out. I got really obsessed with indicators because I saw the potential they could have in helping us make smart buy and sell assisted decisions. I believe that the "Higher Ups" will control the market and shift it when they choose to shift it. We as retail investors can only do so much while trying not to jump to far ahead of ourselves.
I see so many people on here make crazy predictions drawing imaginary lines and telling the masses what price will be a good buy and to sell. Most of the time they are wrong and love to play the guessing game while acting like hotshots trying to call the next big play. I see this happen with accounts that have huge followings and honestly it's really sad.
We are all entitled to our own opinions and doing our own TA but what if their was a way to eliminate all of the guess work?
What if trading didn't have to be so complicated?
What if you could wake up turn on the chart and know if you need to buy or sell in the matter of 5 minutes without all the complicated time consuming TA?
I started off as a daytrader and honestly it hurt me more than it showered me with rewards.
I was stressed, irritated, greedy, impatient and i felt like quitting.
It was a constant battle with the charts and i could understand why being a trader is one of the hardest jobs in the world.
But,
I never gave up.
I had to learn to step away and approach the markets with a new approach.
If you can control being patient and not being greedy I am here to tell you that YOU CAN BEAT THE MARKET!!!
Everybody comes into this seeing so much opportunity on the small time frames and they put the large time frames to the side.
When i say large i mean the weekly, 15day, monthly.
And..
That is because most people are impatient and greedy and want to capture every move. Everybody wants to get rich overnight and treat it as a get rich quick scheme.
I'm sorry to say it but only a very small select few can beat the markets daytrading... VERY FEW.
Otherwise most daytraders blow their accounts and never return.
I look at daytrading as gambling
and
Swing trading as investing.
With the bigger moves it will take more time but think of your funds to have more security and more opportunity to make you money over time.
This has worked SO MUCH BETTER for me since i quit daytrading.
The charts run smoother, cuts out most noise, easy to spot buys and sell... way less stress.
If you can overcome your emotions and learn how to be patient and not greedy you have already won half of the battle.
Now all you have to do is 1 more thing, use my 1 indicator that I use.
Buy Green
Sell Red
//
it's mainly for swing trading, i use the 3 day / 15 day / monthly charts with it and it works perfectly,
//
it works good for stocks and cryptocurrency.
//
you will use heiken ashi chart style and turn on the EMA DOTS indicator.
once the indicator is on you will hide the heiken ashi so you only see the dots.
//
when a green dot -0.90% appears you buy, if a green dot -0.90% appears after that green dot -0.90% you hold your investment.
if a red dot appears you sell your position. easy as that.
//
the standard dots setting will be set to 10 - use this for any chart above 3 days
change the dots setting to 6 for 3day charts and below
//
shorter time frames will be choppy.
//
larger time frames will be smooth.
//
*Daytrading smaller timeframes is possible but not recommended.
Your emotions is 50% the other 50% is this 1 indicator.
I quit all of my other strategies that i use to use and now i only use this 1 tool.
And...
when we apply this to the timeframes, the bigger timeframes. We will get the right signals when to buy and when to sell in the markets.
We are buying and selling off the probability of the dots.
My main method is to wait for a green dot -0.90% on the 15day confirmation to help identify a bull market. if i get the 15day green than i can enter for example a 3day chart and scalp the bull market till i get a red dot printed on the 15day.
Message me if you would like more info on this indicator or more details on ways to use it. I am all ears and here to help you out. Take care. Happy trading.
-InJayWeTrust

XLM Huge Pennant UpdateXLM doing very well so far after it's breakout of the pennant formation, i expect the bullish momentum to continue, the fibonacci fan can be used for selling targets if we see a huge rally as a consequence of the breakout.
In the short term, the 4000 satoshi level should act as a good support for accumulation, but it is possible that we may see a correction down to the 3500 levels if the market conditions worsen.
The target is pretty speculative, i dont expect the price to head straight there but I beleive it is very possible.
Biffy
Check out my open scripts here: tradingview.sweetlogin.com
Feedback and collaoration is welcome!
XLM : STELLAR Head & Shoulder Pattern Trade Carefully !!XLM Are Trying to Make Head & Shoulder Pattern if NeckLine Breakout then We can See Trend Reversal Bullish to Bearish Trend Because Head & Shoulder is a Trend Reversal pattern, So Trade Care Fully.
if You Satisfied Then Dont Forgot To Hit Like.
Warning- I m Not a Financial Advisor this idea Only For Educational Purpose Only.
Thank You !!
