Stellarlumens
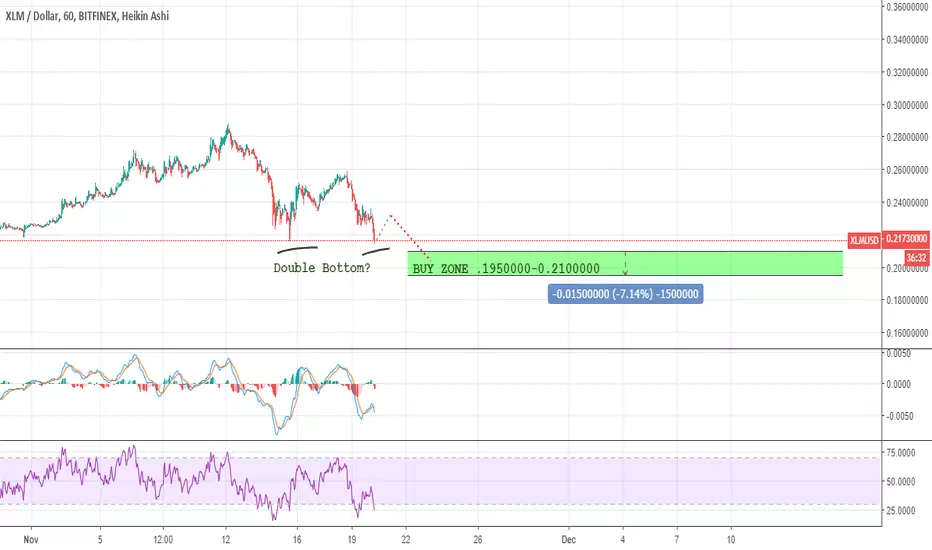
XLMUSD, My buy area is from .195-.210As I've mentioned in my last TA, my buy area is in the .20-.21. I actually already have buys set at .195 in case they are triggered but I'm not sure if we'll dip below .20.
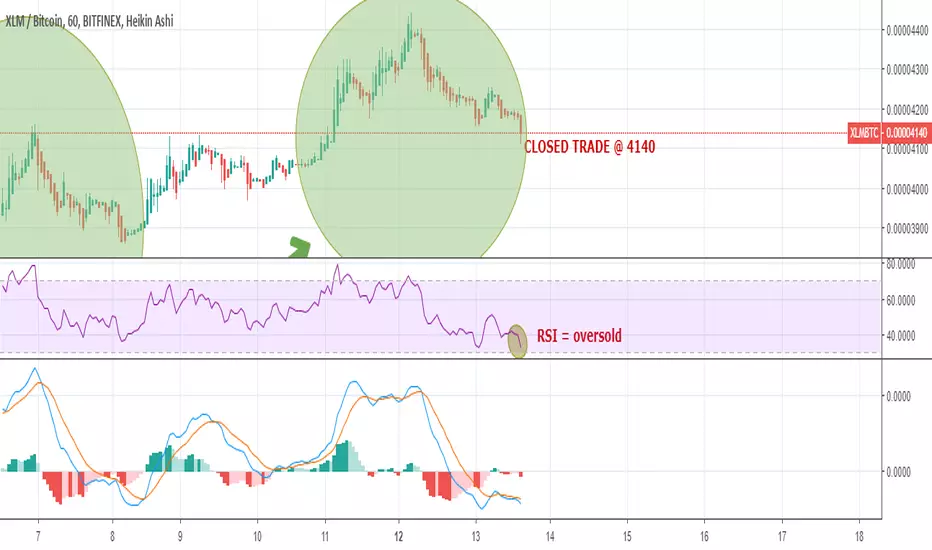
RSI is oversold on the hourly. BTC continues to fall which is bringing the XLM price down with it. A strong performance by Stellar means that XLMBTC continues to impress although there has been a selloff at 4700.
If you have your money in fiat I would watch this space closely.
As always this is what I will be doing personally but it's not trading advice. Have fun out there.
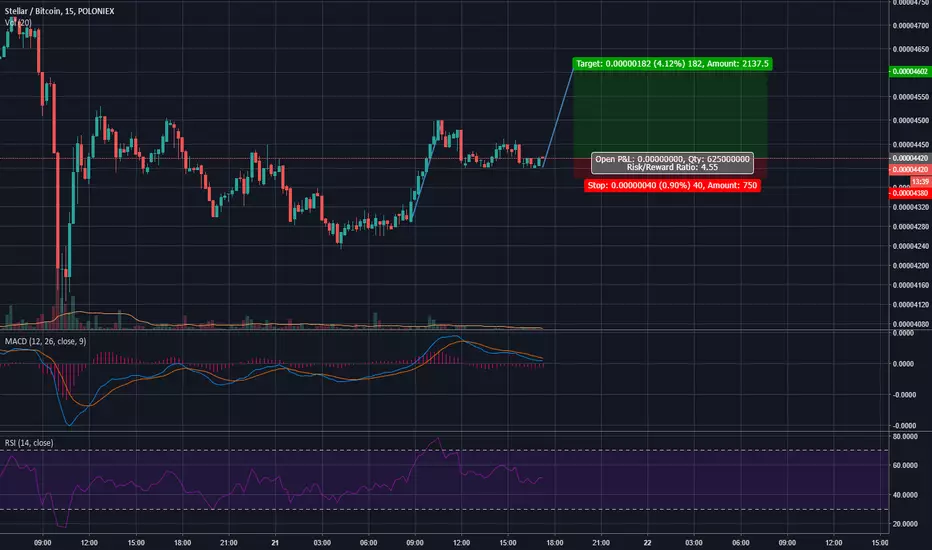
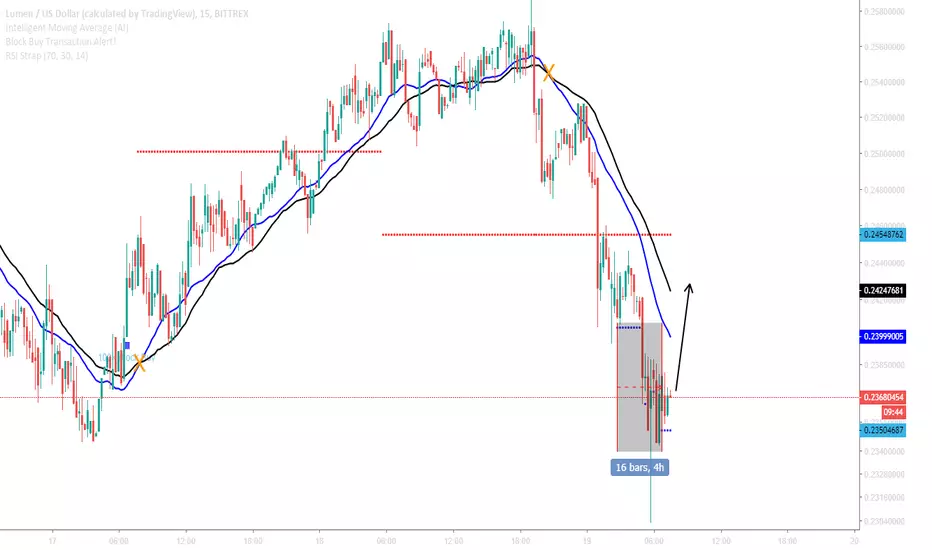
Stellar Lumens Long OpportunityA strictly basic technical viewpoint indicates that digital currency XLM is oversold against the dollar and trading at a great value.
While the Intelligent Moving Average (AI) has not yet crossed or indicated any change in momentum, I am anticipated a change in price that would lead these moving averaging to a cross.
The RSI strap is indicating extreme oversold conditions as it has dipped extremely low into the oversold territory within the last four hours.
This trade will take a very short period of time as the candle-sticks represent 15 minutes each. For this reason, this trade is suitable for a technical scalper who incurs relatively low trading fees.
This trade may provide an opportunity to hold a safe position as it continues for an extended rally.
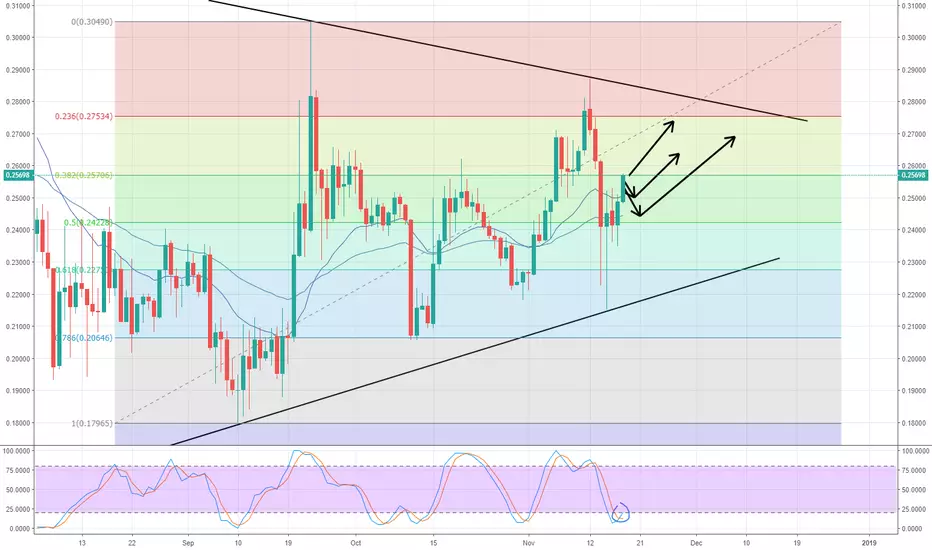
Idea on XLM/USDTBased on the daily chart, Stochastic RSI is on oversold area, which could potentially reverse on these 2-3 days.
Also, we see that there is a bullish divergence on the Stochastic RSI (daily chart)
On the 4hr chart however, the Stochastic RSI is in a overbought area, which probably would stop the rise of XLM/USDT for a while. and continuing its upward momentum.
There are 3 scenarios that would probably take place.
1. it breaks the 0.382 fib level and go upwards.
2. reverse on the 0.382 fib level, bounce of the 20 EMA, and break the 0.382 fib level.
3. go down to the 50 EMA and 0.5 fib level, and reverse to break the 0.382 fib level.
On the fundamentals side, it is rumoured that XLM will conduct airdrop, giving the current XLM holders XLA (Stellar Activity) with the ratio of 1:2
The momentum/sentiment towards Stellar Lumens (XLM) have been so positive.
Disclaimer: this is not a financial/trading advice.
Good luck to you all!
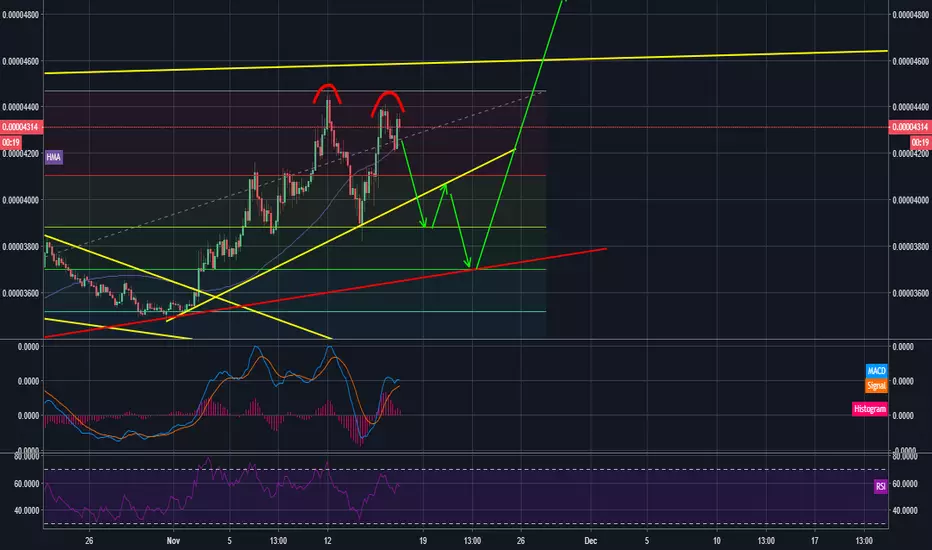
My short term prediction on XLMIf the marketcap keeps going lower and bitcoin stays where it is or also goes lower, i dont see a reason why people wouldn't like to get profits on 4300-4400 that's been tested so many times. I am really bullish in the long term but I have some doubts at the moment. Cheers.
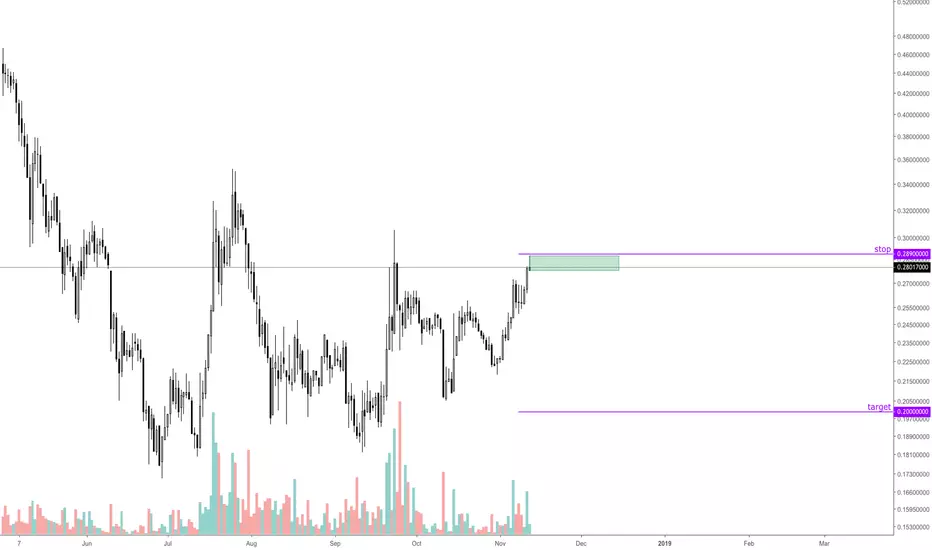
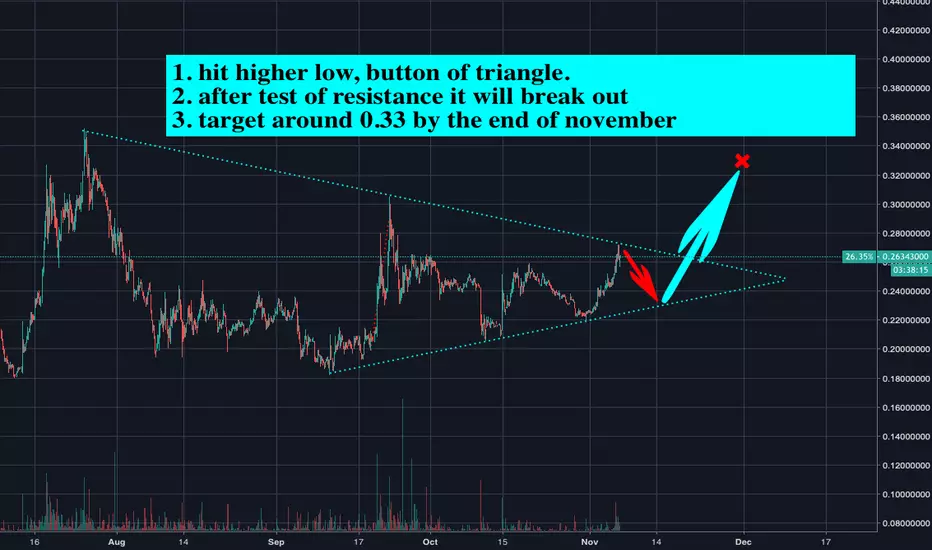
XLM/USD Trading Target BREAK OUT Text / targets inside the graph
Let me know what you think about the price, drop your ideas and suggestions below in the comments
XLM/BTC - Trading bearish divergence and shooting starHello everyone,
Hope you made some money on XLM's flight to glory during a time when the whole market is bleeding. Looking at the daily chart, we can see a bearish divergence between price making HH and RSI making a LH. Couple with that, we see a typical shooting star that has yet to be fully formed during the remaining hours for the candle. I will be taking a risk here by going short on XLM and placing a stop loss above the shooting star's top.
Take profit around the support zone or the red uptrend line and see if we bounce from there or go further down depending on market conditions.
Thanks!

Will XLM lead the market to a bull run !? stellar seems to be inside ascending triangle on the daily.
patience is key this can take a few weeks until it breaks up.
Wil stellar be the next catalist to a bull run ?
XLMBTC has been one of the strongest altcoins this year and i believe XLM is going to show the market how to start the BULL run.
if you found this usefull press the like button and share it
thankyou

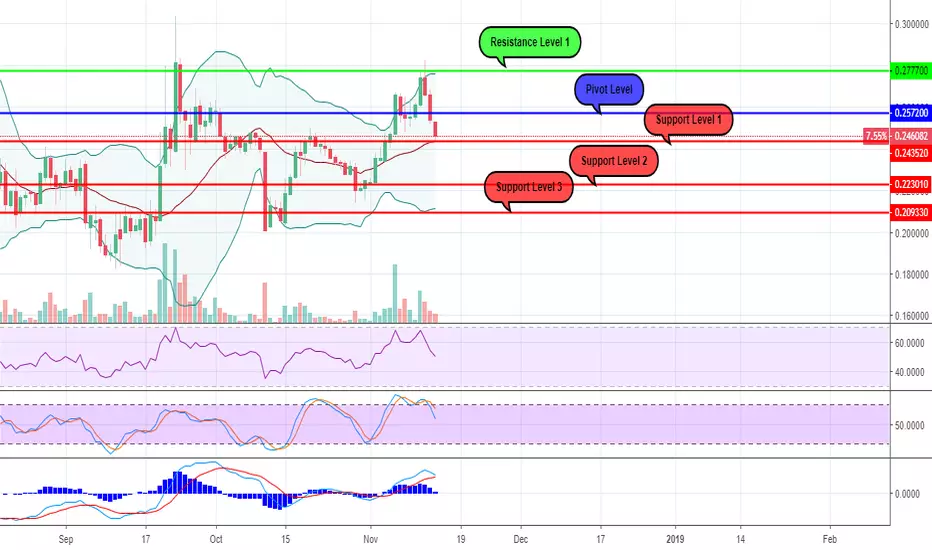
XLMUSD - 1D Chart AnalysisAfter the Bullish trend which started on the 2nd of November, it seems that we have a crossroads again, as long as we are about to register the 3rd consecutive day of decreasing and the price is now "testing" the 20 days Moving Average which has the same value as the Support Level 1 of 0.2435$
For the ones who will consider a higher level of risk, the basic reading of the RSI and the Stochastic (which are returning from their "overbought' positions") together with the trading volumes which are decreasing, can be enough for opening a Sell position looking for jumping the gun.
At this stage the risk comes from the possible "bounce back" of the price from the support level of 0.2435$ and it's "survival" between the 20 days Moving Average and the upper standard deviation of the Bollinger Bands, scenario in which the Sell position mentioned before will represent a loss.
But for the ones who prefer to wait for the downtrend to be confirmed, they can open the "Sell" position once (if) the price will go through the support level and also if the MACD's crossover will indicate the same direction.
For now, it seems we have only 2 possible scenarios :
* If the price will continue the decrease, we can consider 0.2230$ as a possible next "Stop".
* If the price will not break the support level, there are big chances to assist to the bullish trend continuation, situation in which we can consider 0.2770 as a target price in the following future.
XLMUSD: Ascending Triangle on 1D.XLMUSD has been one of the strongest performers of the past 2 months. Proof of that are the Higher Lows printed on 1D since Sept 11, that have created an Ascending Triangle (RSI = 55.984, MACD = 0.007, Highs/Lows = 0.000) with 0.3053 as its Resistance. If the price rebounds on a new Higher Low near 0.2325, then it will most likely test the 0.3053 Resistance. Otherwise it may test the 0.18020 Low again. Note that this is a medium/ short term pattern. In order for XLM to restore a longer term buying sentiment, the 0.3523 Lower High on 1W needs to break.
** If you like our free content follow our profile (tradingview.sweetlogin.com) to get more daily ideas. **
Comments and likes are greatly appreciated.

For anyone shorting XLM now, be carefulI have closed my previous trade
at 4140. RSI on the hourly plus a look at previous consolodation period was my reasoning behind this. If you continue to short XLM it may make sense but I am just making this update to show what I am doing. Do you agree or disagree? Let me know
Have fun trading out there and be careful.
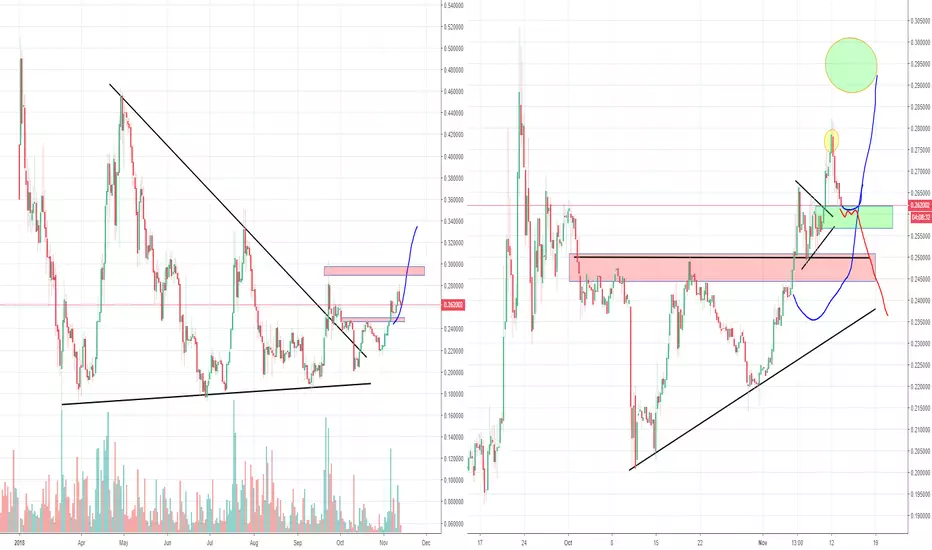
Stellar XLM inverse H&S, Part 4 TriangleSo we overreached the first target slightly and since dropped just as fast again, but we are still above a support level. No we do NOT want to see that green support get broken because that could trigger more selling pressure. If some were wise enough to take some profit at the yellow circle and still believe in the bullish version, this would be the spot to add again. Make sure you have your game plan ready (stops and targets). I am waiting though with adding because Bitcoin' is still in a very dangerous spot at the moment. Above 6350ish would be much safer level.
Whatever happens, we have to stay above the red zone, that is a key level. So there are two stop levels to use now, the green box or the first entry zone at the red box.
Read my previous analysis to understand the whole game plan better. Always keep track of my Bitcoin' analysis because i update there much more about the market conditions. Sometimes giving warning signals or bullish signals.
Please don't forget to like if you appreciate this :)
Previous analysis:
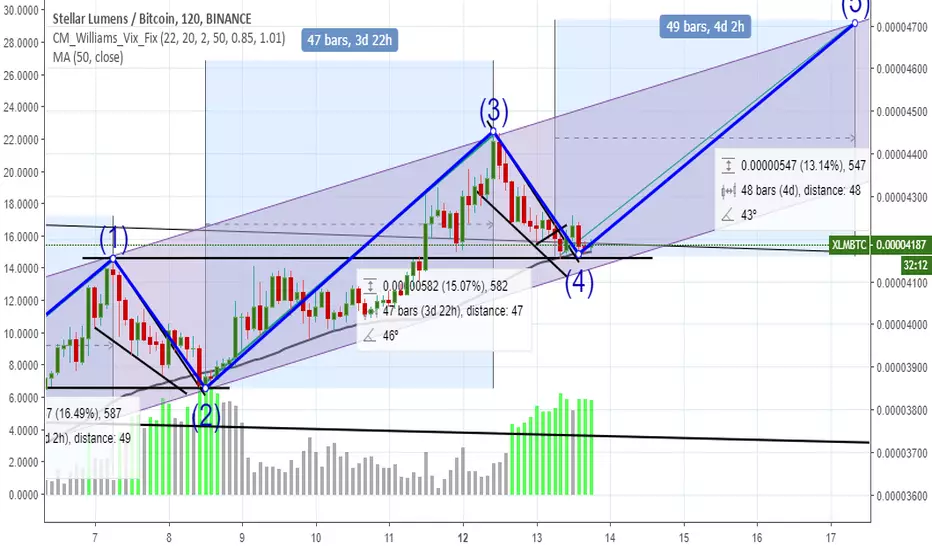
Stellar Lumens / XLM Ascending Channel (Bullish)BINANCE:XLMBTC
Technical Analysis
Ascending Channel - Bullish / Upward Trend
CM Williams VixFix Indicator - Predicting a Bottom
Price is in 50 MA Support / Price on support in Ascending Channel
Elliot Wave Theory (Looking for Wave 5)
Fundamental Analysis
Strong Sentiment being added first on Coinbase.
#Coinbase
#Stellar
#StellarLumens
$XLM
Factors affecting Stellar (XLM/USD) priceThe news
There are many interesting news surrounding the Stellar, that in combination, should affect the price. It is just the matter of interpretation, and understanding the market reaction to all that is happening. Let's get into it and see what is really going on.
1. Recently, Coinbase has accounted the listing of several coins. Which are ADA, BAT, ZEC, 0X and Stellar.
2. Stellar Development Foundation is getting ready for the biggest airdrop in the history of cryptocurrency. The amount to be released for the airdrop is simply huge to say the least, in total $125 will be given away. It emphasizes marketing intentions of Stellar, which are likely to show positive result by the end of this or beginning of next year.
3. On the 28 September 2018, Stellar has launched the zero-fee cryptocurrency exchange StellarX, which was announced by StellarX co-founder Christian in his Medium post. We talked about these news here: ()
Market reaction
Analyzing above mentioned news, they all are very positive in nature, although market takes time to digest and really understand as to what is happening behind the scenes. Nonetheless, Stellar already showing a steady rise since the beginning of the month. Market reaction is clearly positive, but the question is whether this tendency will continue?
Resistance holding
Technically, price has been trading within the triangle pattern. Although, in November, XLM/USD has increased by 33%, it failed to break above the $0.29 resistance. It's the level that many investors are watching right now as it could be the trigger for the upside breakout. Why this level is so important? - Not only this is where downtrend trendline has been rejected, less than a month ago, Stellar already bounced off the very same level (38.2% Fibonacci). And finally, the RSI is in overbought condition, trading within the triangle pattern and rejecting the downtrend trendline.
Ongoing consolidation
All-in-all, there is not enough bull strength at the moment to break higher, and XSM remains in a consolidation phase. While the resistance is holding, range trading between $0.29 resistance and $0.22 support will continue.
Breakout probability
However, considering all the positive news around Stellar lately, the probability of the upside breakout remains higher. The $0.3 psychological resistance could be the number to watch this month. Break above could invite buyers and/or trigger the buy limit orders, thus pumping the price as high as $0.4 - next key physiological resistance.
Downside risk remains
On a downside, range trading is still ongoing. As long as resistance is holding, it is reasonable to expect price drop, either to the 200 Moving Average or down to the $0.24 or even $0.2 psychological support (88.6% Fibs).
Important levels to watch
Support: $0.238, $0.227, $0.207, $0.194, $0.174
Resistance: $0.289, $0.318, $0.353, $0.400

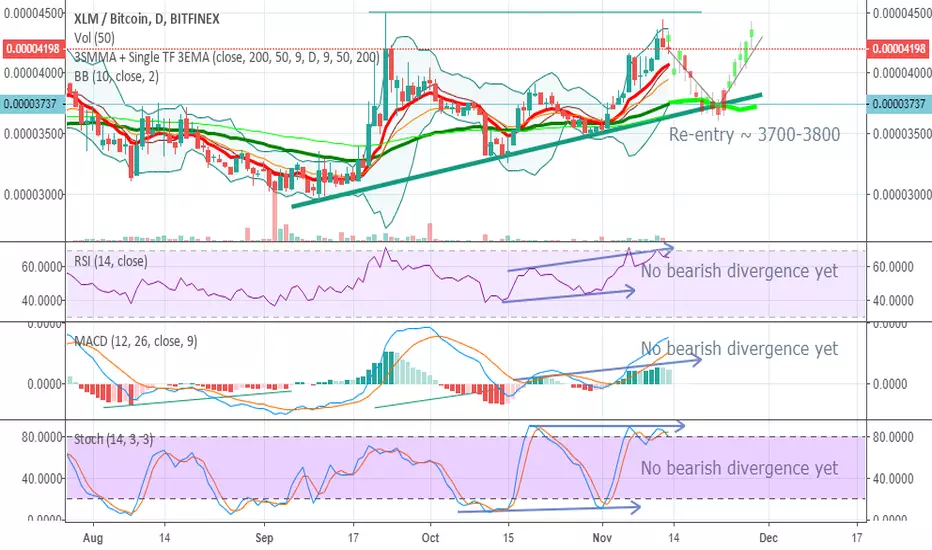
XLMBTC Stellar Lumens point of Re-EntryLast post about XLMBTC:
Disclaimer:
Sold half at 4193, another half at 4336
Now it becomes quite clear that it enters into another downward cycle after the boost
(MACD DIFF downtrend, %K %D reversal, RSI falls after peak)
(Of course it could go up again but seems less likely)
And we will have to find the next re-entry point, as XLMBTC is still bullish to me:
1. 9EMA holding above and supported by 50EMA for quite awhile
2. RSI / MADD / KDJ still no bearish divergence shown
To predict the next re-entry point, we try to intersect:
1. The trendline (troughs)
2. The 50EMA
Where we get somewhere between 0.000037 and 0.000038.
Please like and follow if you find this useful!
Stellar Lumen (XLMUSD) short.Targets and stops on the chart.
Don't forget to like and follow.
Thank you.