Stellar XLM Bearish SentimentFriday the S&P reached its 52 week low, $3636. There is a strong correlation between the S&P and the crypto world. Many stock investors diversified their portfolio into cryptos, especially in BTC Bitcoin and ETH Ethereum .
With a bearish stock market in the worst month for stocks and cryptos, i expect most of the cryptocurrencies to trade lower this week.
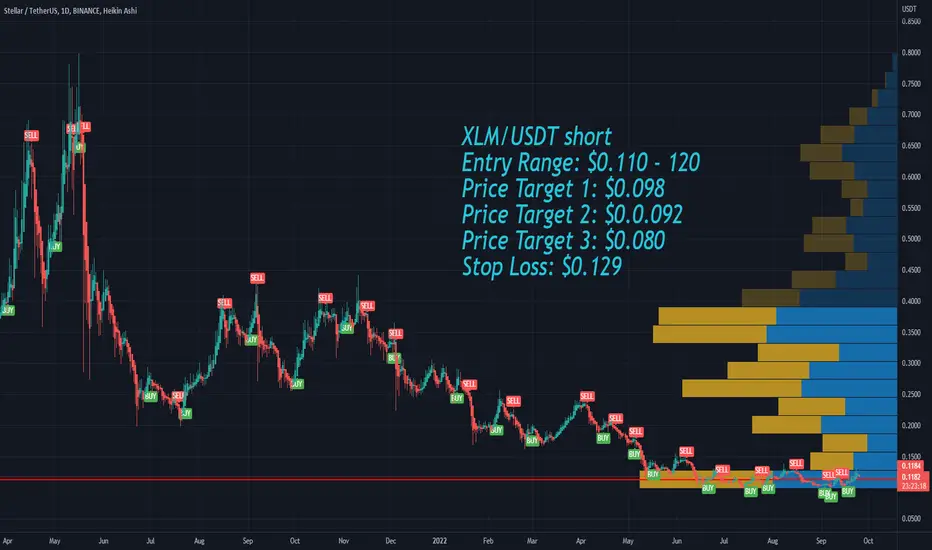
XLM/USDT short
Entry Range: $0.110 - 120
Price Target 1: $0.098
Price Target 2: $0.0.092
Price Target 3: $0.080
Stop Loss: $0.129
Stellarlumens
Stellar XLM Impending Breakout!XLM is one of those assets that has just been beaten down again and again with no real push off of the lows. It's becoming too good of an opportunity for price appreciation and I believe it's primed for a breakout. Beyond some of the technicals I'm showing here there are also numerous fundamental reasons I think Stellar is overdue for some price appreciation.
A close above the 100 day MA would be bullish and likely cause a push up to .12 a close below will likely result in another visit back down into the .10 range. Regardless it's either up soon for XLM or off to new lows. A break and close above .12 on the daily would likely take XLM up to .15 then .17

XLMUSDT 1D The global growth goal is $0.5 per XLMThe XLMUSDT price behaves almost as nicely as the price of "colleagues in the shop" - XRPUSDT
The XLMUSD price is approaching the critical level of $0.12.
Breaking this level up and fixing it above means the official start of a new growth trend.
If Stellar buyers fail to break through the price of $0.12, and the cryptocurrency market continues to be negative, the $0.075 level for buying XLM will be quite relevant
_______________________________
Since 2016 , we have been analyzing and trading the cryptocurrency market.
We transform our knowledge, trading moods and experience into ideas. Each "like under the idea" boosts the level of our happiness by 0.05%. If we help you to be calmer and richer — help us to be happier :)
#Stellar soars 14% in 3 Weeks, will XLM bulls Break $0.12?Past Performance of Stellar
There are flashes of strength in XLM. A notable development is that the coin is outperforming BTC and ETH. For instance, it is up 14 percent from September lows and tracking higher week-to-date versus the USDT. Despite rejections of higher prices on September 21, Stellar's uptrend is still valid. The immediate resistance is at $0.12; buyers may resume formation, targeting $0.135 in the short term.
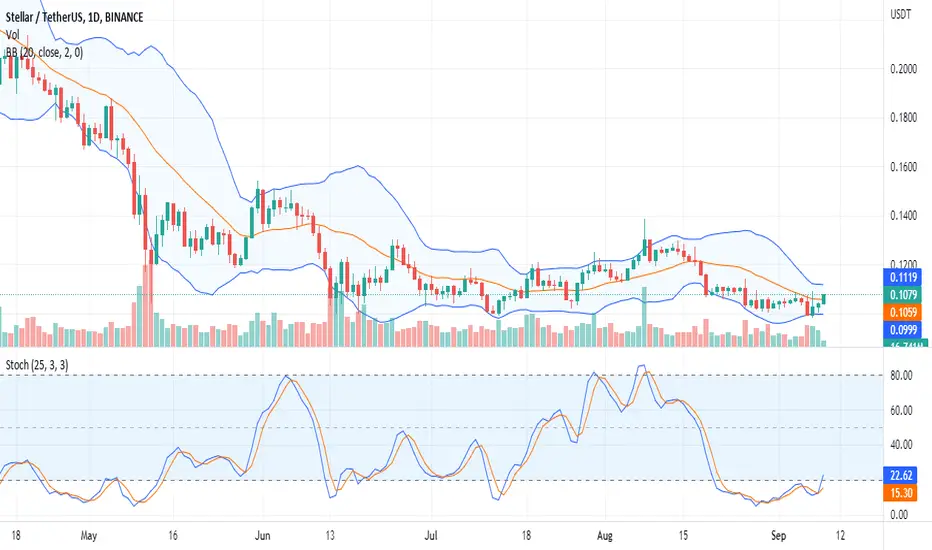
#Stellar Technical Analysis
The expansion of Stellar prices on the past few trading days is with rising trading volumes. This development is overly bullish and signals buyers' participation. Since prices are firm and buyers appear to be in charge, traders can find loading opportunities on pullbacks above $0.105 and the middle BB. The immediate target, in that case, will be August 2022 highs at around $0.135, as mentioned earlier. On the reverse side, sharp losses confirming bears of September 21 may see XLM contract back to $0.098 in a retest.
What to Expect from #XLM?
XLM buyers are solid; the coin may tick higher with rising volumes as it bottoms up. The immediate support is at $0.105, while resistance lies at $0.12. Any surge above this week's highs may initiate demand, possibly lifting the coin to new multi-week highs at $0.135 or better in the medium term.
Resistance level to watch out for: $0.12
Support level to watch out for: $0.105
Disclaimer: Opinions expressed are not investment advice. Do your research.

XLM forming Cup and HandleXLM is forming classic Cup and Handle pattern,so expecting bullish momentum from here.

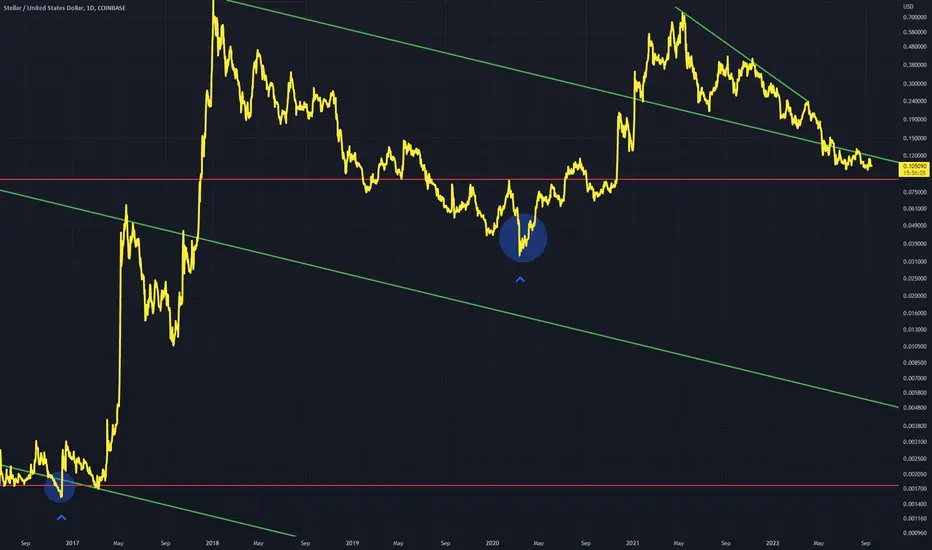
XLMUSD Near a Breakout? Stellar has poised itself like in the past above this diagonal green line
Comparable points in blue
Price may act as a falling wedge
I have seen this falling wedge on other charts for example EOS. Link to this EOS chart below
XLM bottom signal and potential breakout.....patience!This is a follow on XLM/BTC pair chart I posted earlier to elaborate on the idea that a breakout could be in order for XLM. As with many other severely beaten down alts, XLM is beginning to show strength on the BTC pairing.

Perfect place for a stoplossHere's a quick little low risk trade that I came across on XLM. What a beautiful setup on a daily chart with a stop below yesterdays candle and a 10% take profit.

#Stellar is down 80% from All-Time Highs; Is the Bear Run Over?Past Performance of Stellar
Stellar is firm, recovering, and up roughly five percent in the past 24 hours. At spot rates, the coin is bouncing from around 2022 lows. Specifically, XLM buyers are building on gains of September 7, rejecting bear calls. Still, despite the welcomed expansion, prices are within a bear formation.
#Stellar Technical Analysis
The August 19 bear candlestick is conspicuous in the daily chart and defines the current trend. Since the wide-ranging bar was printed, XLM prices have maintained a strong downtrend. Presently, prices have found support at around 2022 lows with hints of slowing downsides considering the series of higher highs relative to the lower BB. While bears are firm, the tide may swing to favor XLM buyers if prices close above the 20-day moving average and $0.11. The breakout would signal the end of the 10-month correction; thus, the leg up ought to be with rising trading volumes. If this pans out, XLM may rally towards $0.13. Conversely, sharp losses below July 2022 lows at $0.097 will reaffirm bears, forcing XLM towards $0.069 in a bear continuation pattern.
What to Expect from #XLM?
The coin is down 80 percent from May 2021 highs. After such heavy losses, XLM buyers may find relief if prices expand above $0.11 in alignment with the gains of September 7. However, should bears continue to dig in, XLM could slump to new multi-month lows.
Resistance level to watch out for: $0.11
Support level to watch out for: $0.097
Disclaimer: Opinions expressed are not investment advice. Do your research.
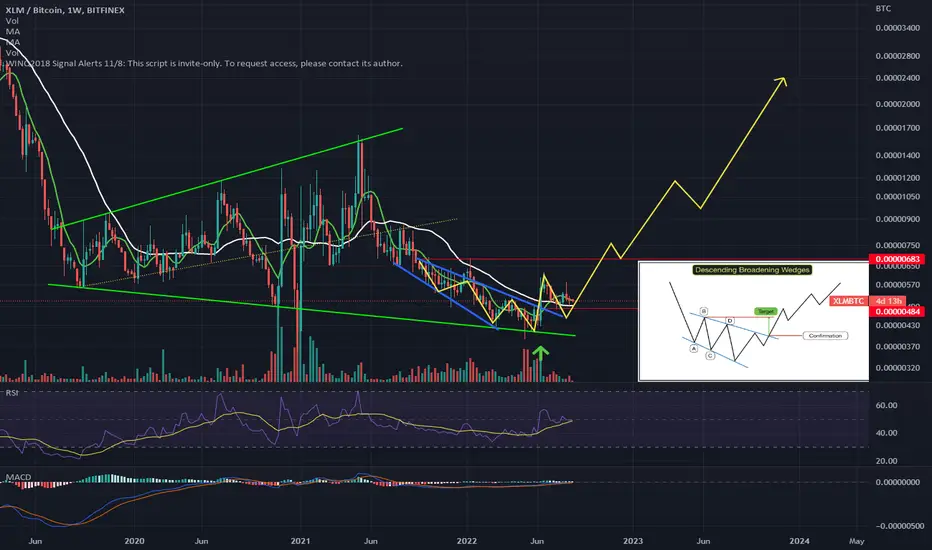
XLM - beutiful wedge inside wedge !There is a beautiful broadening bullish wedge forming (blue line) that has recently broken to the upside.
Confirmation has been signaled and price is in backtesting mode.
This broadening descending wedge is developing inside a larger pattern: a broadening bullish wedge (not descending but broadening to down- and upside).
All this happens on the BTC pair.
My take is that once Altseason gets going XLM will be one of the most explosive coins in the market.
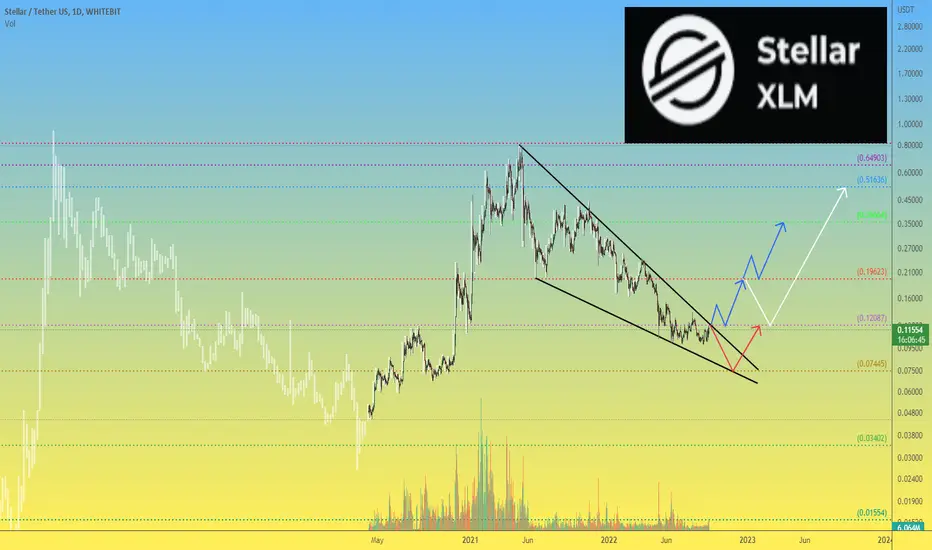
XLMUSDT 1W Complete trading history for 8 years and what next?Before you is the longest trading history of XLMUSDT
Someone may think that this review is timed to the hype news that Robinhood can be listing XLM on its site.
But no, this review is timed to the 8th anniversary of the trading of the XLMUSD pair.
It was at the beginning of August 2014 trading of the XLMUSD pair started, or on some crypto exchanges they marked STRUSD (only those who have been on the crypto market for many years know about this, now you know too :)
Now many users are expecting a shot of the XLM price
But we would be careful with expectations of super growth, because the reality may be different.
Yes, now the XLMUSDT price can break up to $0.165-0.17. Further, adjust to $0.12 and if the price is firmly fixed above $0.12 - then strong long. But you have to understand that it can be a long-term investment.
But you have to be careful, it's more about us, because the chance that the XLMUSDT price can still fall to $0.075 is quite high, and buying there would be a very profitable deal.
Summarizing:
- If you have already bought Stellar, then you can expect growth to $0.17, maximum to $0.2 and further correction. Also keep a short stop on the position.
- Safe entry into the long XLMUSDT position after fixing the price above $0.12. Growth targets are $0.2 and $0.35
- A very conservative entry into the position is to place a buy order XLMUSDT at $0.075 and wait for a lucky price spill
_______________________________
Since 2016, we have been analyzing and trading the cryptocurrency market.
We transform our knowledge, trading moods and experience into ideas. Each "like under the idea" boosts the level of our happiness by 0.05%. If we help you to be calmer and richer — help us to be happier :)

Stellar Lumens waiting for a pullbackAfter breaking through a diagonal resistance line, the price is testing another diagonal mini resistance.
I would expect a return on the support in red for a good entry, unless it gives indications that it won't go back there anymore.

Stellar 0.618 RecoveryStellar has formed its early break out structure (falling wedge)
0.618 is a strong level of support and a likely point for price breakout of the falling wedge in white
A larger symmetrical triangle can also be drawn

Stellar Bulls Surging, XLM Prices May Retest $0.13Past Performance of Stellar Lumens
Stellar Lumens prices are rallying and syncing with the broader market. The coin is stable on the last trading day but trending above a multi-month resistance trend line traced to April 2022. As the XLM prices bottom up, traders may find opportunities to ramp up in lower time frames.
#Stellar Lumens Technical Analysis
XLM prices plunged 88 percent after peaking at $0.75 in May 2021. Currently, the coin is up 16 percent from 2022 lows, and buyers are in control, reading from the candlestick arrangement in the daily chart. As price action takes shape to favor buyers and prices break higher above the critical resistance level, traders may search for entries on dips, targeting $0.13 in the medium term. This preview, however, is only valid if prices are steady above $0.10. Any breach below this reaction point may force XLM towards $0.09 or worse in a bear continuation formation.
What to Expect from #XLM?
The bounce to spot rates is refreshing for token holders and may find the base for another leg up towards $0.17 and Q1 2022 lows. Still, the rapidity of the uptrend will highly depend on if there is confirmation of July 18 gains and the level of trader participation. Any expansion in trading volumes with rising prices could signal strength and buyers taking charge after months of lower lows.
Resistance level to watch out for: $0.13
Support level to watch out for: $0.10
Disclaimer: Opinions expressed are not investment advice. Do your research.

XLM BROKE INTO NEW TRADING RANGE!! XLM just did a S/R flip and since it is trading above resistance, i can see a strong pump coming. Manage your risk and this can be a fruitful LONG! Lets just hope btc doesnt dump....
Every day the charts provide new information. You have to adjust or get REKT.
Love it or hate it, hit that thumbs up and share your thoughts below!
Don't trade with what you're not willing to lose. Safe Trading, Calculate Your Risk/Reward & Collect!
This is not financial advice. This is for educational purposes only.
#Stellar Lumens Bearish, XLM Primary Support at $0.10Past Performance of Stellar Lumens
Like the rest of the crypto market, Stellar Lumens remains within a bear trend. Despite recent gains, there are clear lower lows in the daily chart. At spot rates, XLM is down roughly five percent as bears reverse last week's gains.
#Stellar Lumens Technical Analysis
The XLM coin is bearish at spot rates, with upsides limited at $0.13, last week's highs. Notably, prices are below the June 23 and 24 trade range with rising trading volumes over the past few days suggesting increasing liquidation pressure. Still, XLM bulls are optimistic about recovery if prices are above $0.10, June's 2022 lows. Risk-averse traders can wait for a clean, high volume breakout above $0.13 to load on dips targeting $0.15. Conversely, deep losses below $0.10 may see XLM slide deeper towards $0.09, a February 2020 reaction point.
What to Expect from #XLM?
At spot rates, XLM is retesting Q3 2022 highs, and price action is skewed for sellers. If bears take charge, further losses below $0.10 may see the coin slip to print multi-month lows.
Resistance level to watch out for: $0.13
Support level to watch out for: $0.10
Disclaimer: Opinions expressed are not investment advice. Do your research.

Interesting setup for StellarHere's an interesting setup for Stellar if it plays out. I don't expect this to work out given the headwinds all markets are seeing right now, but if stellar holds this line as support, it would potentially mean a big swing to the upside (7X back to the top). Invalidated if it breaks below.

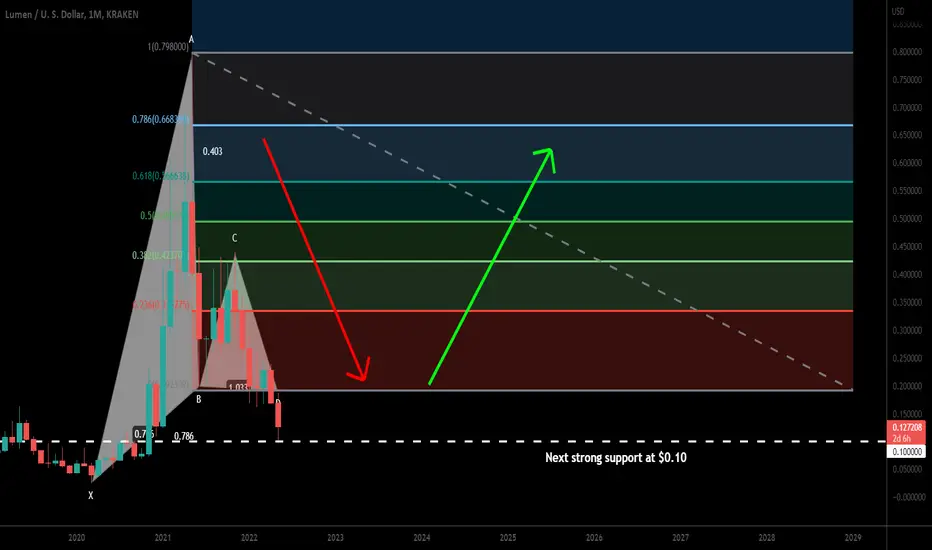
XLMUSD - 1W - Wait for the end of this falling wedgeHi guys,
on the weelky timeframe we can notice Stellar (XLM) is in a giant falling wedge pattern. This is usually a pattern leading to an upside move.
We can't ignore the red path as bitcoin and macro are not at their best at the moment. Bitcoin still on the edge of further downside.
However, if things can get better for crypto, we can imagine (and pray) for the green path.
then first target would be the 0,47$ (strong resistance and ichimoku level on the monthly / daily)
then second target is the top of the falling wedge which is also the previous ATH (weekly close) at 0,70$.
This could form a giant cup and handle. If and only if we have a strong break to the upside with a strong candle close :)
if this cup and handle is confirmed the targets will be awesome.
But dont get excited too quickly there are still many targets to achieve first.
If you agree, please feel free to like this idea :)
Bye guys
NFA

XLM - starting to outperform BTCAs many altcoins, XLM has started to massively outperform Bitcoin !!
Will be interesting to see how this further develops ....
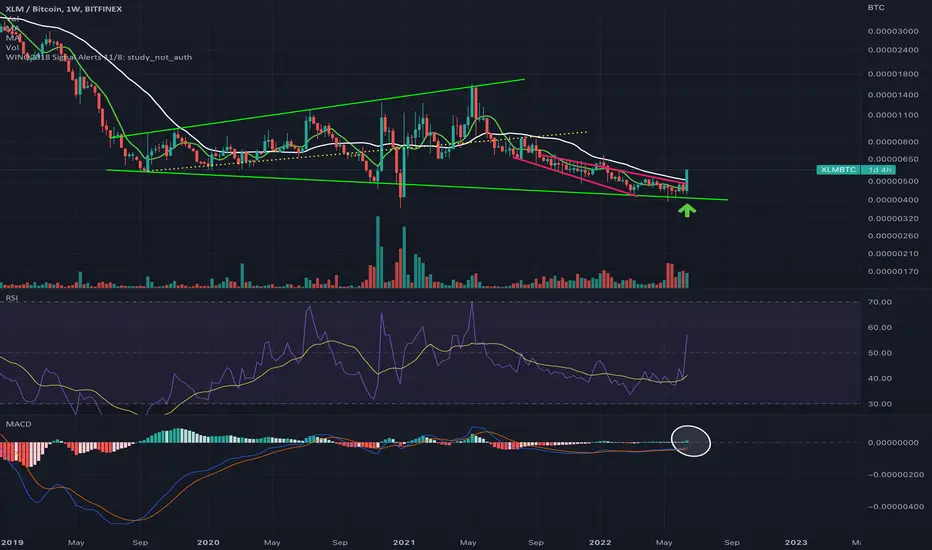
Stellar Lumens XLM Is Using The Support Of Previous TriangleHi friends, and welcome to the new update on Stellar.
Big wedge and key support:
On a weekly time frame, XLM has bounced from the key support of $0.12 and the support of a big falling wedge pattern. This move can also be seen on a monthly time frame.
After breaking out this wedge the next move can be up to $0.75, which is the top of this wedge. Before this XLM had already broken out a big channel as well.
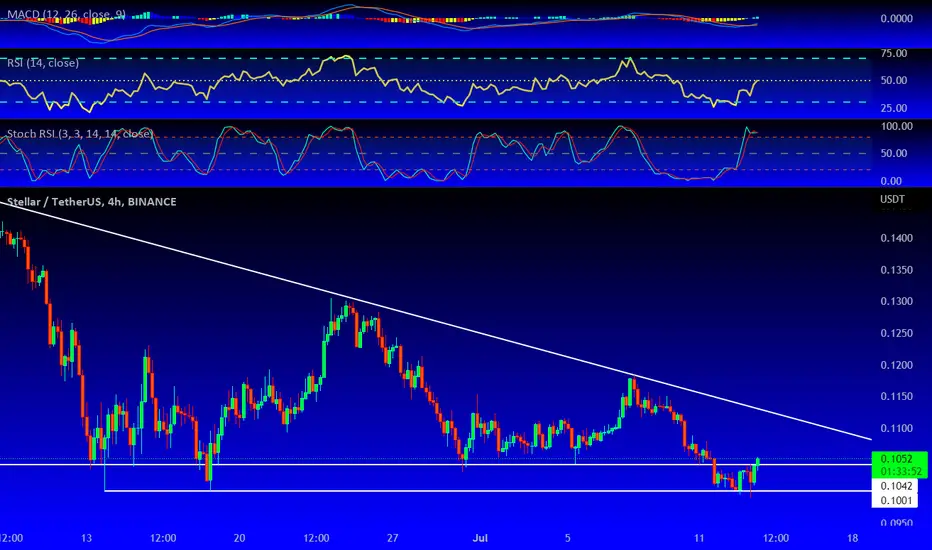
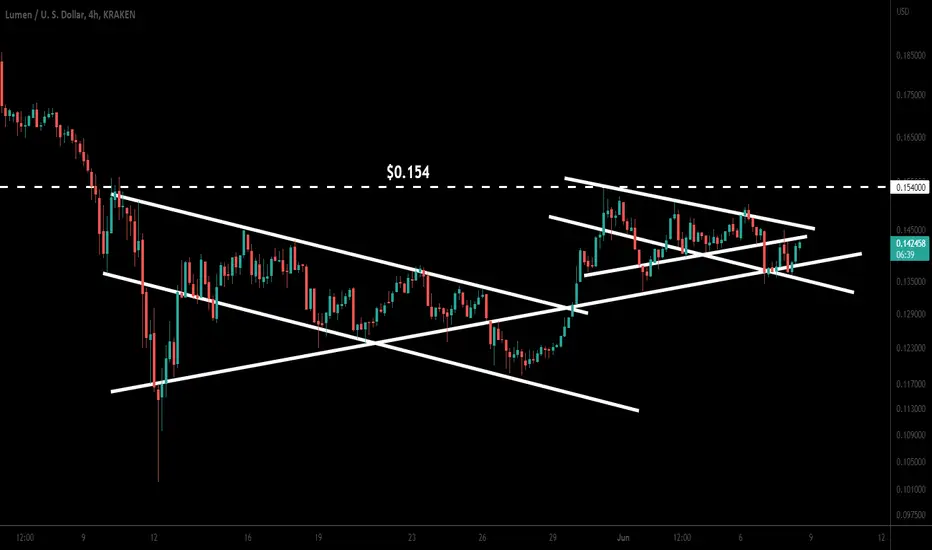
Symmetrical triangle and external supports:
On a 4-hr time frame, Stellar has broken down a symmetrical triangle. But it has still a down trendline support and the previous triangle's support is also still in play. Therefore,
there is a probability, that XLM will breakout the resistance of the triangle using these supports. After the breakout XLM can also break out the next resistance of $0.154.
Conclusion:
Even though Stellar has broken down the triangle but some external supports are in play therefore, there is a possibility that stellar will breakout the same triangle whcih is broken down.
STELLAR : XLM movement viewSTELLAR: XLM movement view
Target 0,15 - in case there is a breakdown trend on BTC - this target could be canceled.
At this time XLM shows movement effect.

Stellar (XLM) formed bullish Gartley for upto 2460% rallyHi dear patrons, hope you are well and welcome to the new trade setup of XLM.
On a monthly time frame, XLM has formed bullish Gartley pattern.
Note: Above idea is for educational purpose only. It is advised to diversify and strictly follow the stop loss, and don't get stuck with trade
ARIASWAVE - XLM STELLAR LUMENS PRICE ACTION UPDATEThis video should be used as educational purposes only and is not financial advice.
This is for all of the loyal ARIASWAVE followers out there that love XLM.
I know you have been waiting for me to post something a little bit more informative about this Crypto.
Hopefully you would have seen my previous video which highlighted the latest wave analysis across some major markets.
The emphasis here is on what appears to be a the start of a sideways correction.
In order to fully understand how this range bound market price action will unfold I encourage you to learn ARIASWAVE.
Aside from that I will be providing some updates as this correction progresses and all I can say is that it will likely be a drawn out process.
These are times of much confusion but don't worry because by using this methodology I will be able to anticipate the coming moves.
If you haven't seen that previous video yet, I have linked it down below in related ideas.
Remember to use Disciplined Money Management Principles to ensure longevity as a trader.
If you don't know the long term pattern shouldn't you be doing your research instead of just following the crowd?
Just remember: I am not a financial adviser, I suggest using this only as a guide. Always do your own research.
