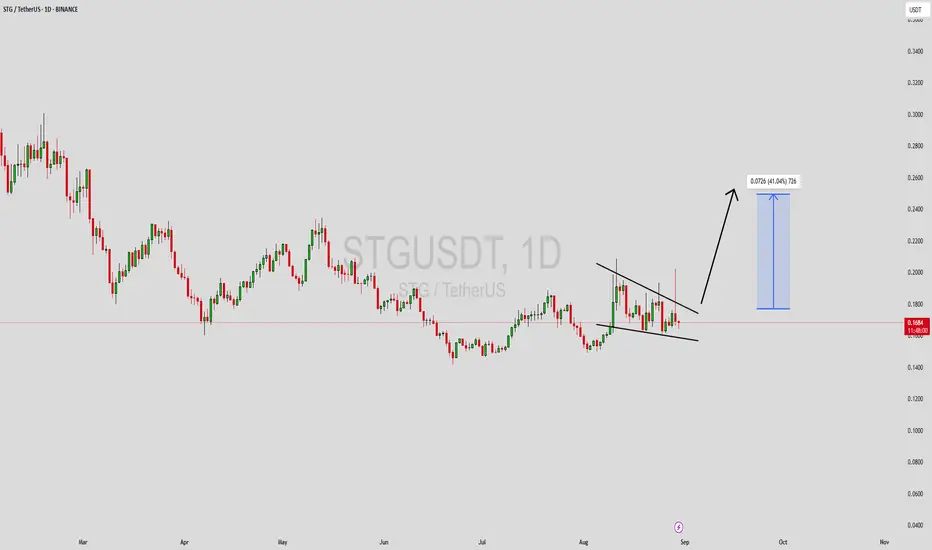
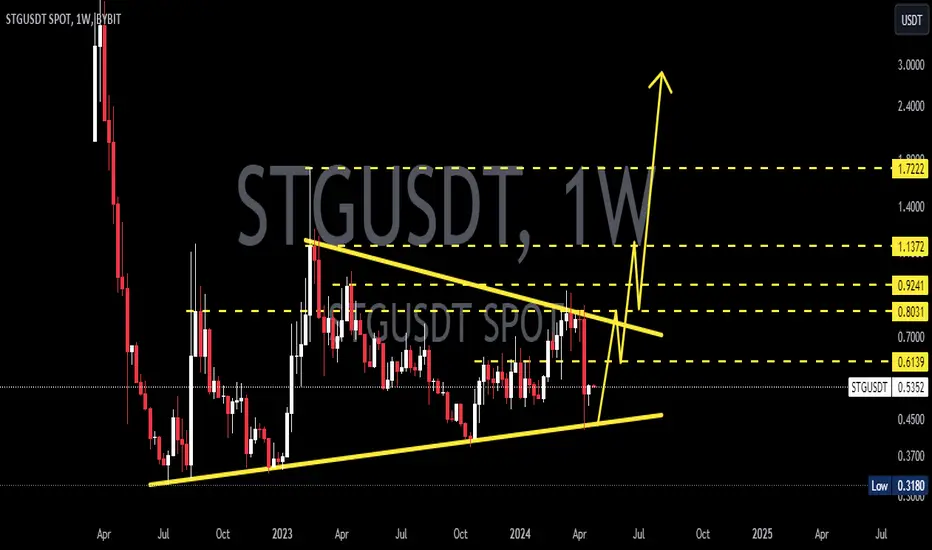
STGUSDT Forming Symmetrical TriangleSTGUSDT is currently consolidating within a Symmetrical Triangle pattern, a formation that often signals a potential breakout. This type of structure generally represents a period of indecision in the market where buyers and sellers are in balance, but as the range narrows, a strong move is usually triggered. With volume showing signs of strength, the probability of an upward breakout increases, opening the door for a solid bullish continuation.
Traders are eyeing a potential 30% to 40% gain from the current levels if the breakout confirms to the upside. The contracting price action inside the triangle suggests that market participants are building positions, and once the breakout occurs, volatility is expected to rise. Such setups are considered reliable when paired with good volume, making STGUSDT a coin of interest at the moment.
Investor confidence is also growing as more attention shifts toward this project, adding further support to the bullish outlook. The increasing participation shows that traders are preparing for possible momentum that could push STGUSDT into a new price zone. Holding above key support levels will be crucial to maintaining this bullish structure.
✅ Show your support by hitting the like button and
✅ Leaving a comment below! (What is You opinion about this Coin)
Your feedback and engagement keep me inspired to share more insightful market analysis with you!
STGUSDT
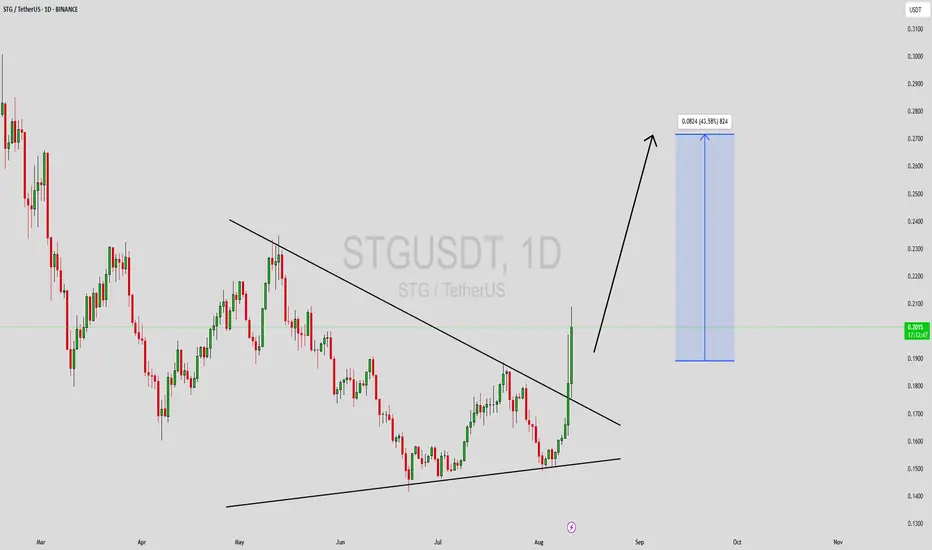
STGUSDT Forming Descending WedgeSTGUSDT is currently caught in a well-defined descending wedge pattern, which most traders recognize as one of the more reliable bullish reversal setups. The price action has been narrowing between descending resistance and a rising support line, signaling a potential shift in momentum. Now that STG has broken decisively above the upper trendline, it's flashing bullish intent, and with healthy volume backing the move, the stage is set for a 30%–40%+ rally once upside targets are met.
Technical indicators are lining up in STG’s favor. The token recently traded above its 200-period EMA, a sign of strengthening trend direction. Momentum indicators like RSI and MACD are climbing, providing further confidence in the breakout's validity. The rising volume adds more weight to the move — showing that buyers are stepping in with conviction.
From a narrative perspective, STG is back in the spotlight thanks to heightened investor interest and industry chatter. Most recently, a high-impact news development—LayerZero's proposal to acquire Stargate Bridge—acted as a powerful price catalyst. That news sparked a resurgence of momentum and renewed speculation, fueling upside moves across crypto communities.
If you're looking for a technical setup with a clear structure, strong volume, and narrative tailwinds, STGUSDT is delivering just that. Watch for powerful breakout dynamics and keep an eye on resistance zones; this chart has many of the traits of a breakout-ready setup.
✅ Show your support by hitting the like button and
✅ Leaving a comment below! (What is your opinion about this Coin)
Your feedback and engagement keep me inspired to share more insightful market analysis with you!
$STG Breakout 93% Move Ahead?NYSE:STG just broke out of a long-term downtrend and flipped the $0.1644–$0.1786 zone into support.
If this level holds, it could rally toward $0.3480, nearly 93% upside.
Momentum looks strong, and the breakout is clean.
One to watch closely.
DYOR, NFA

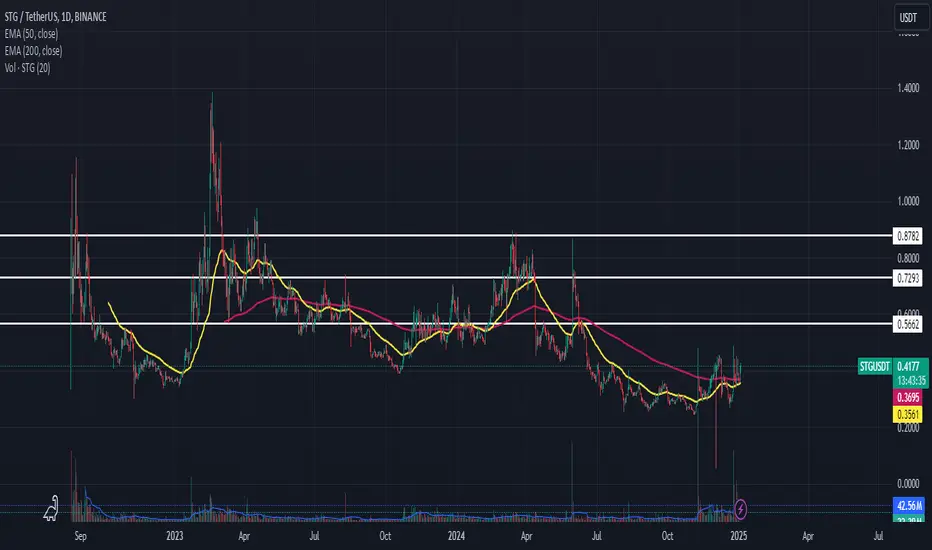
"STG/USDT targets $2-$5 amid bullish momentum and Vitalik buzz!
Chart Analysis:
1. Current Price: STG is trading at $0.4167, above the 50-day EMA ($0.3561) and the 200-day EMA ($0.3695), indicating a short-term bullish trend.
2. Key Resistance Levels:
- $0.5662: Immediate resistance, as it marks a previous price reaction zone.
- $0.7293: A critical level to breach for bullish momentum continuation.
- $0.8782: Strong resistance zone before entering the $1 range.
3. Volume: Recent spikes in volume suggest increased buying interest.
4. Potential Upside Targets:
- $2: A significant psychological and technical resistance, requiring a breakout above $0.8782 and consistent volume.
- $3: Mid-term target, achievable if $2 holds as support.
- $5: A long-term target, contingent on a sustained macroeconomic and market-wide crypto rally.
Vitalik Buterin's Involvement:
Recent reports about Vitalik Buterin's mention or potential association with STG might fuel speculative interest, leading to increased buying pressure. His name often correlates with trust and excitement in the crypto community. However, without clear confirmation or significant utility driven by his involvement, this may remain speculative.
Conclusion:
- Short Term: Watch for a breakout above $0.5662 and sustained volume.
- Mid to Long Term: Achieving $2, $3, and $5 depends on broader market conditions, ecosystem development, and concrete news about Buterin's role.
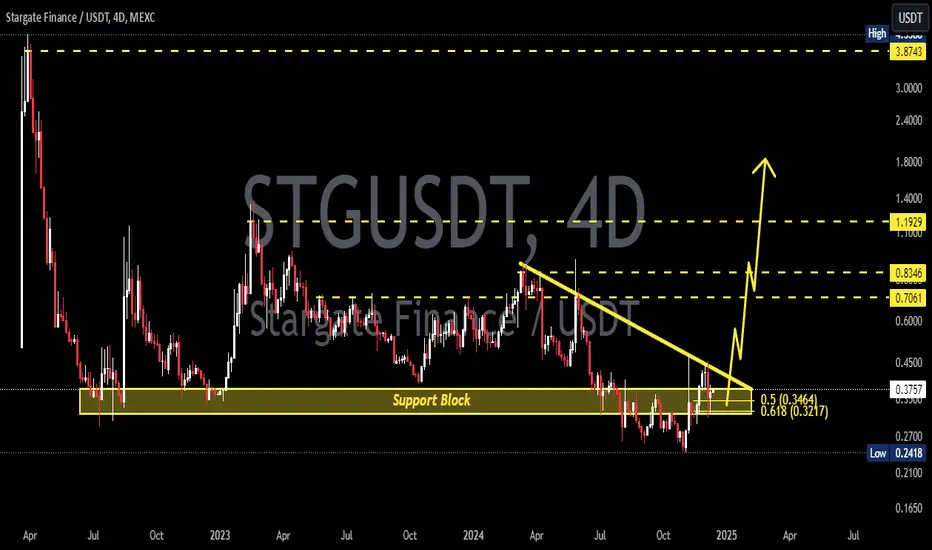
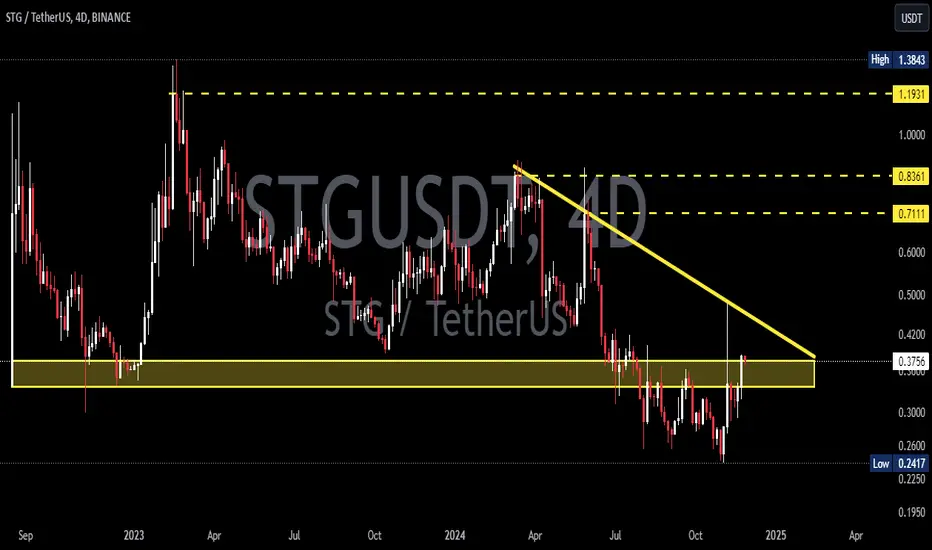
STGUSDT 4DSTG Update ~ 4D
#STG If you still have Conviction on this coin. Buy in increments from here with a short term target of at least 20%+

STGUSDT 4DSTG ~ 1W
#STG If you still have Conviction on this coin. Buy in increments from here with a short term target of at least 20%+,, bulls will start pumping prices from here.
Stargate finance ( STG)Stg usdt Daily analysis
Time frame 4 hours
Risk rewards ratio >1.3 👈
Stg is an omnichain-native asset bridge designed to solve the blockchain trilemma , which says blockchain can be desensitized, secure and fast simultaneously.
STG is a good and promising currency in the crypto market. Given the strong team it has, I expect very good growth. Although STG has strong competitors in DeFi such as Polkadot. One of the advantages of StG over Dot is its speed of operation, and of course it has other advantages.
Technical analysis:
Stg is moving between 2 parallel line for 8 week. It's very good movement for traders.
Buy in down and sell in up. But I think in alt season STG will break this parallel and pump. But I have a short time analysis.
When STG break the upper side , I'll reach my target and start to another analysis to higher target
STGUSDT 1WSTG ~ 1W
#STG If you still have Conviction on this coin. Buy in increments from here with a short term target of at least 20%+
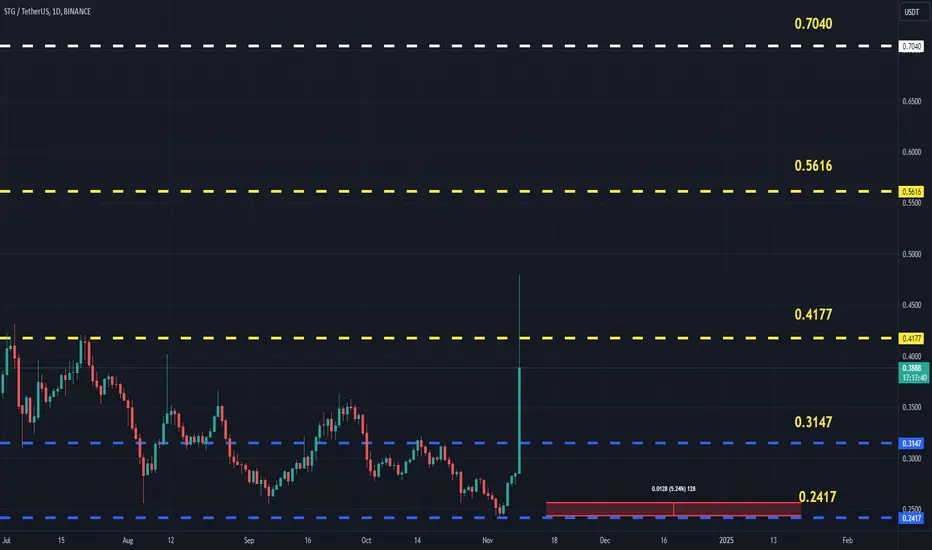
STGUSDT (StargateFinance) Updated till 09-11-24STGUSDT (StargateFinance) Daily timeframe range. we can see a nice move here now all it needs a clean close over 0.4177 that can push it further. for the pump not get invalid it needs to stay above 0.3147. re-entry is valid from recent support from a retrace candle.
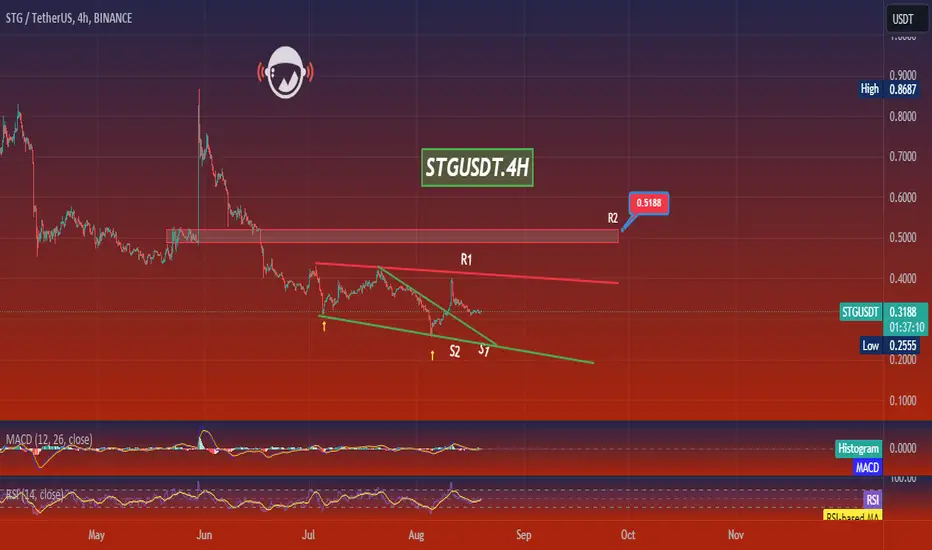
STGUSDT.4HReviewing the STG/USDT chart on a 4-hour timeframe reveals a persistent downtrend, characterized by lower highs and lower lows. This analysis draws from various technical indicators and chart patterns to evaluate the current market dynamics and potential future movements.
Key Observations:
Trend and Chart Patterns: The asset has formed a descending channel, confirmed by the alignment of lower peaks and troughs. This pattern typically indicates continued bearish momentum. The current price is nearing the lower boundary of this channel, suggesting a crucial testing point that could determine short-term market direction.
Resistance and Support Levels: The chart displays key resistance (R1) at around $0.4 and a stronger resistance (R2) at approximately $0.5188. Support levels (S2 and S3) are indicated lower on the chart, with the immediate support (S3) being tested. A break below this could lead to further declines.
MACD Indicator: The MACD line is below the signal line and both are trending downwards, which typically indicates bearish sentiment. The negative histogram further confirms this bearish trend.
RSI Indicator: The Relative Strength Index is near 45, which is neither oversold nor overbought. This indicates a somewhat balanced yet slightly bearish momentum, as it leans towards the lower end of the neutral range.
Technical Analysis and Conclusion:
Given the proximity to the lower boundary of the descending channel and the testing of support level S3, this is a critical juncture for STG/USDT. If the support holds, it could provide a rebound opportunity towards resistance levels R1 or potentially R2. However, a break below this support could exacerbate the bearish trend, potentially reaching new lows.
Trading Strategy:
For traders, the strategy would depend on the price action at the support level S3:
Bullish Scenario: If the price shows signs of recovery at S3 with increasing volume and a bullish reversal pattern, consider a long position with a target at R1 and a stop-loss just below the recent lows.
Bearish Scenario: If the price breaks below S3, a short position could be warranted, targeting further downward movement. The stop-loss in this case would be set just above the breakout point.
Investors should monitor further developments closely and adjust their strategies based on actual price movements and additional market factors. Always consider using stop-loss orders to manage risks effectively.
STG/USDT NEW BREAK POSSIBLITYSTG/USDT shows the low time frame possibility for new volume which can affect the price for an uptrend. ( depend all on high chance) There are no guarantees in the markets.
The new increase volume updates always start with interest if there is a confirmation to follow and if there is a building with a hold for a time.
90% of coins this time are not building coins. Some % also show a start fake trend and return to where it started. time frame confirmation + high levels building is important for a healthy coin.
There is a good chance for a break in the coming time.
Trend levels
The coin is on important break trend which means if it can get confirmed it will break.
STGUSDT(Stargate Finance) Updated till 11-08-24STGUSDT(Stargate Finance) Daily timeframe range. another alt retraced back from its new low. breaking 0.2815 can pull it back to price discovery again. now its trying for a clean close above 0.3604. if it can than it opens the door till 0.4771.

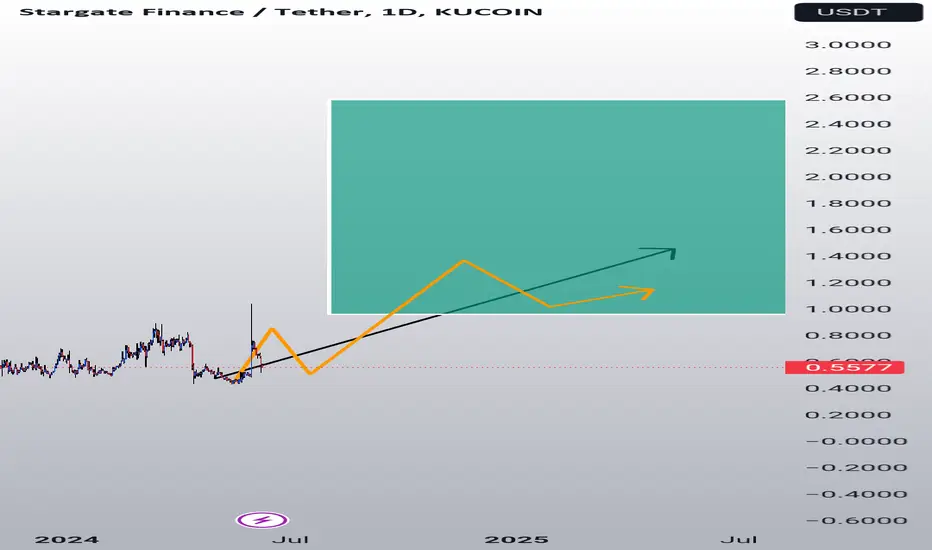
STG Long Term Profits PlanHello traders!
Currently, we are experiencing a big drop in Crypto but other markets have also been dropping hard. So, now instead of going all panic mode let's switch gears and plan ahead to take advantage of the buying opportunities. So, here's my plan in the long term for StarGate.
1) Right now, we can see price hit the Demand Zone which is the zone marked in green. It got pierced though recently after a real long time. However, it's turning into a hammer candle and reversing altogether which means strong buying pressure stepping and it could totally be a fakeout, so we should stay alert to see how it plays out.
Possible confirmations for the demand zone to be safe are: Wait for the price breakout and take a position when it re-test the zone back again.
In the future if the bearish trendline gets broken, we can expect an important rise on the price. We still have to deal with a strong supply zone which is marked in red. If price manages to pierce through the supply then we fly to the moon ♥ meanwhile, I'll be monitoring weekly and informing STG movements over time.
2) TARGETS: The nearest one would be 0.53, which would act as a mean reversion zone. After that, we can expect ranging, and we'll have to wait for signs and clues to find out what could possibly happen next. Targets long term: the supply zone and the ATH +
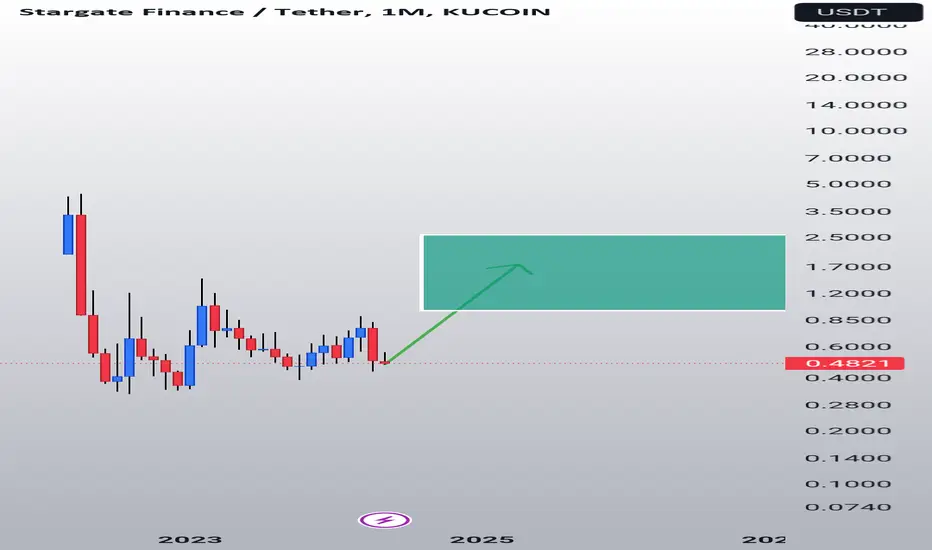
This idea is to spot for the long term. This asset is still in ranging mode; there hasn't been a breakout of the range yet. However, it's worth noting that there's a triangle pattern playing out in the monthly timeframe, right now.
I hope you find it useful and are able to take advantage of this idea.
Kina Tip of the Day: Take profits partially even when they don't seem much because, in the long run, they will grow in a balanced way with the rest of the portfolio.
Keep it shiny ⭐
Kina, The Girly Trader

STG Morning Doji Star 🍨 Massive GainsHey guys!
Well, first of all you don't want to miss this chance!
Here's my price action analysis for this coin:
We have a very strong upwards trendline that has been respected and bounced off from for 7 months. That's a huge hint to prove is a key area!
It has been faked out twice and everytime it bounced off from it, came back stronger than ever.
Last bounce we had not only it bounced off our upwards trendline but it also formed a strong bullish reversal candlestick pattern: Morning Doji Star!
We could say it's trying to break from the downwards move (pennant, triangle) these are very subjective but it adds up to the confluence ice cream bowl.
As a side note, candlestick patterns don't have a real meaning unless they happen at a high confluence zone then you really want to play attention to get on board on the train early!
Moreover, I recommend you trade SPOT this because market fluctuates and stops can get taken out in higher TF ideas. So HODL !
Targets area marked as TP1, TP2 and TP3
All the best,
Kina 🍨 The Girly Trader

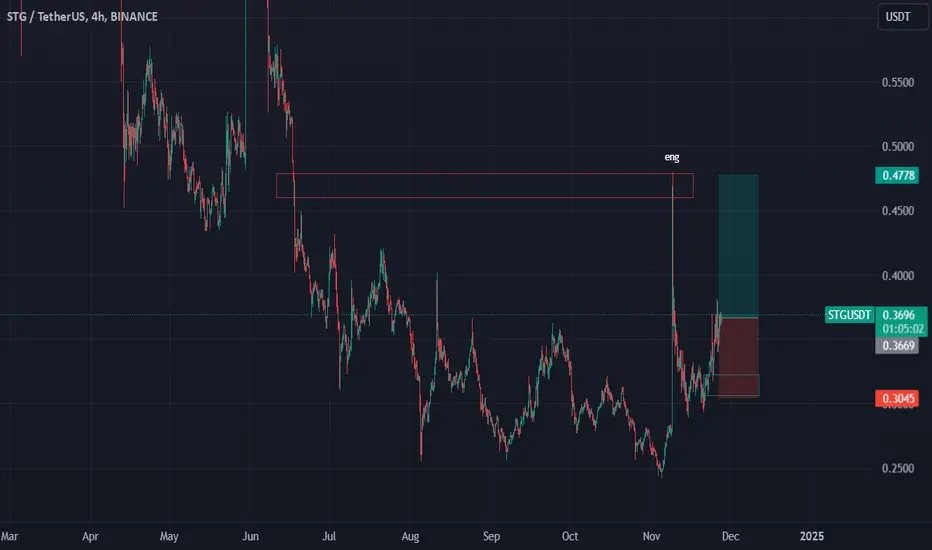
#STGUSDT: Will It Plunge to New Lows or Soar Above Resistance? Yello, Paradisers! Are you ready for the latest on #STGUSDT? It's time to dive deep into the current market movements of STG.
💎#STGUSDT is under massive selling pressure and seems poised to descend further to the crucial support zone at $0.338. However, if #STG breaks out above the $0.44 - $0.48 resistance range, it could signal a strong upward trajectory and potentially hit our target without touching the support zone.
💎The support zone has a high likelihood of a rebound for #StargateFinance, as it hasn't been tested since STG's significant previous breakout. If NYSE:STG exhibits positive signals, like a bullish candle rejection within this zone, it suggests that the support is solid, and we could see an upward movement.
💎Conversely, if #STG fails to show positive signs in the support zone, it spells trouble. A breakdown here could drive the price down to the weekly Order Block (OB) at $0.299, where numerous buyers are likely waiting. The probability of a rebound in this OB is high, and reclaiming the support zone would keep the bullish scenario intact.
💎Should NYSE:STG fail to sustain above the OB area and break down further, we may see a continuation of the bearish trend and invalidate the bullish outlook.
Trade smart, Paradisers! The next few moves in #STGUSDT are critical and disciplined strategies will make all the difference.
MyCryptoParadise
iFeel the success🌴

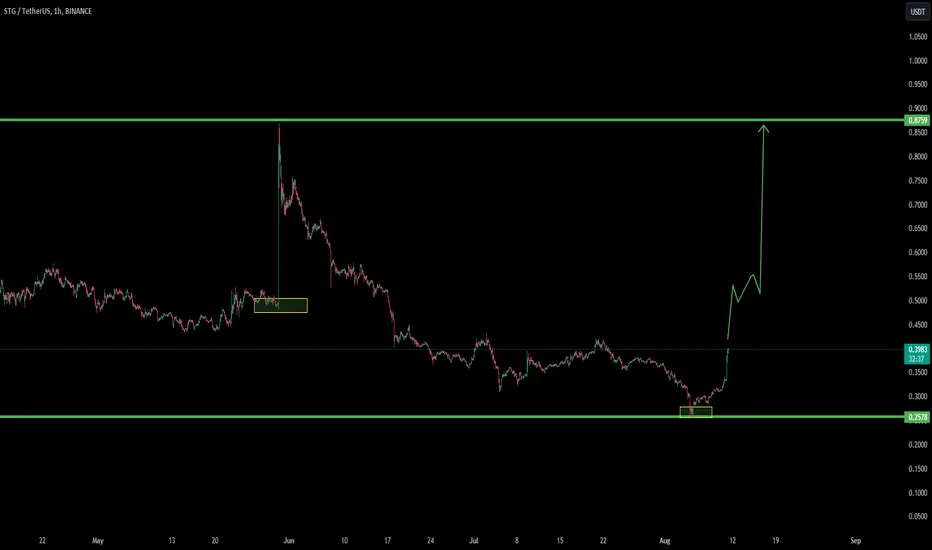
STGusdt break trend line and go to up like jetbreak trend line and go to up like jet
when coin pump and in the time come to zone of the pump and create the support zone after some time againe pum like the frist time
StgAfter the dump and good growth, it can start to move again, this currency is in a long-term upward trend and moved in the full rise of the controlled market, now it's time for the main movement. Check
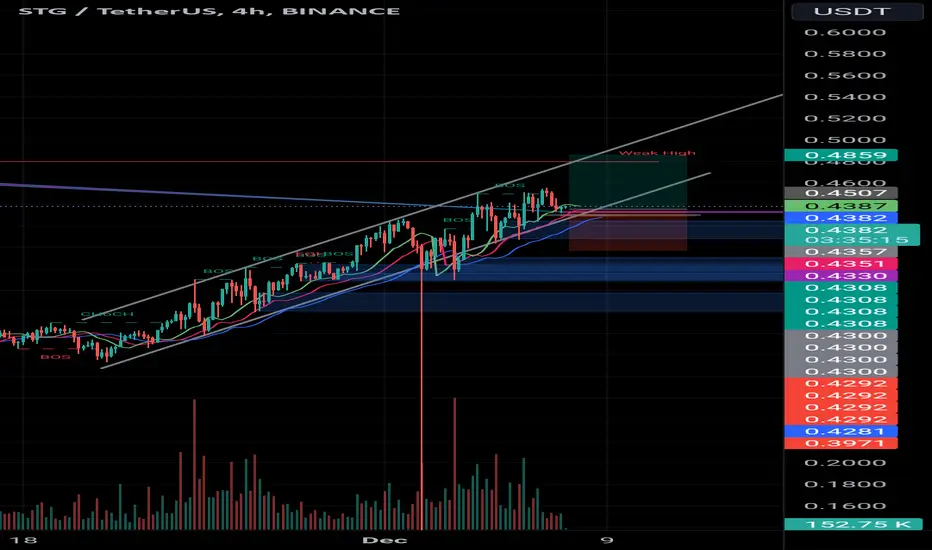
STG/USDT Can Rally After Successful Retest of Bullish OB👀🚀💎Paradisers, brace yourselves for a captivating shift in the #STGUSDT market, suggesting a possible bullish surge from its current demand zone.
💎Following a recent rejection from a strong supply zone, #STG has cleared buy-side liquidity. This scenario paves the way for a potential downward move and creates an opportunity for a rebound from the critical bullish OB at $0.4433.
💎If $StargateFinance gains enough bullish momentum, we might witness a dynamic push that challenges and potentially breaks through the upper supply zone. However, if #STG struggles to hold ground within this critical support zone, a quick strategic pivot will be required.
💎This is where Plan B comes in: the focus would then shift to initiating a bullish move from a lower demand zone at $0.3901. This level is key, as a drop below it could signal early signs of a bearish trend in the NYSE:STG market narrative.

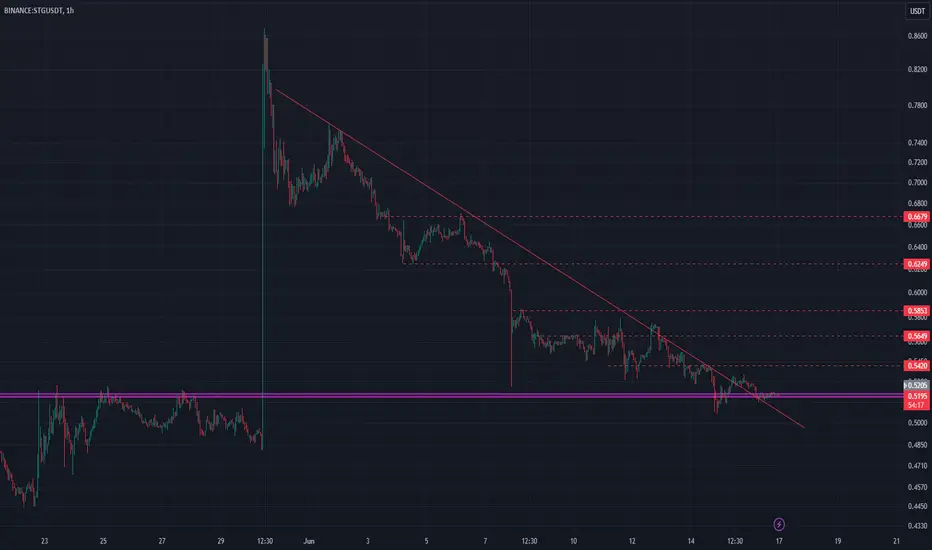
STGUSDT(Stargate Finance) Daily tf Range Updated till 31-05-24STGUSDT(Stargate Finance) Daily timeframe range. it had a nice pump, but the close over 0.7022 is not really a strong one. if it can keep up above it that will lead to 0.8549. recent retrace point is at 0.7022 breaking it will lead it to 0.5716.

STGUSD 1WSTG ~ 1W 📈
#STG This chart is very interesting and it is a 1W bigger time. We will start making Purchases gradually as long as this Support Line continues to maintain the price of BITFINEX:STGUSD ,
Update STGGood Luck >>
• Warning •
Any deal I share does not mean that I am forcing you to enter into it, you enter in with your full risk, because I'll not gain any profits with you in the end.
The risk management of the position must comply with the stop loss.
(I am not sharing financial or investment advice, you should do your own research for your money.)
