SILVER Bounce from Support?!Here we are looking at SILVER on the Weekly TF…
As you can see, SILVER has been trading within a macro symmetrical triangle structure, which has clear and established support and resistance lines.
Silver has been trading within this structure since March of 2020 (COVID—19 Crash). Since then, it has tested descending resistance 5 times on the weekly, and ascending support 3 times (so far).
Currently, SILVER is on its way to that support, and I expect it to reach that line soon (relative to the weekly TF candles).
While it’s still too early to definitively say, I do believe that SILVER will bounce from support, and make another run to resistance in another attempt to breakout to the upside.
What do you think SILVER will do next? Let me know in the comments!
Cheers!
Stockmarketanalysis

S+P bounce off its previous downtrend is bullishThis is a follow up video on the S+P, which last week bounced beautifully off its old downtrend and 200-day ma. We can only assume that this was a 'return to point of break out', that the potential bearish rising wedge pattern has been invalidated and that the bull move that started in October 2022 is in fact still in control.
Disclaimer:
The information posted on Trading View is for informative purposes and is not intended to constitute advice in any form, including but not limited to investment, accounting, tax, legal or regulatory advice. The information therefore has no regard to the specific investment objectives, financial situation or particular needs of any specific recipient. Opinions expressed are our current opinions as of the date appearing on Trading View only. All illustrations, forecasts or hypothetical data are for illustrative purposes only. The Society of Technical Analysts Ltd does not make representation that the information provided is appropriate for use in all jurisdictions or by all Investors or other potential Investors. Parties are therefore responsible for compliance with applicable local laws and regulations. The Society of Technical Analysts will not be held liable for any loss or damage resulting directly or indirectly from the use of any information on this site.

Key Levels and US Market Review for the Asian session open 7/03A review of the price action from the European session and the US session. DAX managed to hold onto recent gains while the FTSE edged lower. The US managed to open stronger and push higher but it was not long until we saw some profit taking and prices edged lower into the close. Traders continue to focus on the global economy versus sticky/high inflation and at this stage data is pointing to a resilient US economy absorbing those higher prices due to inflation. There is no fear driven selloff which shows that bargain hunters still believe in a longer term move up thanks to resilient economies so I continue to expect major swings in momentum up and down.
I remain of the view that sticky inflation is the big issue and will weigh on share markets if the Fed, and other major central banks, can not get it under control.
I look at some key levels to watch and the price action setups I expect to see play out.
Markets covered :-
DOW
Nasdaq
DAX
FTSE
ASX200
Hang Seng
USD Index
Gold
Oil
Copper

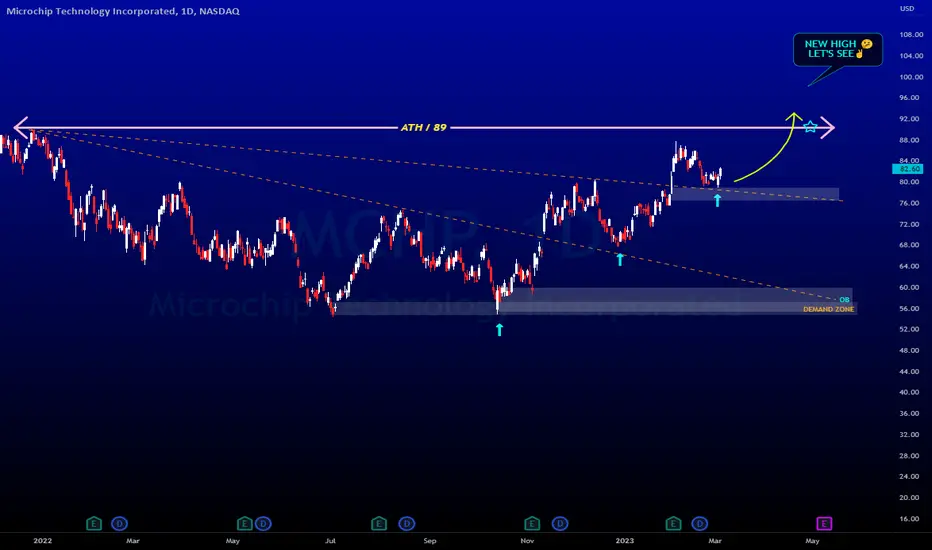
SasanSeifi 💁♂️MCHP/ 1D ⏭ $85 ? OR NEW HIGH ?🤔 LET'S SEE✌❗❗HI TRADERS ✌The possible scenario of MCHP is specified.As you can see, it is an upward trend from the range of $55. It is currently in the range of $82. We can expect that the price will grow to the range of $85 if it stabilizes above the support range of $79/$77. According to the formed HIGH and LOW, if the trend is still upward, the possibility of a new HIGH in the long-term view can be considered. We have to see how the price will react to the $85 resistance range.
Note that price stabilization above the $90 range is very important for a new HIGH.
let's see...
❎ (DYOR)...⚠⚜
WHAT DO YOU THINK ABOUT THIS ANALYSIS? I will be glad to know your idea 🙂✌
IF you like my analysis please LIKE and comment 🙏✌
Bajaj Auto Focus on Bajaj Auto.
1st Target ₹3998
2nd Target ₹4123
Note : This is just for Backtesting and Educational Purpose Only.

Key Levels and US Market Review for the Asian session open 6/03A review of the price action from the European session and US sessions with bulls taking charge and pressing major indexes higher. Traders continue to focus on the global economy versus sticky/high inflation and at this stage data is pointing to a resilient US economy absorbing those higher prices due to inflation. There is no fear driven selloff which shows that bargain hunters still believe in a longer term move up thanks to resilient economies so I continue to expect major swings in momentum up and down.
I look at some key levels to watch and the price action setups I expect to see play out.
Markets covered :-
DOW
Nasdaq
DAX
FTSE
ASX200
Hang Seng
USD Index
Gold
Oil
Copper

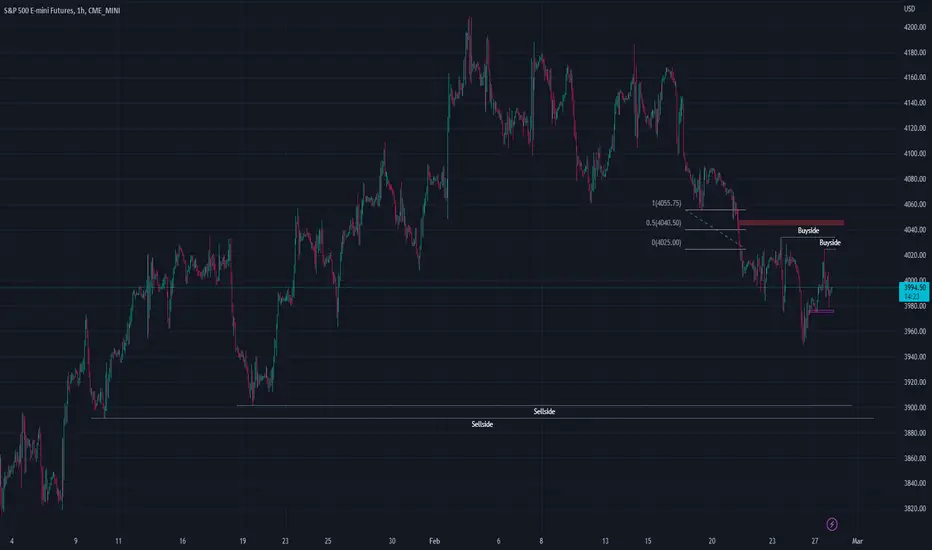
S&P analysisI want to see a run above the buyside tomorrow and a drop to the sellside after this. likely a TUE high of week. It took some big sellside and it has to distribute the sell stops again to the induced buyside above the equal highs. The sell stops are triggered and someone had to take the other side and they have long positions now. They want to sell this long positions above old highs to buy stops
Key Levels and US Market Review for the Asian session open 3/03A review of the price action from the European session and US sessions which gave us some choppy price action but generally bullish from a weak open both in Europe and the US. To me, markets remain under pressure but bulls continue to provide support on pullbacks. There is no fear driven selloff which shows that bargain hunters still believe in a longer term move up. I look at some key levels to watch and the price action setups I expect to see play out.
Markets covered :-
DOW
Nasdaq
DAX
FTSE
ASX200
Hang Seng
USD Index
Gold
Oil
Copper

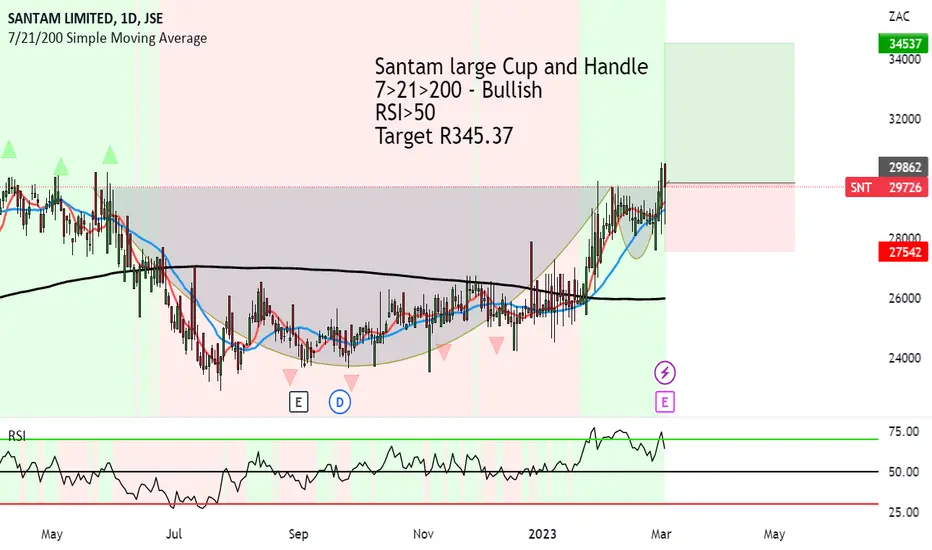
Santam showing strong upside to R345 but with a warningSantam large Cup and Handle formed, broke above the brim and now is going to test the support.
This will provide a conservative entry if we get a bounce back up.
7>21>200 - Bullish
RSI>50
Target R345.37
The warning is that it's been moving in sideways range for over a year, and it often peaks then drops and continues.
As the JSE ALSI is in a bear market at the moment (on smaller time frames) might delay the upside.
But the system says go long.
ABOUT
Santam is a South African short-term insurance company founded in 1918, making it one of the oldest insurance companies in the country.
Santam is headquartered in Cape Town, South Africa, and operates throughout the country, as well as in Namibia, Botswana, and Zimbabwe.
Santam provides a wide range of insurance products, including car, home, business, and personal insurance.
Santam is a subsidiary of Sanlam Limited, a leading financial services company in South Africa.
Santam is the largest short-term insurer in South Africa, with a market share of around 22%.
SasanSeifi💁♂️ AAPL / 1D HI Everyone ✌ By examining AAPL in the daily time frame As you can see, the trend is in the range of the midline of the descending channel. The scenario we can expect is that the price will continue to be corrected up to the range of 134/136. And then we will see a positive fluctuation. We have to see how the price will react to the mentioned ranges. If the price penetrates below the range of 136 and stabilizes, the possibility of further correction up to 122/128 can be considered.
❎ (DYOR)...⚠️⚜️
WHAT DO YOU THINK ABOUT THIS ANALYSIS? I will be glad to know your idea 🙂✌️
IF you like my analysis please LIKE and comment🙌😉

Key Levels and Market overview for the Asian session open 1/03A review of the price action from the European session and US session as end the month in the red. The USD found some buyers as expected which pressured major currencies although Gold moved up and managed to fend off the USD strength...for now. I look at some key levels to watch and the price action setups I expect to see play out.
Markets covered :-
DOW
Nasdaq
DAX
FTSE
ASX200
Hang Seng
USD Index
Gold
Oil
Copper

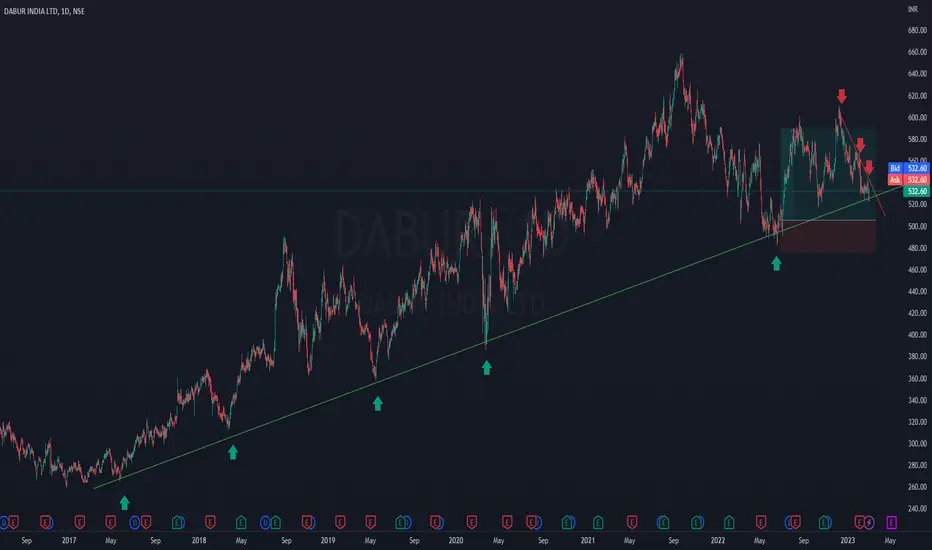
Target price for DABUR India Limitd | Daily | Long analysisHello, today we will be looking at NSE:DABUR
1. This stock has been mostly trending upwards in the long-term.
2. You can see the support level by looking at the daily candles , which the stock has touched every time and bounced back up.
3. However, this time the support level may be broken temporarily, with the stock going down before rising again.
4. Keep in mind the risks involved and trade carefully.
Thanks & regards,
Alpha Trading Station
Disclaimer: This view is for educational purpose only & any stock mentioned here should not be taken as a trading/investing advice. We may or may not have position in the stocks mentioned here. Please consult your financial advisor before investing. Because Price is the "King of Market"
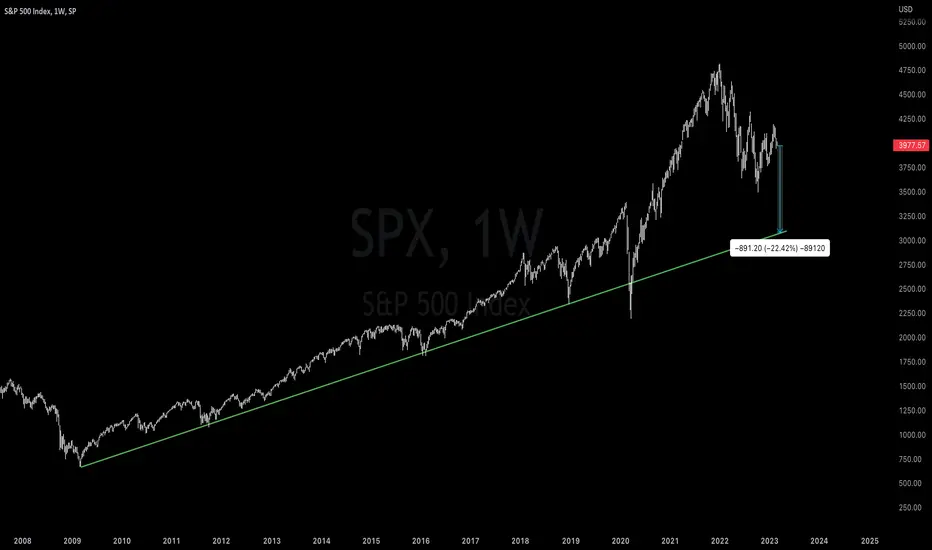
SPX ZOOMED OUT - Pay Close Attention!Here we are looking at SPX on the Daily TF...
This chart shows that the S&P 500 would have to fall about 23% just to get back to the long-term trend support. Based on calculations, this is likely a target for the second half of 2023... In addition, smart money knows that if something remains above trend for a long period of time, it will likely move below trend for a period to balance itself. This means 2024 could also be a down year for the S&P 500...
This is just an idea, but one I feel as if is very plausible, and one we must all consider...
Let me know in the comments what you think, and if you see things the same way or differently!
Cheers!
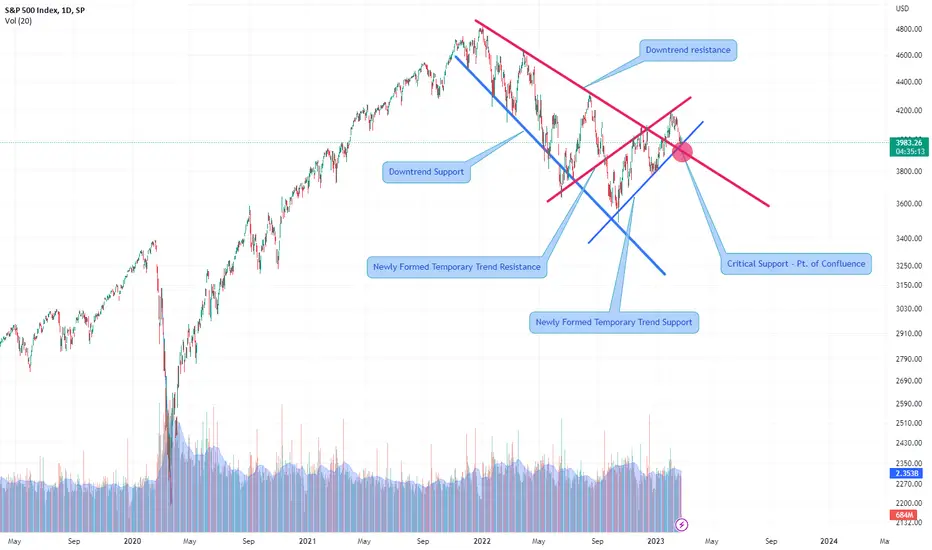
SPX500 - At a Critical JunctureSPX500 is surely at a critical juncture. Now its being held by its temporary uptrend support, where a small hammer like candle formed last trading day.
Rising inflation, bond yield & subsequently expected interest rate hike by Fed are current challenges for the current market.
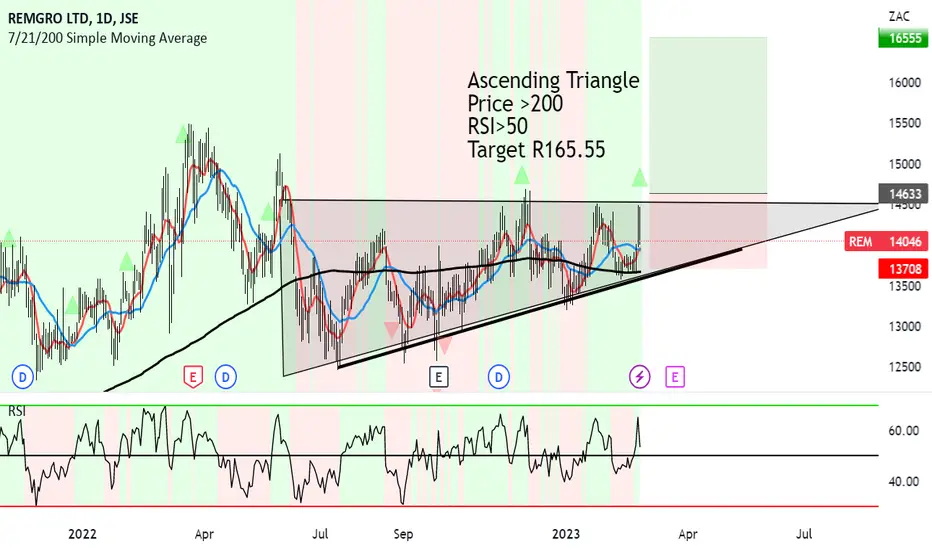
Remgro heading straight to R165.55 thanks to this triangleAscending Triangle is forming nicely on Remgro.
We see the 7 and 21 MA above 200.
But more importantly, Price >200 - Bullish
RSI>50 - Bullish
Target R165.55
ABOUT THE COMPANY
Remgro was founded in 1990 (Stellenbosch, South Africa) by Johann Rupert, a South African entrepreneur and businessman.
The company was established as an investment holding company with a focus on building a diversified portfolio of long-term investments.
Today, Remgro holds investments in a wide range of industries, including healthcare, financial services, mining, and telecommunications.
The company's portfolio includes holdings in some of South Africa's largest and most well-known companies, such as MediClinic, FirstRand, and RMB Holdings.
The company's name is an abbreviation of "REsource Management GRoup."
Remgro holds investments in a wide range of industries, including healthcare, financial services, mining, and telecommunications.
The company has a market capitalization of over R100 billion as of February 2023.
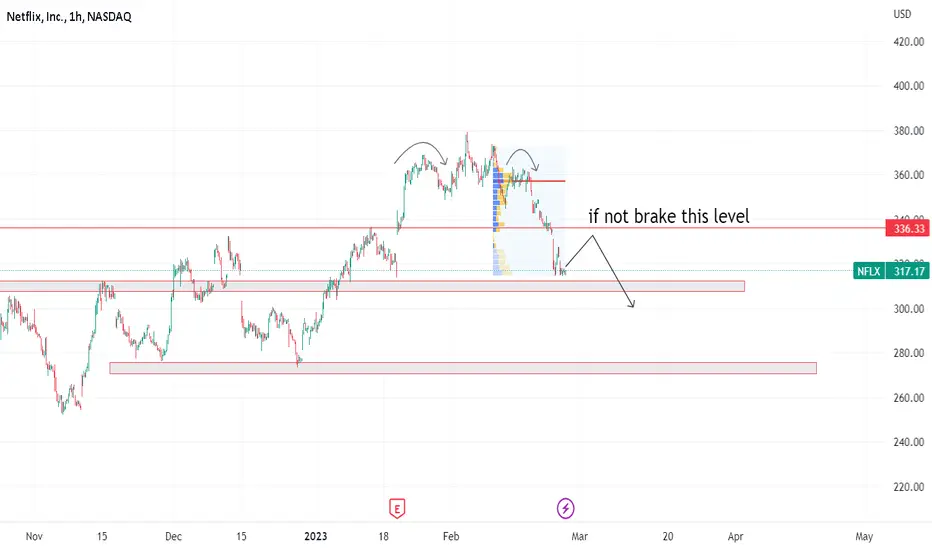
NETFLIX STOCK Netflix Holder Juts wait you cant see any impotent movement here. if not brake from upside you can see spot from down side.
Personal - Avoid and wait for new deal and level
Intraday trader can entre
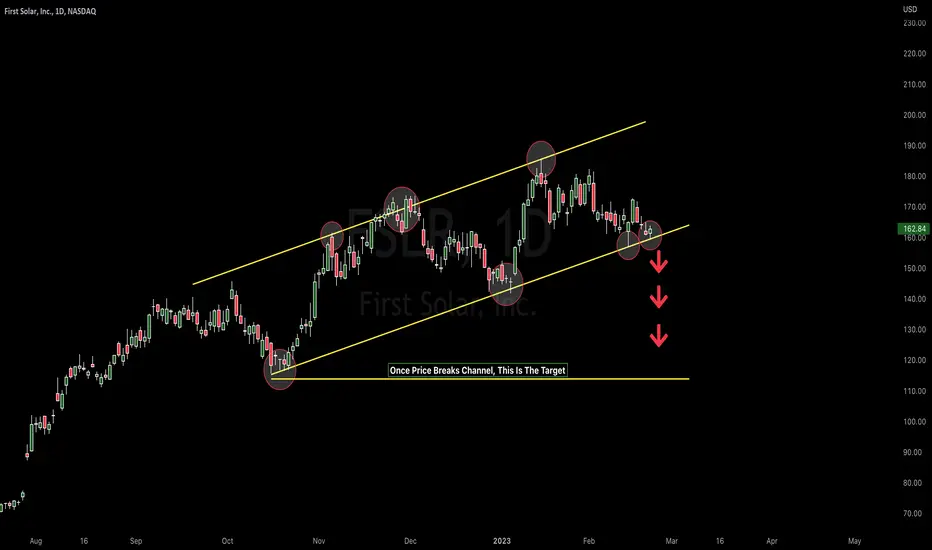
FSLR Ready to Break Support?Here we are looking at FSLR on the Daily TF…
As you can see, FSLR has been trading within an ascending parallel channel, with clear upwards sloping support and resistance. It has been trading within this rising channel since October of 2022, but I am expecting a breakdown from this structure in the coming days.
Ascending channels (as such) are bearish in their nature, thus, I expect for this channel to break to the downside soon. Additionally, the more something tests a zone (support OR resistance), the more likely it becomes for it to eventually break that zone.
As you can see, FSLR has tested support 4 times now, and is currently attempting to break down again. If it can’t hold this support, I find it likely that a move to the horizontal line will occur.
I will continue to monitor this chart, and update you if there are any significant developments.
What do you think will happen for FSLR? Let me know in the comments!
Cheers!
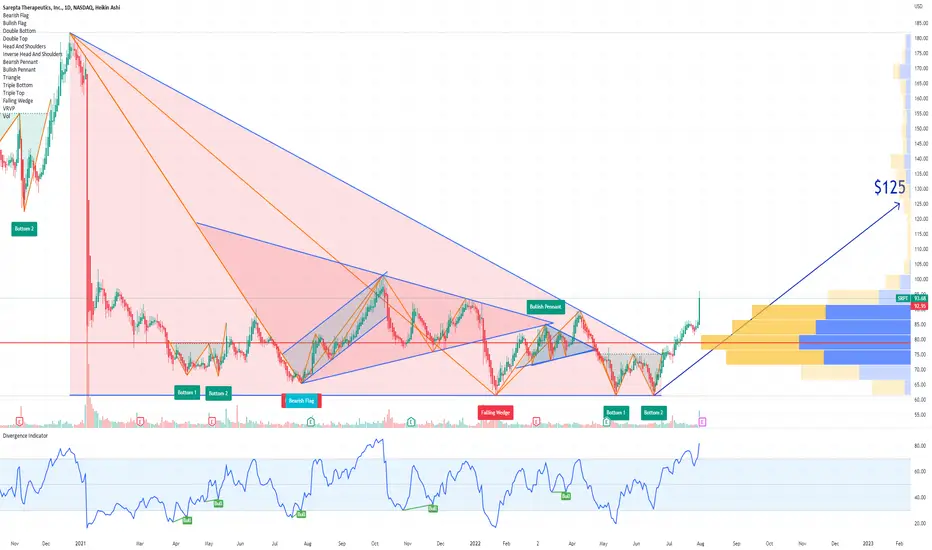
SRPT Sarepta Therapeutics Options Ahead Of EarningsLooking at the SRPT Sarepta Therapeutics options chain, i would buy the $125 calls with
2023-2-17 expiration date for about
$7.10 premium.
Looking forward to read your opinion about it.
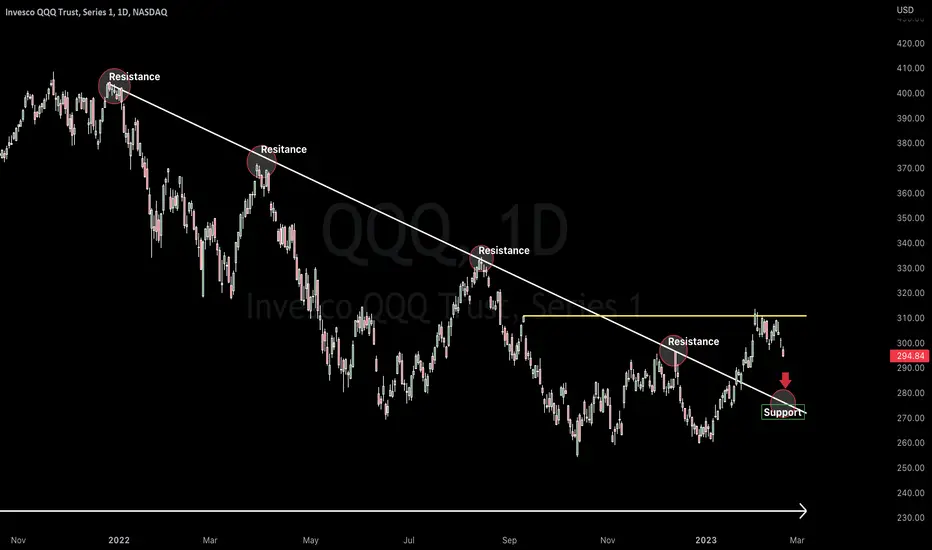
The Q's Look To Re-Test Previous Macro Resistance (as support) Here we are looking at the Q’s on the Daily TF…
As you can see, we will be analyzing QQQ’s breakout from its macro downwards sloping resistance which dates back to January of 2022. After a full year of being rejected from this downwards sloping resistance, QQQ broke out in January of 2023.
What should we expect now?
As marked by the horizontal (yellow) line, the Q’s are currently at a strong local resistance. While price can continue to interact with this zone over the next couple of days, I expect it to continue on down and re-test the previous resistance as potential new found support. If it can, get a bounce from previous resistance (as support) and make a new high, the break out will be validated.
I will continue to monitor this chart, and will update this chart as it develops!
Let me know in the comments if you have any questions or thoughts as they pertain to this idea!
Cheers!
Key Levels and Market overview into the Asian session openA look at the price action from the European and US sessions and what that may mean for the Asian market open after PPI out in the US was stronger than expected adding fuel to the inflation fire. I feel data is still showing 'sticky inflation' which eventually leads to higher interest rates and lower spending which will cap the indexes. Intraday the US could not hold up off the lows and was hit hard into the close with potential to continue lower. I look at some key levels to watch and the price action setups I expect to play out.
Markets covered :-
DOW
Nasdaq
DAX
FTSE
ASX200
Hang Seng
USD Index
Gold
Oil
Copper

Key Levels and Market overview into the Asian session openA look at the price action from the European and US sessions and what that may mean for the Asian market open after some stronger than expected US retail Sales triggered a choppy session. I feel data is still showing 'sticky inflation' which eventually leads to higher interest rates and lower spending which will cap the indexes...although traders are focused on a resilient economy fending off a recession.. I look at some key levels to watch and the price action setups I expect to play out.
Markets covered :-
DOW
Nasdaq
DAX
FTSE
ASX200
Hang Seng
USD Index
Gold
Oil
Copper

Near term bullish setup in an overall topping process In this video I talk about my strategy going into the CPI report tomorrow. I highly doubt it would be a market mover, but if it does I'm going to be looking to see how it comes in tomorrow morning.
Disclaimer: The content of all videos produced by this channel are for educational purposes only. All ideas, opinions and/or forecasts are for informational purposes only and should not be construed as a recommendation to invest, trade, and/or speculate in the stock market. Any investments made in light of these ideas, opinions, and/or forecasts, expressed or implied herein, are committed at your own risk. I am not an investment advisor, videos are for educational purposes only and not a recommendation to buy or sell any stock, ETF or futures contract at any time. This channel and its publishers are not liable for any investment decisions made by its viewers or subscribers, all videos are for educational purposes only. The author of this video does express certain opinions in the contents of this video, but will not assume any responsibility for the actions of any viewer who acts on this educational information. The author of this video may or may not hold positions in the financial instruments discussed in this video.Trading involves a high level of risk. Future results can be dramatically different from the opinions expressed herein. Past performance does not guarantee future performance. Consult an investment professional before investing.

CRWD CrowdstrikeHoldings, Inc.
Better grab you ticket to the show on the right railway. Great job everyone, you should be proud of what you have accomplished!
Keep up the good work!!
=stikstockitslive
