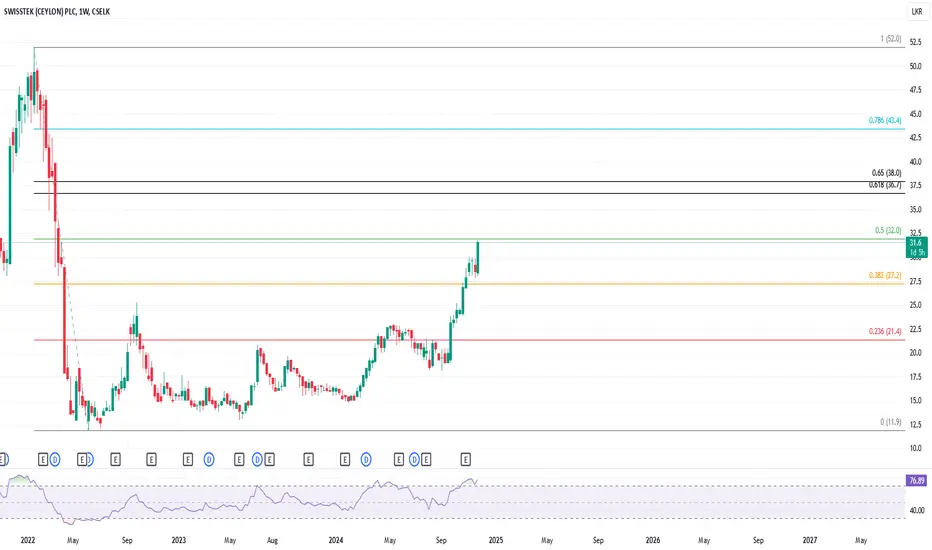
PARQ.N00001. Current Trend and Price Action
Uptrend: The stock is in a strong bullish trend, with consistent higher highs and higher lows evident in the weekly chart.
Key Resistance Levels:
The stock is approaching a critical resistance zone between 36.7 (0.618 Fibonacci level) and 38.0 (0.65 Fib level). These levels could act as barriers unless strong buying momentum continues.
Support Levels:
Immediate support is at 32.5 (0.5 Fibonacci level). If the stock pulls back, this level should act as a strong support zone.
Additional support lies at 27.2 (0.382 Fib level) if further corrections occur.
2. Fibonacci Analysis
The 0.618 (Golden Pocket) zone at 36.7 is a critical level to watch. If the stock breaks above this zone, it may head toward the 0.786 Fib level (~43.4).
All-Time High Target: The 1.0 Fibonacci level at 52.0 represents the potential all-time high target if the uptrend continues.
3. Indicators
RSI (Relative Strength Index):
The RSI is currently at 76.89, indicating that the stock is in the overbought region. This suggests a potential for a short-term pullback or consolidation before continuing the upward momentum.
Volume and Momentum:
The recent candles show strong bullish momentum, supported by rising volume. However, caution is needed as the price approaches the resistance levels.
4. Observations
Bullish Case: If PARQ breaks above 38.0, the next target would likely be 43.4, followed by 52.0 as the long-term target.
Bearish Case: Failure to break the 36.7 - 38.0 resistance zone could result in a pullback toward 32.5 or even 27.2.
Stockmarketanalysis
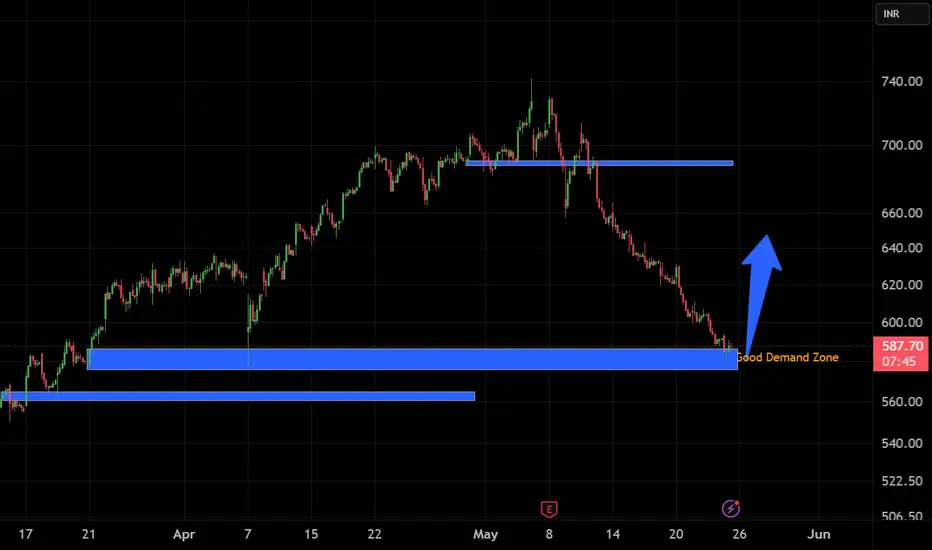
CHAMBLEFERT IDEAChamblfert looks like at a good demand zone. Expecting good one time bounce from this area and one green candle after long rail of back to back red candles.
Tesla - Don't get confused right here!Tesla - NASDAQ:TSLA - is about to create the bullish reversal:
(click chart above to see the in depth analysis👆🏻)
2025 has been a rough year for Tesla so far. With a drop of about -50%, Tesla is clearly breaking the average retail trader. But the underlying trend is still quite bullish and if position strategy, risk execution and mindset control are all mastered, Tesla is a quite rewarding stock.
Levels to watch: $275, $400
Keep your long term vision!
Philip (BasicTrading)

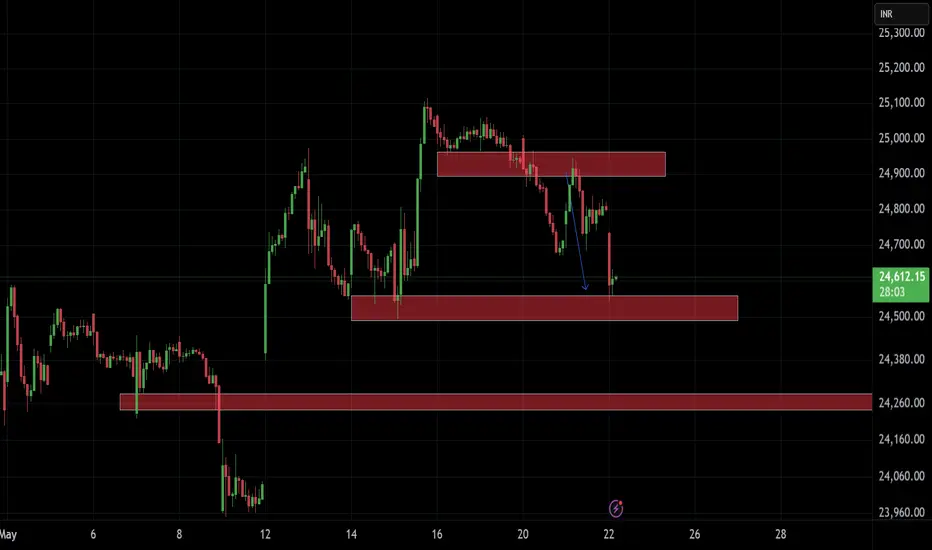
NIFTYI see these levels on Nifty. Forgot to paste the good shorting trade opportunity yesterday, however shared 2 charts with analysis of gift nifty which hinted short for market from past 2 days. Don't go into patterns and take early trades trade only when levels break or sustain.
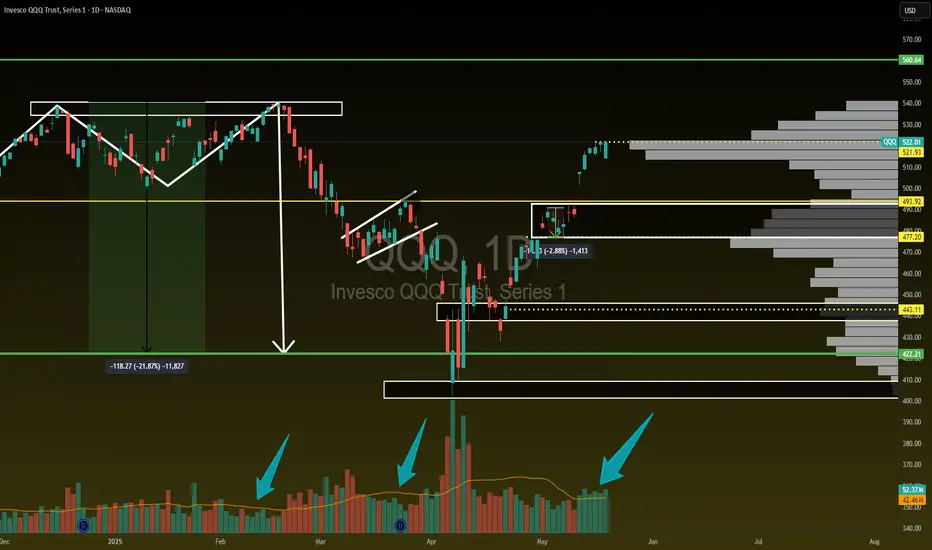
QQQ about to FLUSH?! Let's talk about it!I'm not saying it's over but you have to admit it does feel like we are going to see a decent size pullback...2-6% over the next few weeks on the NASDAQ:QQQ AMEX:SPY
- TVC:VIX back over 20
- US20Y hit 52 week high
- USDJPY starting to creep towards April lows
- $491.54 GAP to fill on NASDAQ:QQQ
- $447.58 Bigger GAP to fill on NASDAQ:QQQ
- Credit starting to become and issue
- Banks/ Credit companies tanked today
There is bullish pieces as well but we do look extended here and a healthy 2-6% would be welcomed...A break of $475 level spells trouble on QQQ.

NIFTY!Selling started at supply zone discussed in earlier chart analysis of gift nifty. Same has been applied to Nifty and overall market.
THIS TIME IT'S DIFFERENT!🔥 THIS TIME IT'S DIFFERENT! 🔥
Can you see the shift?! VOLUME IS HERE—AND IT'S MASSIVE. 💪💰
Unlike those weak, fleeting rallies that got crushed under waves of red, this one is packed with bullish buyers and offside hedge funds READY TO SEND IT HIGHER. 🚀📈
Not to mention the last time we had this level of above average volume for this long was in October 2023 when we were coming out of a bear market and it was only the beginning of our ascent higher!
I'm not saying we can't have a pullback soon...I'm just simply saying the volume is here and it looks like dips will indeed be shallow.
ATH retest INBOUND!
Are you positioned for the move? 👀
AMEX:SPY NASDAQ:QQQ
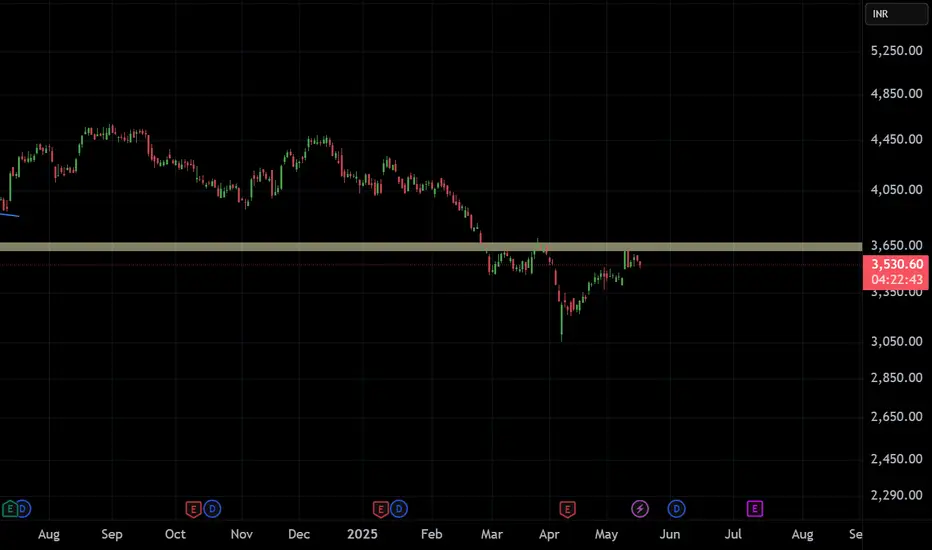
TCS EASY CHARTI think this is one of the most easy chart of a stock io know what is and will happen in the stock. I will be posting details of smaller levels on this stock.
Will the USD Bears come back? Stock Market just pulling back?In this video I go over the EUR/USD, GBP/USD and USD/JPY. Will the USD bears come pouring back in or give up the previous low on the EUR/USD...
Some markers I'm watching is a "hidden" divergence on the MACD and it's potential signal for continued bullish strength for the EUR/USD, especially with the U.S. credit rating getting lowered by Moodys.
I'm also watching for a potential reversal to the stock market's massive rally the last couple of weeks. Is this a true reversal or just a major pullback in the grand scheme of things? The last 2 weeks of May will be interesting to watch develop.
As always, Good Luck & Trade Safe.

S&P500 - The bottom we have been waiting for!The S&P500 - TVC:SPX - officially created the bottom:
(click chart above to see the in depth analysis👆🏻)
This month we officially saw one of the craziest stock market fakeouts of the past decade. With a drop and reversal rally of about +15%, the S&P500 is about to even close with a green monthly candle, which then indicates that the stock market bottom was created.
Levels to watch: $120, $250
Keep your long term vision!
Philip (BasicTrading)

Amazon - Look At This All Time High Retest!Amazon ( NASDAQ:AMZN ) will create the bottom soon:
Click chart above to see the detailed analysis👆🏻
The trend on Amazon is clearly towards the upside and the recent correction of about -30% did not change that at all. Rather, we are now witnessing an extremely bullish all time high break and retest and therefore, if Amazon actually creates bullish confirmation, this could form a bottom.
Levels to watch: $180
Keep your long term vision,
Philip (BasicTrading)

Alibaba - This Chart Speaks In Money!Alibaba ( NYSE:BABA ) prepares for a significant pump:
Click chart above to see the detailed analysis👆🏻
Basically since Alibaba was listed on the NYSE, it always perfectly respected market structure. With the recent rejection away from the key neckline, Alibaba is now creating a bullish break and retest. After bullish confirmation, this forms a bottom and we might see new all time highs.
Levels to watch: $110, $140
Keep your long term vision,
Philip (BasicTrading)

Nasdaq - Printing The Obvious Bottom!Nasdaq ( TVC:NDQ ) already finished the correction:
Click chart above to see the detailed analysis👆🏻
After we witnessed a minor "crash" of about -25% over the past couple of weeks, the bottom might be in on the Nasdaq. We simply saw another very bullish all time high break and retest and depite the possibility of a second retest, I am (still) extremely bullish at these levels.
Levels to watch: $17.000
Keep your long term vision,
Philip (BasicTrading)

Micron Technology - The Chart Is Still Perfect!Micron Technology ( NASDAQ:MU ) will reverse right here:
Click chart above to see the detailed analysis👆🏻
If you actually want to explain technical analysis to somebody, just show them the chart of Micron Technology. Almost every structure makes perfect sense, with this stock respecting all major trendlines and horizontal levels and with the current support area, the bottom is now in.
Levels to watch: $70, $210
Keep your long term vision,
Philip (BasicTrading)

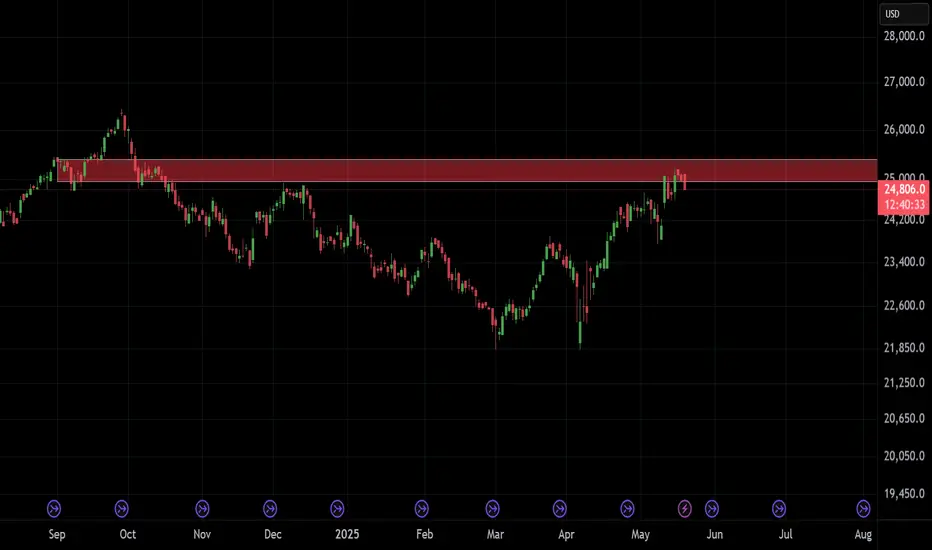
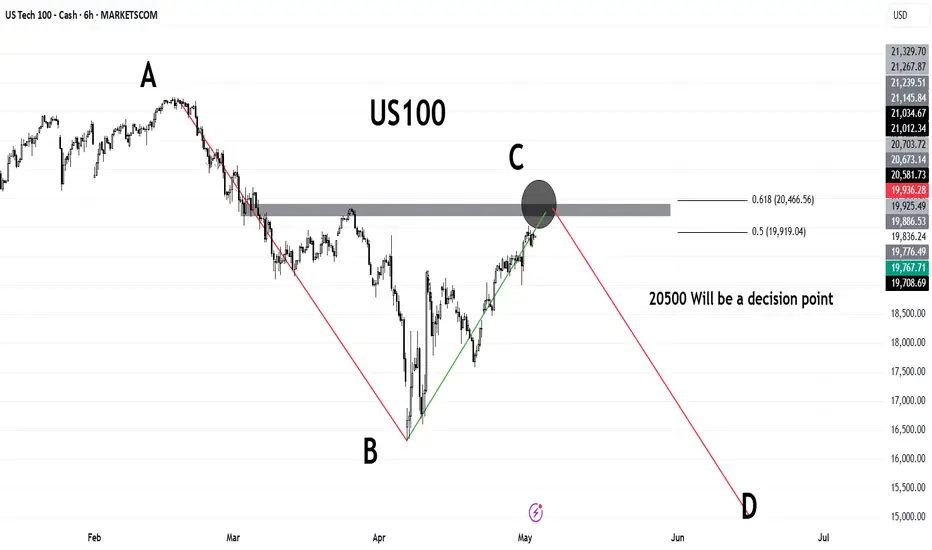
US100US100 has shown great strength after terrif news.
If we look at the bigger picture, recent bullish rally looks like a pull back. Currently it is heading towards very important region , 20500 which is also the 61% retracement level.
If the price close above 20500 then we can consider it a new bullish rally.
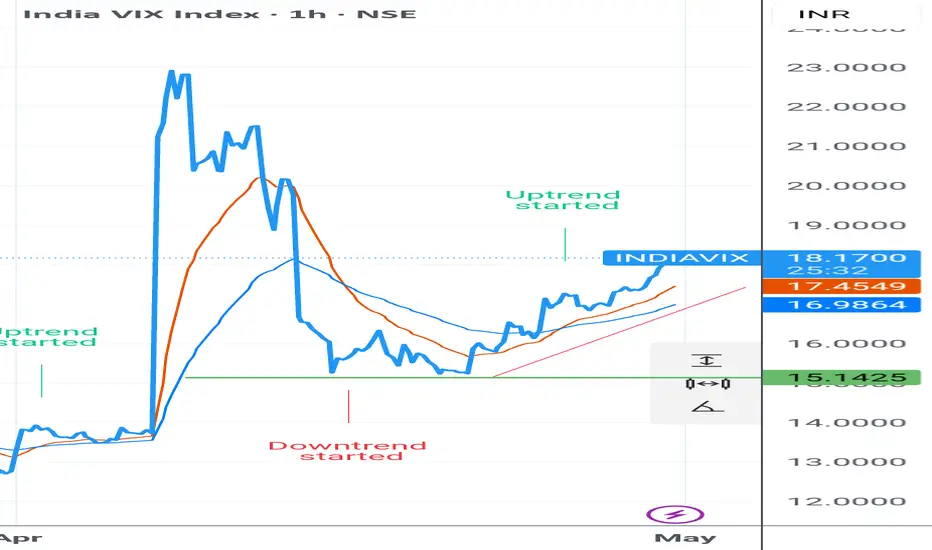
IS STOCK MARKET BIG FALL COMING ?Nifty bottom out 22000, We enjoyed almost 2500 rally, in spite of this, INDIA VIX the indicator of Fear & volatility didn't fall below 15 level and made double bottom . It support here two times on 16 April & 22 April And raised 15% till now currently traded above 18.50 level.
Does it make sense that market shoot up and india vix Rising ?
It has become solved all issue ?
Us china terrif tension has became over ?
Is it Consumption increasing in india ? So why Fmcg sector underperform ?
Would it be any impact coming of India Pak war situation ?
I don't know what will be in future but rising india vix clearly saying that Market going toward FEAR zone. So just be cautious & avoid to open Naked position.
#Nifty 30th April levels checkout is levels #Nifty 30th April levels checkout special my levels
100 percent working levels and giving weekly levels also
check and tell everyone
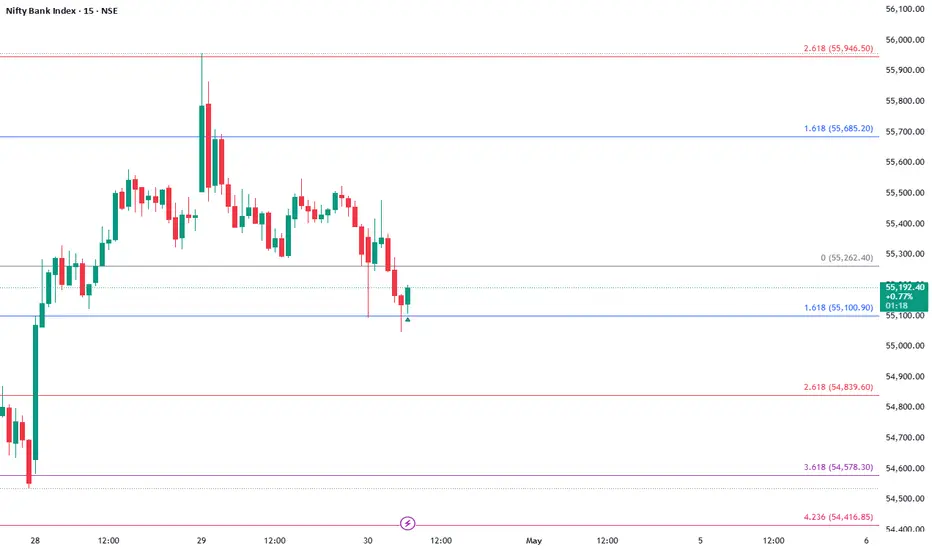
#BankNifty 30th April levels checkout is my levels #BankNifty 30th April levels checkout is my levels
weekly levels my special..
catch and read trading tools channel
Bull in a China Shop. The S&P 500 Index After 100 Days of TrumpPresident Donald Trump's first 100 days in office were the worst for the stock market in any postwar four-year U.S. presidential cycle since the 1970s.
The S&P 500's 7.9% drop from Trump's inauguration on Jan. 20 to the close on April 25 is the second-worst first 100 days since President Richard Nixon's second term.
Nixon, after taking office as President of the United States (for the second time) on January 20, 1973, witnessed the S&P 500 index fall by 9.9% in his first 100 days in office, due to the unsuccessful economic measures he took to combat inflation, which led to the recession of 1973-1975 when the S&P 500 index losses of nearly to 50 percent.
It all started in January 1973 in the best soap opera traditions of Wall Street, at the historical peaks of the S&P 500 index..
..But less than two years later it quickly grew into a Western with a good dose of Horror, because the scenario of a 2-fold reduction of the S&P 500 index was unheard those times for financial tycoons and ordinary onlookers on the street, since the Great Depression of the 1930s, that is, for the entire post-war time span since World War II ended, or almost for forty years.
Nixon later resigned in 1974 amid the Watergate scandal.
On average, the S&P 500 rises 2.1% in the first 100 days of any president's term, according to CFRA, based on data from election years 1944 through 2020.
The severity of the stock market slide early in Trump's presidency stands in stark contrast to the initial "The Future is Bright as Never" euphoria following his election victory in November, when the S&P 500 jumped to all-time highs on the belief that Mr. Trump would shake off the clouds, end the war in Ukraine overnight, and deliver long-awaited tax cuts and deregulation.
Growth slowed and then, alas, plummeted as Trump used his first days in office to push other campaign promises that investors took less seriously, notably an aggressive approach to trade that many fear will fuel inflation and push the U.S. into recession.
The S&P 500 fell sharply in April, losing 10% in just two days and briefly entering a bear market after Trump announced “reciprocal” tariffs, amid a national emergency that gave him free rein to push through tariffs without congressional oversight.
Then Trump began yanking the tariff switch back and forth, reversing part of that tariff decision and giving countries a 90-day window to renegotiate, calming some investor fears.
Many fear more downside is ahead.
Everyone is looking for a bottom. But it could just be a bear market rally, a short-term bounce of sorts.
And it's not certain that we're out of the woods yet, given the lack of clarity and ongoing uncertainty in Washington.
Time will tell only...
--
Best 'China shop' wishes,
@PandorraResearch Team

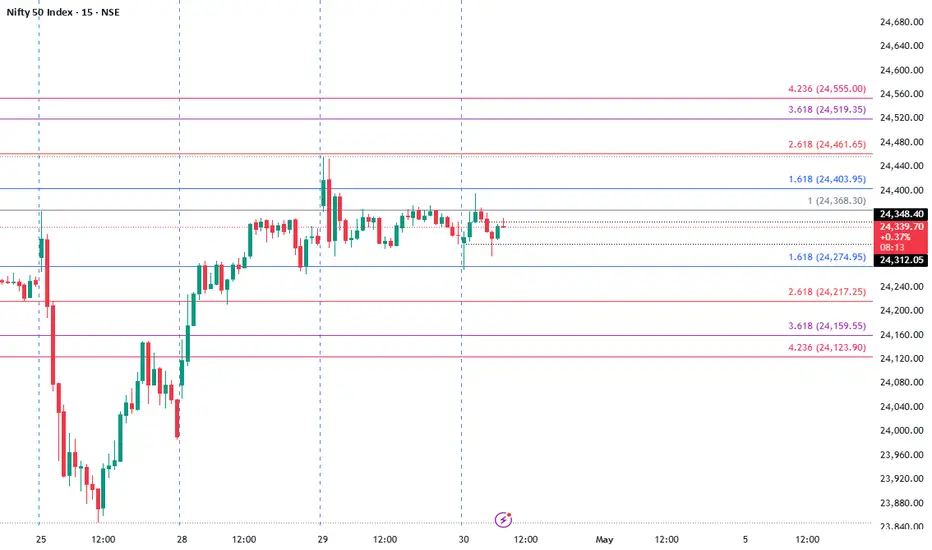
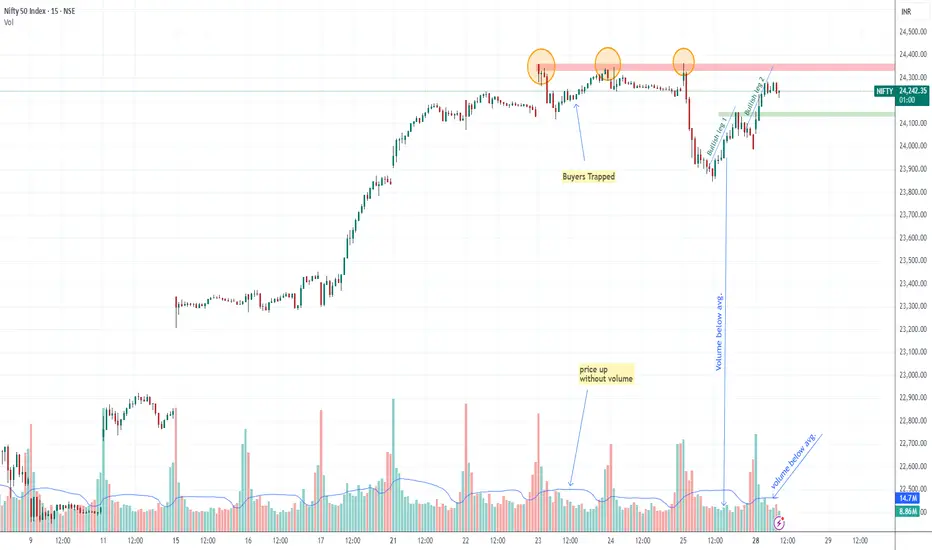
let it be cross & sustained above 24350 leveltoday 28 April market showing strengths after little correction on Friday, yeah ofc market mode is still bullish but see BULLISH LEG 1 mention on chart below avg. traded volume not supporting price same Today BULLISH LEG 2 also have below avg. volume noticed, same you can noticed on 23 April when market was going up below avg. volume before falling , so if nifty really bullish pls let it be cross and sustained above 24350 level
GOLD Follows "Buy The Dip" Mode, Being Supported by 200-hour SMAGold prices have experienced significant volatility over the last days, with conflicting reports on the current trend. According to some sources, gold prices have increased, with spot gold reaching $3,500 per troy ounce, new all the history high on Tuesday, April 22, 2025.
The $3,500 milestone has sparked increased interest from investors and market analysts, meaning that Gold spot doubled in price over the past 5 years, 3rd time in history ever.
Despite the short-term volatility, gold has shown a strong performance since the beginning of 2025, with an increase of approximately 30-35% year-to-date. Market analysts remain bullish on gold, with some forecasting prices to reach $ 4'000 per ounce in the near term.
The main 1-hour graph indicates on 200-hours SMA technical support, with further upside opportunity due to forming on the chart descending triangle (flat bottom/ descending top) breakthrow.
--
Best #GODL wishes,
Your Beloved @PandorraResearch Team 😎

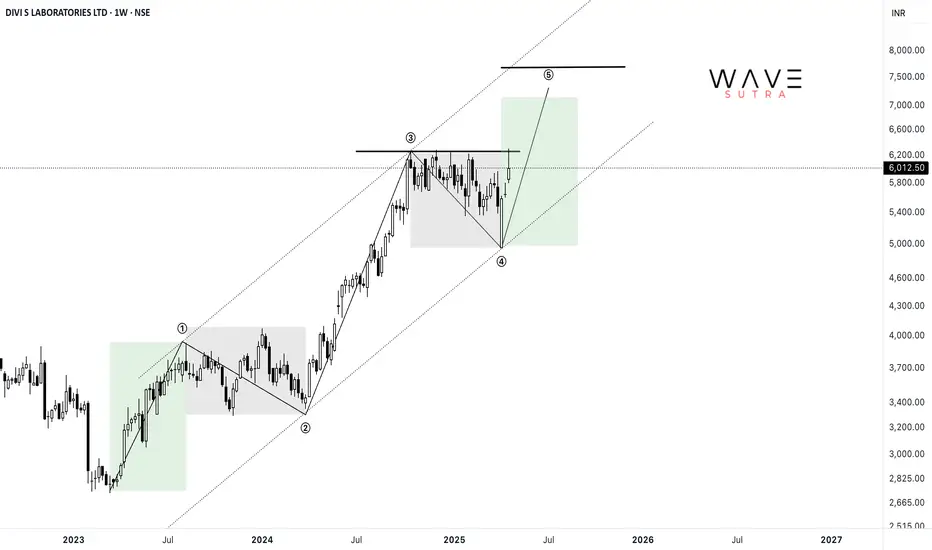
DIVISLAB: Impulse formationStock is rising in an impulsive manner and currently started it's 5th wave which shall take the prices towards 7000/7600 zone in the coming weeks. On the downside key level is 5400. One should remain bullish as long as prices are trading above this level.
MFSL: Cup & HandleStock has given a breakout of Cup & Handle pattern and retested the neckline in Jan'25. The measured target for the same is coming in the region of 1900. On the downside the key level can be 1080.
