Buy CTRA in US stock market 10/8/2022You can buy it Target 30.85 and 33.5 stop loss 24.99 money management is your responsibility . good luck
Stockmarketanalysis

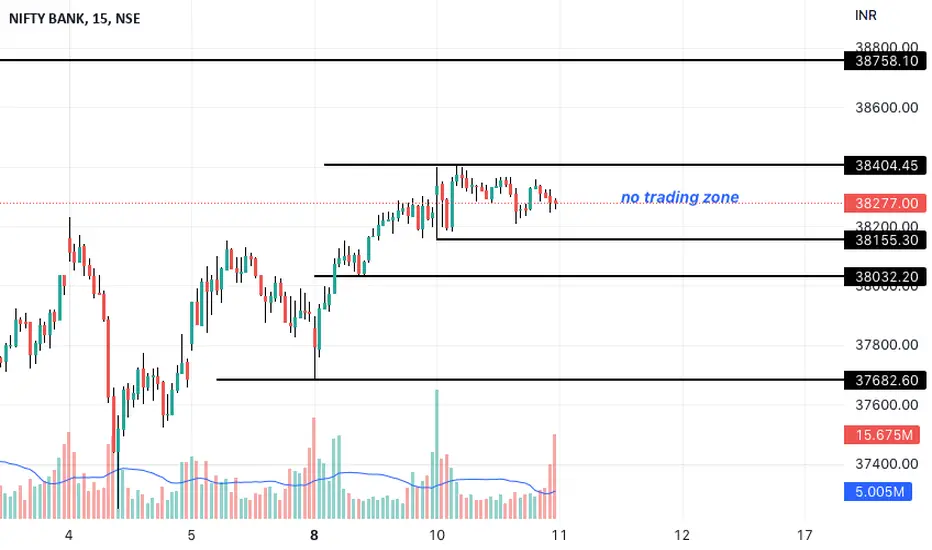
This is Beautiful.. major levels marked.my bias is still bearish. coming this night us info data and guess whate we have a doji on daily time frame which I probably think will turn into evening star by tommorrow. so I will only trade the short position tomorrow if market went up I wont doing any trading tomorrow.
theres a chance we may have a trending and much volatile market tomorrow so dont forget to maintain your RRR traders.
BEST OF LUCK TRADERS.
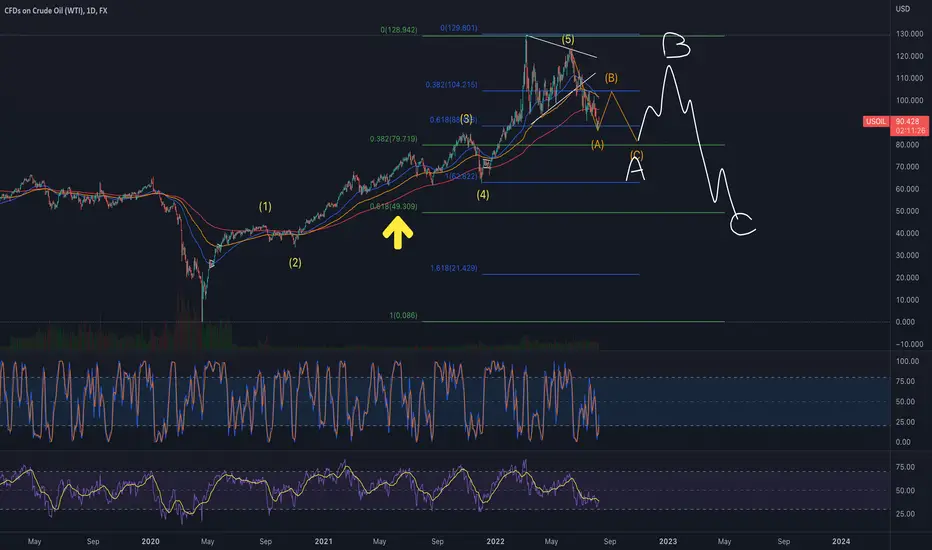
WTIOil in a bit of trouble here, likely entering a 6-10 month bear market correction. Downside target can hit the 618% of the entire 5 moves off the 2020 lows when WTI went negative.
Currently a lower time frame A wave has bounced off the 618% fib retracement level of the 5th wave. But we must correct that entire 5 up not just the 5th wave. We should bounce into a B wave soon on the daily
before making the larger C wave down close to $80. After that The HTF weekly A wave is complete and bounce again into HTF weekly B wave before finally nuking to $50 wave C to complete the entire move. You better BTFD IMHO guys because after this is done oil prices likely to run back turbo over $130.
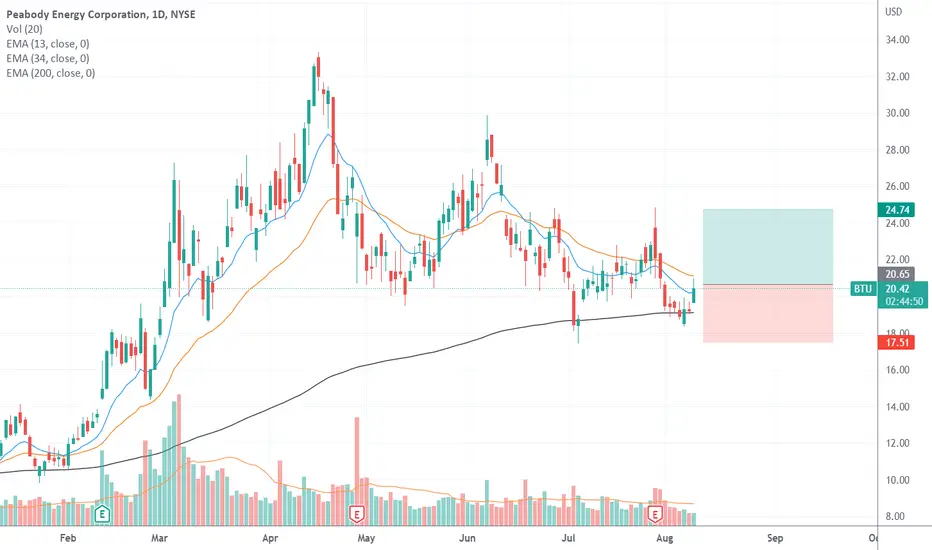
Buy BTU in US stock market 9/8/2022You can buy it Target 22 and 24.74 stop loss 17.5 money management is your responsibility . good luck
SPX Daily TA Neutral BearishSPXUSD Daily neutral with a bearish bias. Recommended ratio: 40% SPX, 60% Cash . * CRITICAL RESISTANCE WATCH . Equities finished the session relatively flat as markets are sending mixed signals ahead of CPI and PPI data on 08/10 and 08/11. Crypto, Gold, VIX and Oil are trending higher while DXY and Treasuries are down. Palantir reported an earnings miss and revenue beat and forecasted weaker revenue guidance for the second half of 2022; this likely isn't a market moving event but is important because it not only reflects a slowdown in growth stock interest but it hints at a slowdown in economic activity ( due to their significant number of government contract delays ). Key dates this week: COIN earnings 08/09; 4th US Q3 GDP estimate at 10am (EST) 08/10 ; CPI at 830am (EST) 08/10 ; Disney earnings 08/10; and PPI at 830am (EST) 08/11 .* Price continues to retest $4175 major resistance and briefly broke above it in today's session. Volume remains Moderate and fairly balanced between buyers and sellers reaffirming that Price is trading at a critical resistance. Parabolic SAR flips bearish at $4060, this margin is mildly bearish. RSI is currently trending down slightly at 63 after peaking at 66, it is also exhibiting minor Bearish Divergence; the next resistance is at 68 and next support at 53. Stochastic is currently crossing over bearish at 92 as it continues to trend sideways in the 'bullish autobahn'; the next support is at 76. MACD is currently beginning to form a soft peak at 68 and is still technically testing 55 minor resistance. ADX is currently trending up at 22.50 as Price continues its attempt to break above $4175, this is mildly bullish. If Price is able to bounce here then it will need to close above $4175 major resistance for two consecutive sessions in order to flip it to support; only after this will it be able to retest the upper trendline of the descending channel from November 2021 at ~$4300 as resistance . However, if Price breaks down here, it will likely retest $4100 before potentially retesting the uptrend line from 06/16/22 at $4k psychological support . Mental Stop Loss: (two consecutive closes above) $4175 .

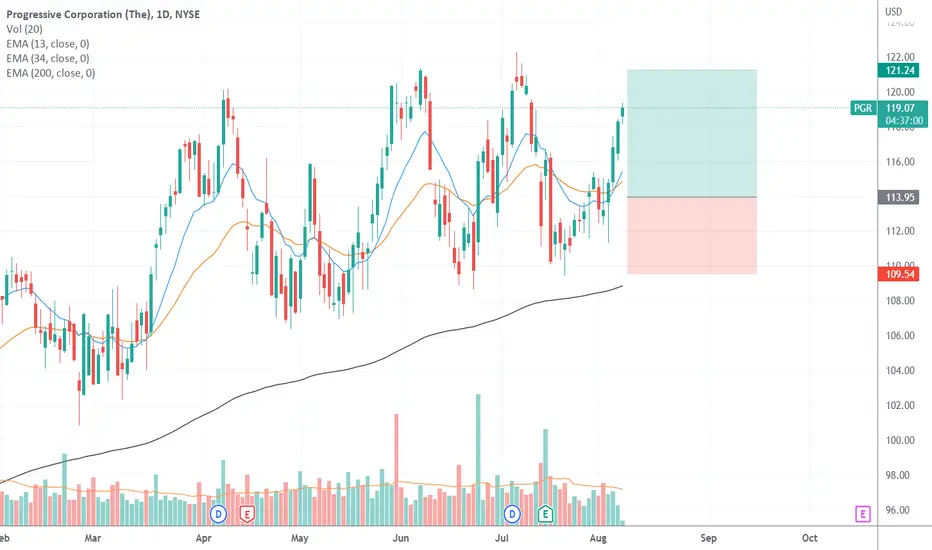
The deal closed PGR in US stock market with profitAlhamdulillah , The deal was closed on PGR in US stock market with a profit of 4.69 % in a 4 days . I wish good luck to everybody.
Buy CALM in US stock market 4/8/2022You can buy it Target 56.39 stop loss 49.49 money management is your responsibility . good luck

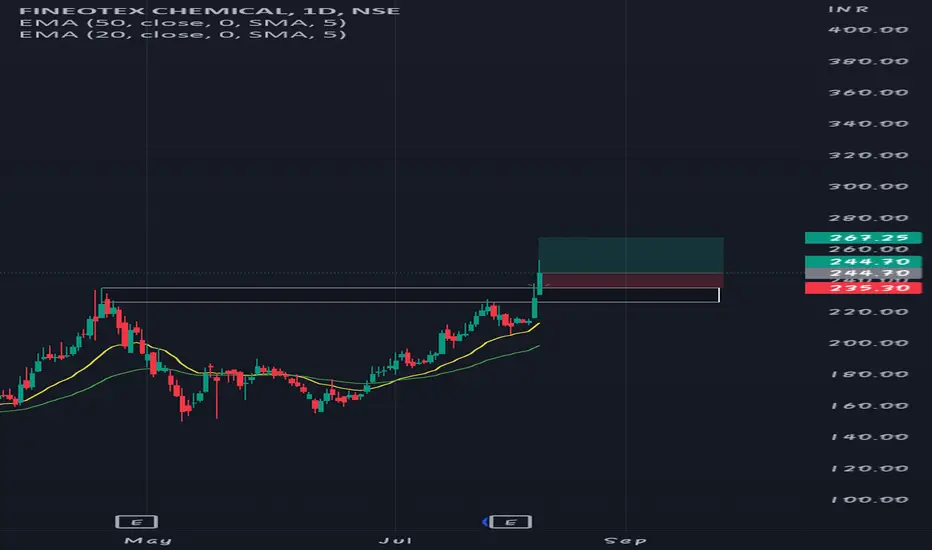
FINEOTAX CHEMICALS is in great UPTREND hey guys ,
FINEOTAX CHEMICAL stock is in great uptrend
this stock has recently crossed it's ALL TIME HIGH
and given a great green candle .
Also the VOLUME is also very high .
The 20 day ema is above the 50 day ema ,
and this stock is very away from 200 day ema
in a UPWARD direction.
i have marked the RR RATIO for you
try to trade according to that.
FINEOTAX CHEMICALS 😀😀
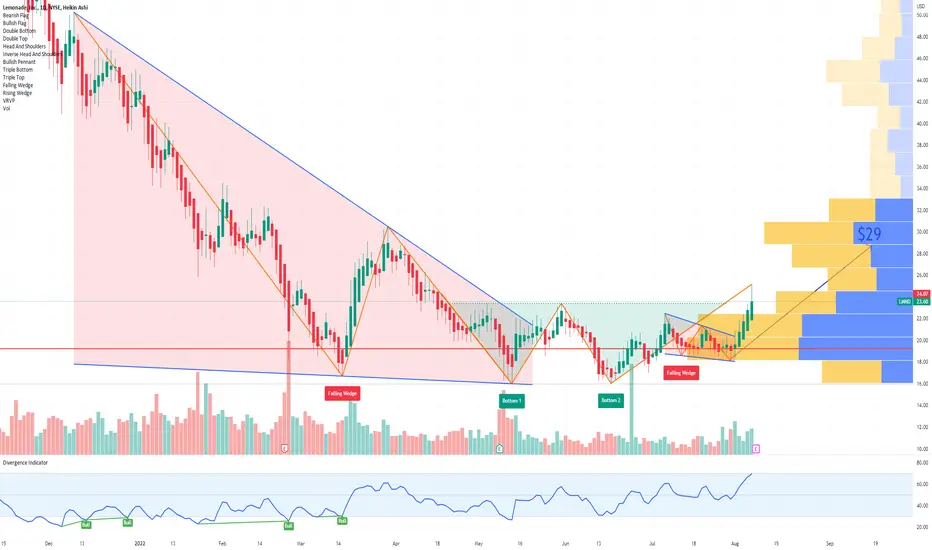
LMND Lemonade Options Ahead Of EarningsLooking at the LMND Lemonade options chain, i would buy the $29 strike price calls with
2022-9-16 expiration date for about
$1.25 premium.
Looking forward to read your opinion about it.

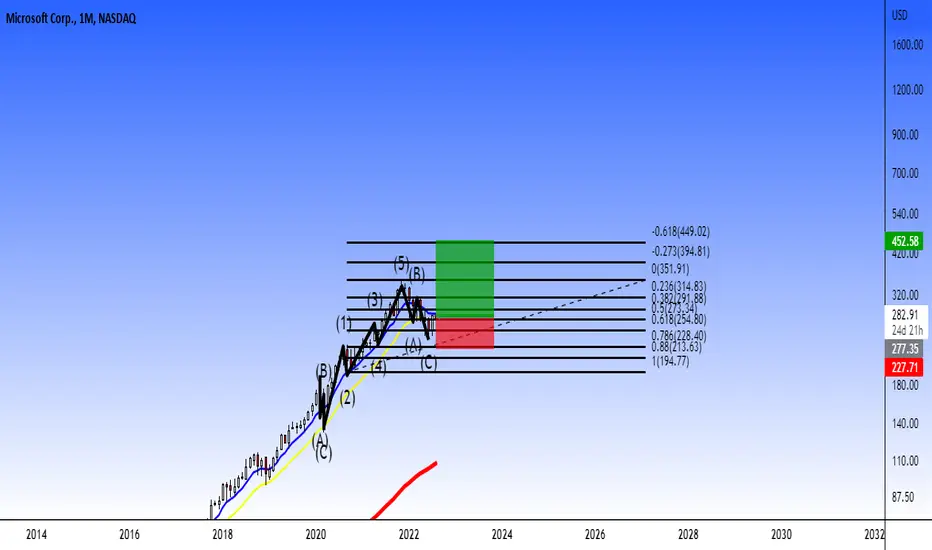
MSFT: Investment in stock marketI decide to make an investment in Microsoft stock because it's look bullish from this monthly timeframe. But when we invest in stock, it's very important to read ever fundamental analysis to know what affect the price of a stock. I will trade when market open at Monday, August, 8, 2022. Bought in the market price and my SL will be around $228 USD, and we could to have 2 targets.
One of the best strategy to accumulate money and investing in stock market it's find up 100% of the investent to double x2 yearly. But one of the best it's using asset like Bitcoin, Ethereum, Cardano to accumulate to use one of them using a good crypto-broker like Simple FX, Also, 200% yearly it's a good way, but combining to trade financial market and find up the yearly goal.
I hope that this analysis support you!!!
2008 vs 2022 I found a lot of similarity's between this crash and the 2008 financial crisis stock market crash.
Quick TA summary:
1. We have the same kind of downwards parallel channel
2. The chart of the 2022 crash so far fits pretty well into the 2008 crash, the chart of the 2008 crash fits pretty well into today's chart.
Quick Fundamental summary:
There are so many reasons why the economy could have a meltdown. I wrote about it last year in November in my previous post, but there are other things to talk about now:
1. The FED changing the definition of a recession. The US GDP came in at -0.9% for Q2, which is the second consecutive quarter in a row that the FED published negative GDP growth. Here is how we actually define a recession, like we have always done: "Experts declare a recession when a nation’s economy experiences negative gross domestic product (GDP), rising levels of unemployment, falling retail sales, and contracting measures of income and manufacturing for an extended period of time. Recessions are considered an unavoidable part of the business cycle—or the regular cadence of expansion and contraction that occurs in a nation’s economy". I mean come on guys, these terms/indicators exists so that governments and central banks can change their policy's on time. But instead of actually changing their policy to a recession policy, they simply deny the recession and even try to change the definition of it. We have heard the "this time is different" enough times and it has so far always lead to real problems. This has to do with the fact that there are going to be new elections soon, so denying the recession is a convenient thing for them to do.
2. The biggest drop in Average and Median New US Home prices since 2008.
April Median: $457,000 and June Median: $402,400 this is a decline of 11.95% in the past 2 months.
April Average: $569,300 and June Average: $456,800 this is a decline of 19,76% in the past 2 months.
3. 40% of Americans Are Struggling to Pay Their Bills Right Now.
"More Americans are struggling to pay their bills now more than any other time in 2022 — and possibly even since the pandemic began.For more than 91 million U.S. adults, affording typical household expenses is “somewhat difficult” or “very difficult,” according to data released this week by the Census Bureau.
That accounts for 40% of the Americans who responded to the bureau's survey between June 29 and July 11. (If you include folks who took the survey but did not respond to that particular question, the portion is 36%.)"
4. Unfortunately inflation is not coming down, even though the FED is raising it's interest rates pretty aggressively. They told us that inflation was going to be temporary, but it wasn't. They have clearly underestimated the situation.
5. 80% of all US dollars in existence were printed in the last 22 months (from $4 trillion in January 2020 to $20 trillion in October 2021 (honestly what were they thinking, this isn't monopoly guys...)
6. US OIL en UK OIL have both dropped below $100. Every time this has happened we have gone into a recession, and most of the time the stock market had pretty significant losses.
Gasoline prices are still abnormally high, as you noticed when you are refilling your car with fuel.
7. A lot of company's have been beating their EPS lately. However the expectations for EPS are like half of what the company's had been reporting from 6 to 9 months ago.
8. We are heading into September next month, which is statistically the worst month for stocks. The biggest crashes have happened in November. PE ratio's are still high so they have to come down.
As of 4:00pm EDT Fri Aug 5, The current Shiller PE Ratio is 31.10.
Mean: 16.96
Median: 15.88
As you can see we still have a long way down to go...
9. Food shortages for the following products:
(1). Chickpeas
2. Wheat
3. Sugar
4. Avocados
5. Paper Goods
6. Canned Goods
7. Eggs and Meat
8. Pet Food
9. Baby Formula
10. Liquor
Why Are These Items in Short Supply?
"It’s because of labor shortages and supply-chain issues, from food manufacturers to grocery stores. There simply aren’t enough people to “make the goods, move the goods and sell the goods,” says Jim Dudlicek, a representative for the National Grocers Association. According to Parade, the recent invasion of Ukraine by Russia plays a role, with supply chains from Europe heavily disrupted. Labor shortages also continue, with people still out due to COVID-19 or resigning due to low wages and poor work conditions.
In addition, supply is affected by more people cooking and eating at home, a trend that started at the onset of the pandemic. “Demand has been very, very high,” Denis says. Still, she doesn’t think there’s a reason for people to stockpile. She pointed to lumber as an example of a product that was extremely hard to get for a while, but has become more plentiful in recent months, and the food supply chain likely will rebound in a similar fashion, although it may take time."
10. Micheal Burry wrote: "Dead cat bounces are the most epic.
12 of the top 20 nasdaq 1-day rallies have happened during the 78% drop from 2000's top.
9 of the top 20 S&P500 1-day rallies happened during the 86% drop from the 1929 top.
Micheal Burry also wrote:
RE: paradigm shifts/speculative peaks, the SP500 bottomed 13% lower than 2002's bottom in 2009,
17% lower than 1998's LTCM crisis low in 2002, and 10% lower than 1970's low in 1975.
15% lower than the COVID low is SPX at $1862. - Shiller PE of 16, nominal PE of 9. In historic range.

SPX Daily TA Neutral BearishSPXUSD Daily neutral with a bearish bias. Recommended ratio: 45% SPX, 55% Cash. * JOBS REPORT WATCH . The Employment Situation is released tomorrow (08/05) at 830am (EST) and markets seem to be rallying as if unemployment is going to stay flat or go up insignificantly. If this scenario plays out, it will be interesting considering labor force participation continues to trend down from March , weekly jobless claims went up , there's been a notable increase in layoffs over the past few months and many corporations announced they are going to slow hiring through the end of the year. Equities continue their rally with the S&P posting its biggest bounce of the year (13%) since its June 16th low, reflecting that consumer sentiment regarding inflation, supply chains, FFR and Russia/China is very optimistic heading into 2023. Yesterday, OPEC+ agreed to raise output by 100,000bpd starting in September, compared to the ~600,000bpd increases in July and August this sent the price of Oil back up heading into September; which is likely to result in more inflationary pains for consumers. Taiwanese news agencies have reported that China has been conducting the closest military drills yet and have launched a record number of cyberattacks at Taiwan since Pelosi's visit . Blackrock will be offering crypto to their ~200 institutional investors through Coinbase Prime and Coinbase partnered with Meta to allow for NFTs to be shared on Instagram from Coinbase Wallet ; both of these reports sent COIN up 45% in today's session and probably made Cathie Wood shite her pant$ after selling 1.133m shares at ~$55 last week (Price is currently ~$88). The Atlanta Fed released their third Q3 GDP estimate and it came in higher than the last going from 1.3% to 1.4%. Apparently today the White House joined the WHO in labeling Monkeypox a public health emergency . Key dates: July Jobs Report at 830am (EST) 08/05; July CPI at 830am (EST) 08/10; 4th Atlanta Fed Q3 GDP Estimate 08/10; July PPI at 830am (EST) 08/11.* Price is currently testing $4175 resistance as it awaits the Jobs Report tomorrow morning. Volume remains Moderate (high) and has favored sellers in two of the past three sessions, indicating that $4175 resistance is seeing quite a bit of selling pressure. Parabolic SAR flips bearish at ~$4k (-3% from current Price), this margin is mildly bearish. RSI is trending down slightly at 65 after forming a peak at 66, this is currently exhibiting mild Bearish Divergence from Price; a potential Double Top formation is also forming just below 68 resistance which is something to watch for. Stochastic remains bearish but is currently attempting to cross over bullish at 93; the next support is at 76. MACD remains bullish for the 41st consecutive session and is currently trending up at 65 with no signs of peak formation; it is still technically testing 55 minor resistance. ADX is currently trending up at 22 as price pushes higher, this is mildly bullish. If Price is able to break above $4175 resistance then it will likely retest the 200 MA + the upper trendline of the descending channel from November 2021 at ~$4300 . However, if Price is rejected here, it will likely retest $4100 before potentially retesting the uptrend line from 06/16/22 at $4k psychological support . Mental Stop Loss: (two consecutive closes above) $4175.

The deal closed ELA in US stock market with profitAlhamdulillah , The deal was closed on ELA in US stock market with a profit of 13.45 % in a 2 days . I wish good luck to everybody.

Buy WRB in US stock market 4/8/2022You can buy it Target 64.79 and 68.36 stop loss 59.8 money management is your responsibility I recommend entering a maximum of 10% of the portfolio. good luck

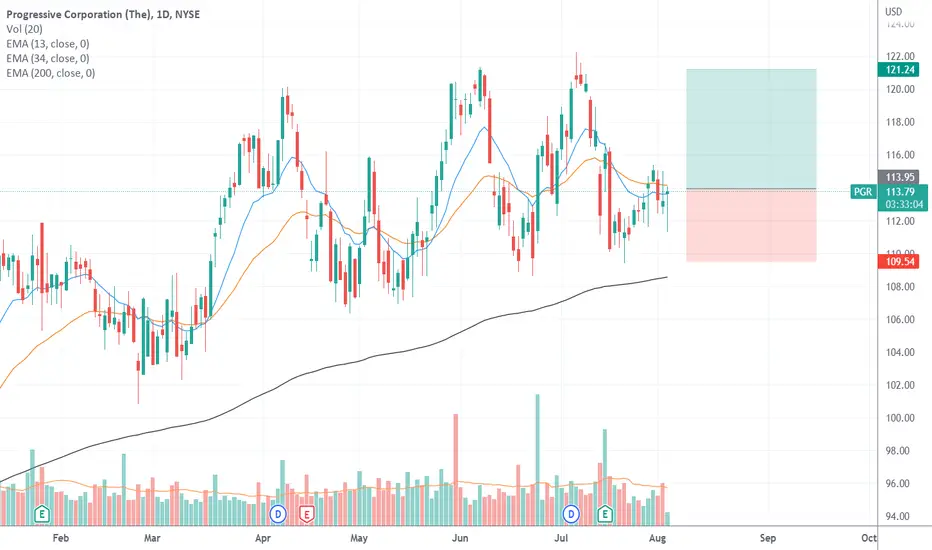
Buy PGR in US stock market 3/8/2022You can buy it Target 121.24 stop loss 109.54 money management is your responsibility I recommend entering a maximum of 10% of the portfolio. good luck