PROP - Riding the Cycle? The Next Wave May Just Be Starting!Markets move in cycles; and PROP is no exception.
If you’ve been following our previous analyses, you’ll recognize the accumulation zone we highlighted earlier. Well, this updated chart adds another layer: the cyclical rhythm of price action.
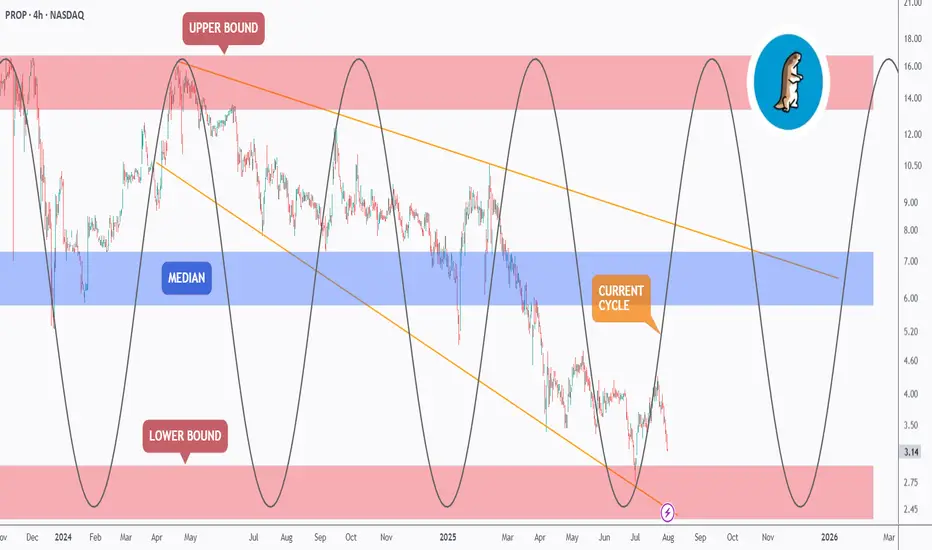
🔁As shown, PROP has been moving in clearly defined waves, bouncing between key zones with consistency. The current cycle appears to have bottomed — once again — inside the lower bound, where strong demand continues to hold.
We’re now in the early phase of what could be a fresh bullish cycle. If the rhythm plays out as before, the path of least resistance could take us toward the median zone ($6.5 - $7.5) and possibly all the way back to the upper bound ($15 - $17) by late 2025 or early 2026.
🔍 Supporting Fundamentals
While the chart speaks volumes, the fundamentals back it up:
Energy demand is surging globally, fueled by AI, data centers, and electric infrastructure — all of which require massive power capacity.
Oil and gas remain essential in this transition phase, especially with renewable infrastructure still years away from matching base-load demand.
PROP (Prairie Operating Co.) controls 65,000 acres in the DJ Basin — one of the most productive oil regions in the U.S. With advanced drilling tech and low-cost operations, PROP is well-positioned to ride out volatility and capitalize on rising demand.
🎯 Key Zones to Watch
- Support: $2.5–$3
- Median target: $6.5–$7.5
- Macro resistance: $15–$17
📌 We’re not just seeing structure — we’re seeing rhythm, confluence, and timing align.
If this cycle continues to play out, PROP might just be preparing for its next major wave.
Are you ready to catch it?
🧠 Previous posts and technical breakdowns are attached for full context.
➡️ As always, speak with your financial advisor and do your own research before making any investment decisions.
📚 Always follow your trading plan => including entry, risk management, and trade execution.
Good luck!
All strategies are good, if managed properly.
~ Richard Nasr
Stocks
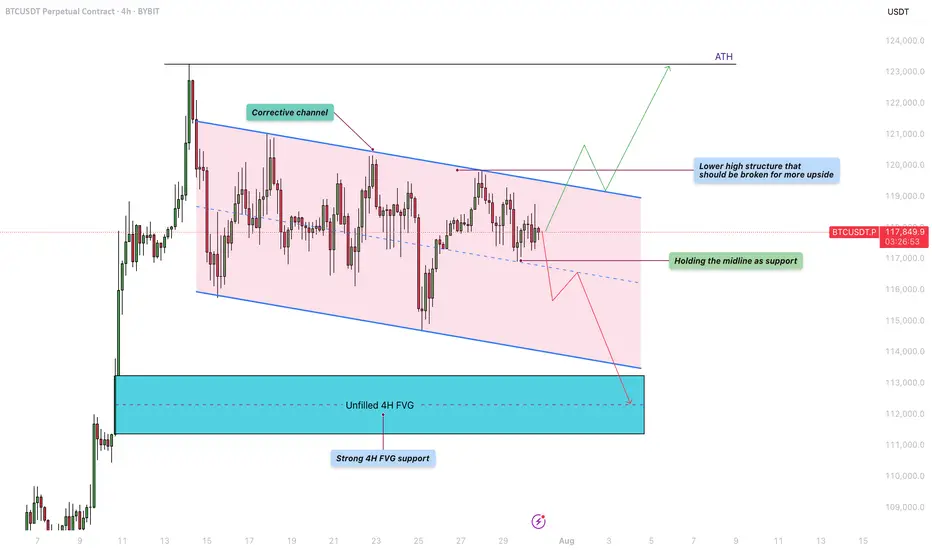
Bitcoin - Will the liquidity at $122K be the next target?Bitcoin is currently trading within a defined corrective channel, which has been developing over the past few weeks. Price action within this structure has been characterized by a sequence of lower highs and lower lows, suggesting a mild downtrend. However, these movements lack strong momentum, indicating that the market is consolidating rather than entering a deeper correction. This kind of structure often precedes a significant breakout, and given the nature of the current price action, a retest of previous highs remains a realistic possibility.
Bullish Scenario
Looking at the overall structure of the channel, a bullish breakout seems increasingly likely. For this scenario to unfold, BTC needs to hold the midline of the channel as support. If this level is respected, it could pave the way for a push towards the upper boundary of the channel and a potential break above the lower high structure near $120,000. A successful breach of that level could trigger a move toward the $122,000 liquidity zone, with the potential to challenge the all-time high (ATH) in the near future. Holding the midline and breaking above key resistance would provide confirmation of strength and continuation to the upside.
Bearish Scenario
On the flip side, if BTC fails to hold the midline as support and starts closing below it on the 4H timeframe, we could see a renewed move toward the lower boundary of the corrective channel. This could lead to a test of the unfilled 4H fair value gap (FVG) highlighted in the chart, located around the $112,000 – $113,000 area. This zone also coincides with a strong historical support level, making it a logical area where buyers might step in and provide the momentum needed for a more sustainable bullish reversal.
Final Thoughts
While both scenarios remain valid, the price structure within the corrective channel currently leans slightly more toward a bullish outcome. The lack of aggressive selling and the potential for liquidity above the previous highs support this view. However, trading is never about certainty but about preparing for various possibilities. Being aware of both bullish and bearish setups allows traders to react with flexibility and discipline depending on how the market unfolds in the coming sessions.
-------------------------
Thanks for your support. If you enjoyed this analysis, make sure to follow me so you don't miss the next one. And if you found it helpful, feel free to drop a like 👍 and leave a comment 💬, I’d love to hear your thoughts!
S&P 500 ETF & Index– Technicals Hint at a Possible Correction📉📊 S&P 500 ETF & Index at Resistance – Technicals Hint at a Possible Correction 🔍⚠️
Everything here is pure technicals— but sometimes, the market whispers loud and clear if you know how to listen. 🧠📐
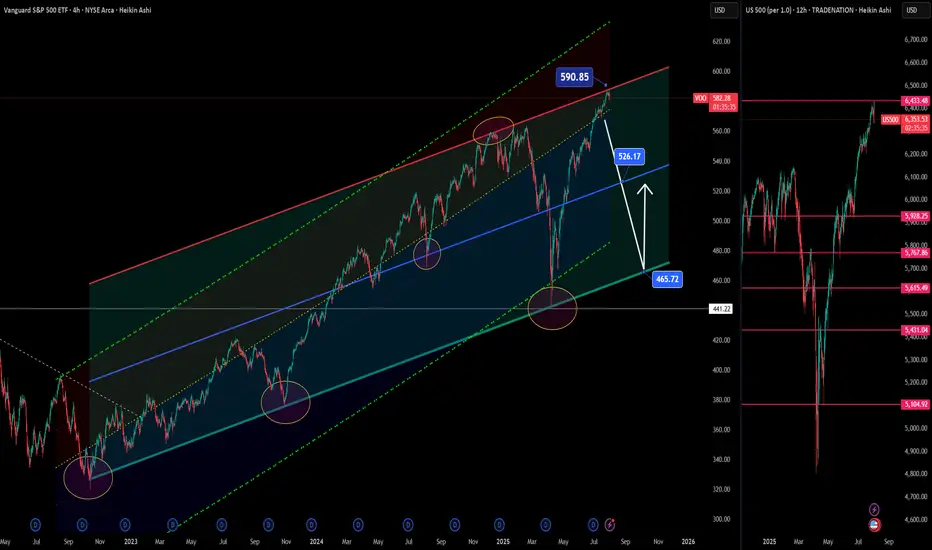
The VOO ETF, which tracks the S&P 500 , has now reached the upper boundary of a long-term ascending channel, once again brushing against resistance near 590.85. This zone has consistently led to major pullbacks in the past.
On the right panel, the US500 Index mirrors this move—pushing toward all-time highs, right as broader sentiment turns euphoric. Technically, both charts are overextended and pressing into key zones.
👀 Potential Path:
🔻 Rejection from current zone ➝ Down toward 526.17, then 465.72 (green support channel)
🔁 Possible bounce after correction — trend still intact long term
And while we’re keeping it technical, it’s worth noting that the Buffett Indicator (Stocks-to-GDP) i s currently screaming “overvaluation.” This doesn't predict timing—but it adds macro context to an already overheated chart setup.
The lesson? Price respects structure. Whether or not the fundamentals are in agreement, the charts are warning that now may not be the time to chase.
History doesn’t repeat, but it often rhymes. Stay sharp, stay technical. 🎯
One Love,
The FX PROFESSOR 💙
ps. the beauty of these levels? Tight Stop loss- excellent R/R
Disclosure: I am happy to be part of the Trade Nation's Influencer program and receive a monthly fee for using their TradingView charts in my analysis. Awesome broker, where the trader really comes first! 🌟🤝📈
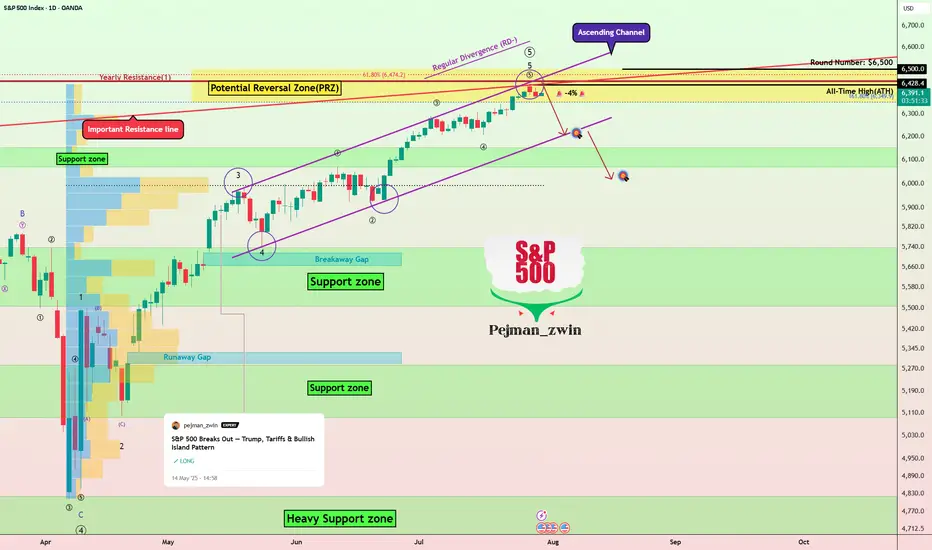
S&P500’s Bullish Island Turns Risky: Elliott Wave Says “Top”The S&P500 Index( SP:SPX ) started to rise and even created a new All-Time High(ATH=$6,428) with the help of the Bullish Long Island Pattern , as I published in my previous idea on May 14, 2025 .
The S&P500 Index is currently moving near the Potential Reversal Zone(PRZ) , upper line of the ascending channel , the Important Resistance line , and the Yearly Resistance(1) .
In terms of Elliott Wave theory , the S&P500 Index appears to be completing microwave 5 of microwave 5 of the main wave 5 .
Also, we can see the Regular Divergence(RD-) between Consecutive Peaks .
I expect the S&P500 Index to correct at least -4% and fall to the lower line of the ascending channel .
First Target: $6,233
Second Target: $6,033
Note: Stop Loss(SL) $6,513
Do you think S&P500 Index can create a new ATH above $6,500 !?
Please respect each other's ideas and express them politely if you agree or disagree.
S&P 500 Index Analyze (SPX500USD), Daily time frame.
Be sure to follow the updated ideas.
Do not forget to put a Stop loss for your positions (For every position you want to open).
Please follow your strategy and updates; this is just my Idea, and I will gladly see your ideas in this post.
Please do not forget the ✅' like '✅ button 🙏😊 & Share it with your friends; thanks, and Trade safe.
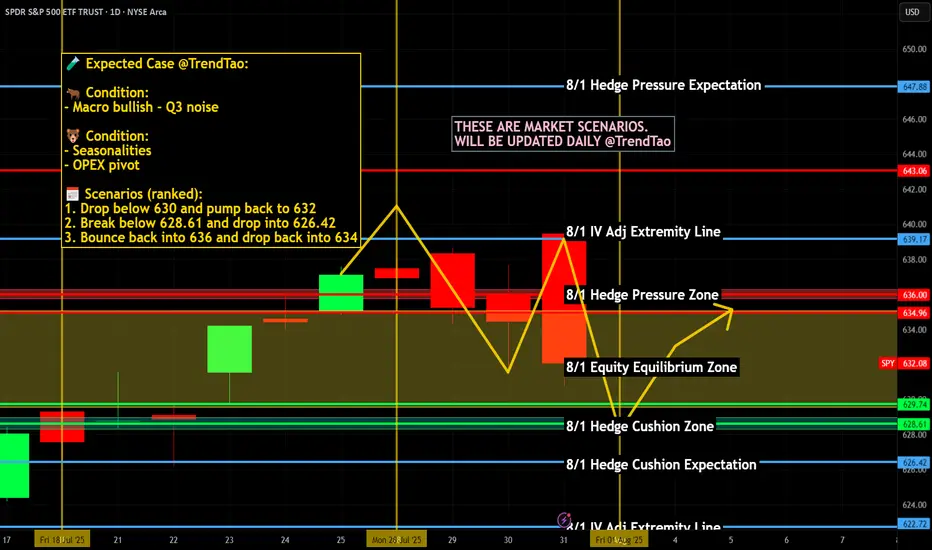
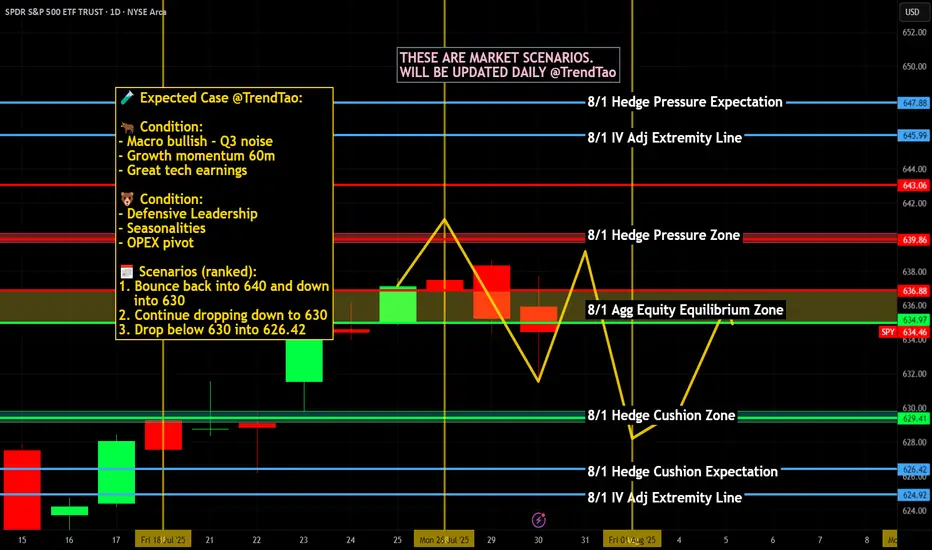
Nightly $SPY / $SPX Scenarios for August 1, 2025🔮 Nightly AMEX:SPY / SP:SPX Scenarios for August 1, 2025 🔮
🌍 Market-Moving News 🌍
📦 U.S. Imposes New Tariffs as Deadline Passes
Fresh tariffs rolled out on August 1 hitting major exporters: 25% on Indian goods, 20% on Taiwan, 19% on Thailand, and 15% on South Korea. Canadas tariff elevated to 35%, though Mexico got extra negotiation time. Global equity markets slipped modestly, led by declines in Asia-Pacific regions. AMEX:SPY futures also eased on mounting geopolitical and trade pressures.
🏦 Fed Uncertainty Mounts Despite Calm GDP
Despite robust Q2 GDP growth and a hold on interest rates this week, Fed Chair Jerome Powell faced growing unrest. Comments acknowledged downside labor risk amid trade uncertainty—investors are now assigning just a 39% chance of a rate cut in September.
📊 Key Data Releases & Events 📊
📅 Friday, August 1:
8:30 AM ET – Nonfarm Payrolls (July):
Payrolls rose by 106,000, less than June’s 147,000 but still positive. Wage growth slowed, easing inflation concerns slightly.
8:30 AM ET – Unemployment Rate:
Unemployment ticked up to 4.2%, from 4.1% in June—reflecting modest labor softness.
8:30 AM ET – Average Hourly Earnings (MoM):
Wages rose +0.2%, down from +0.4% in June, signaling wage pressure easing.
⚠️ Disclaimer:
This information is provided for educational and informational purposes only and should not be construed as financial advice. Always consult a licensed financial advisor before making investment decisions.
📌 #trading #stockmarket #economy #jobs #Fed #tariffs #inflation #technicalanalysis
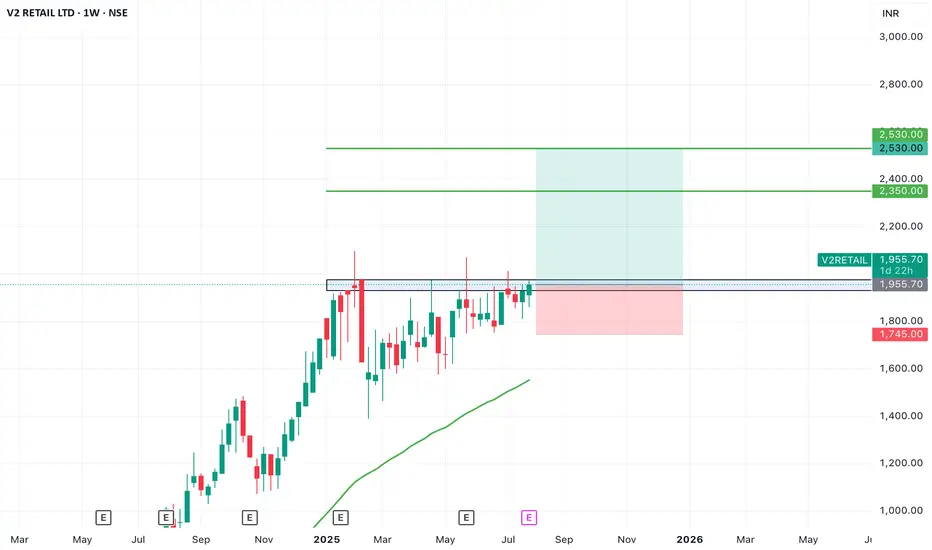
SWING IDEA - V2 RETAILV2 Retail , a small-cap value fashion retailer with a pan-India presence, is showing strong bullish momentum and a textbook swing trade setup backed by multiple breakout signals.
Reasons are listed below :
Breakout from a VCP (Volatility Contraction Pattern) – indicating accumulation and strength
Ascending triangle breakout – classic continuation pattern
Cleared major resistance zone, confirming bullish intent
Maintains a clear uptrend with higher highs and higher lows
Target - 2350 // 2530
Stoploss - weekly close below 1745
DISCLAIMER -
Decisions to buy, sell, hold or trade in securities, commodities and other investments involve risk and are best made based on the advice of qualified financial professionals. Any trading in securities or other investments involves a risk of substantial losses. The practice of "Day Trading" involves particularly high risks and can cause you to lose substantial sums of money. Before undertaking any trading program, you should consult a qualified financial professional. Please consider carefully whether such trading is suitable for you in light of your financial condition and ability to bear financial risks. Under no circumstances shall we be liable for any loss or damage you or anyone else incurs as a result of any trading or investment activity that you or anyone else engages in based on any information or material you receive through TradingView or our services.
@visionary.growth.insights
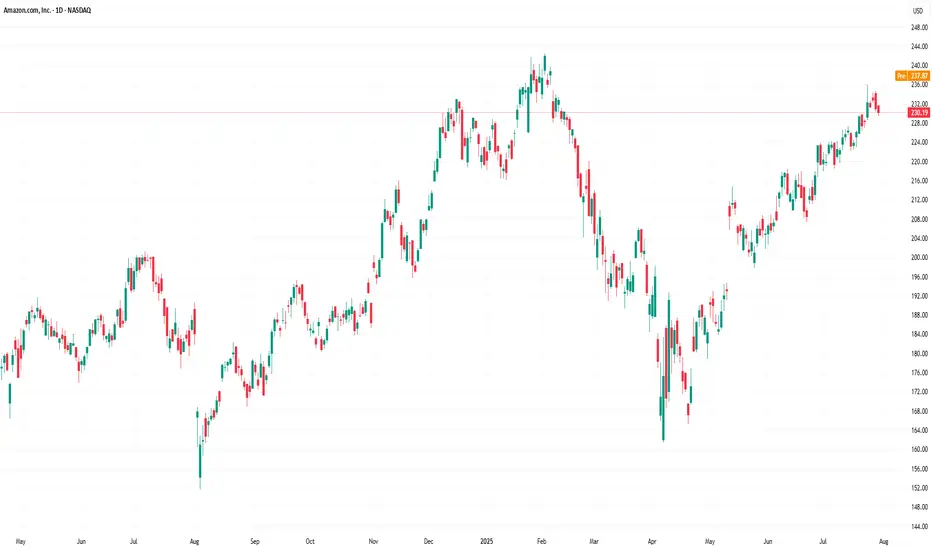
Amazon (AMZN) Shares Rise Ahead of Earnings ReportAmazon (AMZN) Shares Rise Ahead of Earnings Report
Today, 31 July, Amazon is set to release its quarterly earnings after the close of the regular trading session. Available data show that Amazon (AMZN) shares are exhibiting bullish momentum, reflecting positive market expectations:
→ In July, AMZN shares have outperformed the S&P 500 index (US SPX 500 mini on FXOpen);
→ Yesterday, following the end of the regular session, AMZN shares surged by approximately 3% in after-hours trading.
The rise in AMZN comes amid strong earnings reports from other tech giants, such as Microsoft (MSFT) and Meta Platforms (META). For example, MSFT shares rose by more than 8% in post-market trading. Their success has likely fuelled optimism that Amazon’s upcoming report will also impress.
All of this has brought noticeable changes to the technical outlook for the AMZN stock price.
Technical Analysis of the Amazon (AMZN) Chart
Following the release of the previous earnings report, price movements have formed an upward channel, as indicated by the Regression Trend tool. However, in recent days, a series of bearish signals emerged:
→ On Thursday, AMZN broke above the $230 level (marked by an upward arrow), but the session closed well below the highs – a sign of selling pressure;
→ Friday and Monday’s sessions produced candles with small bodies, indicating market indecision;
→ On Tuesday, bears took the lead (marked by a downward arrow), with a relatively long candle closing near the session low.
Thus, the chart gave reason to assume that optimistic sentiments were waning. However, today’s session is likely to open near the $237.30 level, effectively negating the bearish interpretation of the previous five candles and shifting momentum back in favour of the bulls.
In this context:
→ Support could be provided by the $230 level as well as the median of the Regression Trend channel;
→ Key resistance could be found at the previous high of $242.23 and the psychological level of $250.
Whether AMZN can surge to a new all-time high will largely depend on the company’s performance in AI – a theme that remains highly relevant in 2025.
This article represents the opinion of the Companies operating under the FXOpen brand only. It is not to be construed as an offer, solicitation, or recommendation with respect to products and services provided by the Companies operating under the FXOpen brand, nor is it to be considered financial advice.
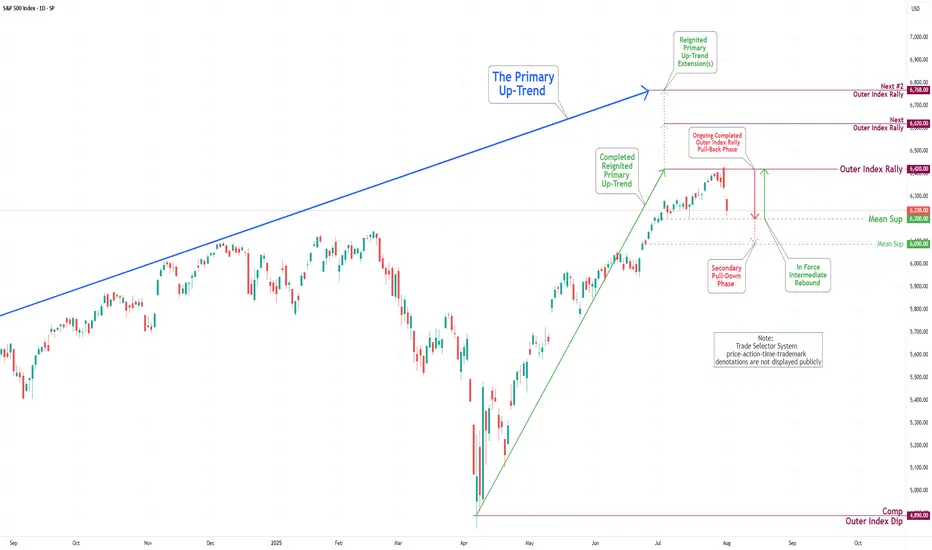
S&P 500 Daily Chart Analysis For Week of August 1, 2025Technical Analysis and Outlook:
During the trading activity of the previous week, the S&P 500 Index displayed a predominantly bearish movement after completing our Outer Index Rally target of 6420, as highlighted in the prior week’s Daily Chart Analysis, with the primary objective now being to plug our Mean Support at 6200.
It is essential to recognize that the current price movement may trigger a significant further pullback to the Mean Support level of 6090. Following this downturn, it is expected that the index will resume its upward momentum, aiming for a retest of the Outer Index Rally peak at 6420.
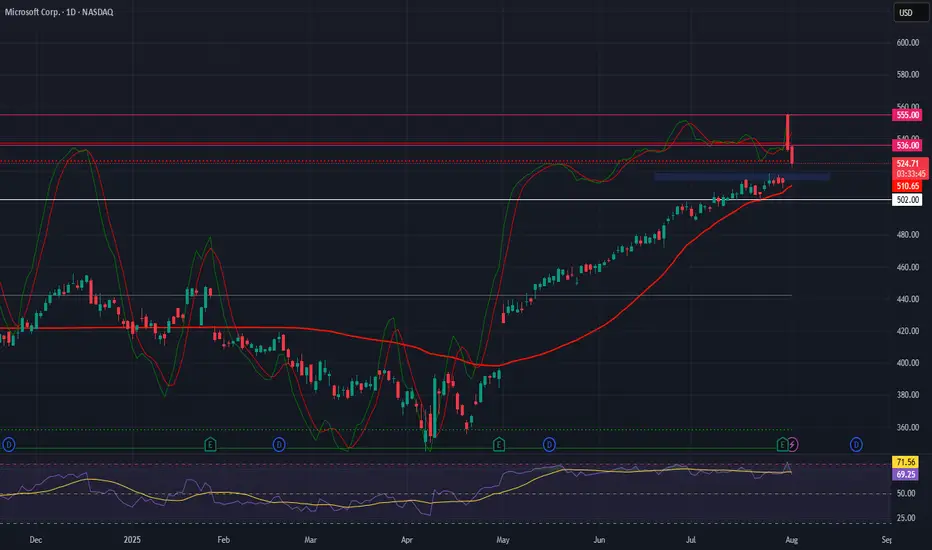
Microsoft (MSFT)–Watching for Pullback Entry After $4T MilestoneMicrosoft Corp. NASDAQ:MSFT has become the second company after Nvidia to cross the $4 trillion market cap, powered by strong AI and cloud demand.
Azure revenue grew 34% to $75B in 2024, with a $30B AI infrastructure investment fueling future growth. Q4 EPS came in at $3.65 on $76.4B revenue, showing strong fundamentals.
We are looking for a pullback to key support for a long entry:
Trade Plan:
Entry Zone: $515 – $518
Take Profit: $536, $555
Stop Loss: $502
#Microsoft #MSFT #Stocks #Trading #StockMarket #TechnicalAnalysis #AI #Cloud #BigTech #NASDAQ
Quantum's TSLA & NVDA Trades 8/1/25Simply breaking down what I look at going into the trading day. Premarket watchlist was short but nailed TSLA short for 150% and could have made double that on TSLA and NVDA longs. Due to hitting my daily goals I had to walk away to avoid overtrading but what an amazing day.

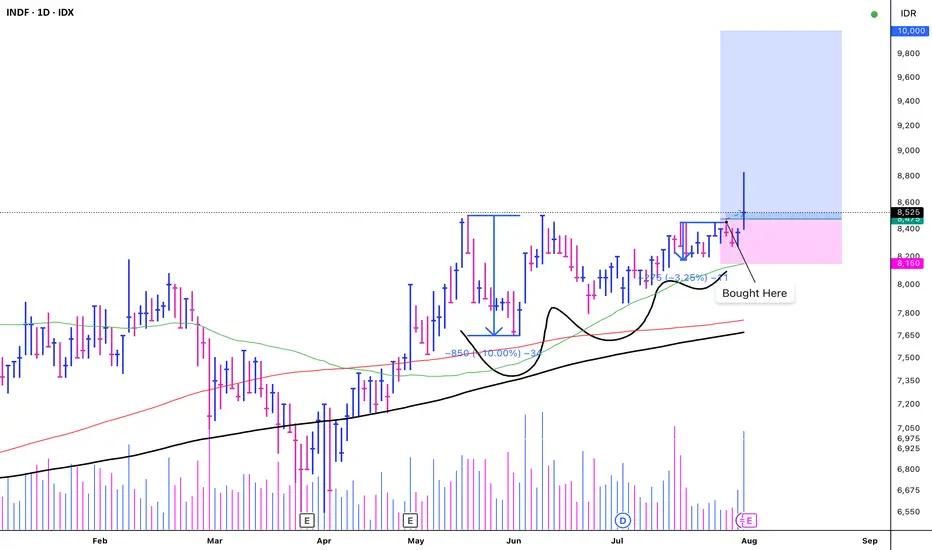
INDF - VCP (13W 10/3 3T)IDX:INDF - VCP
+)
1. Low risk entry point on a pivot level.
2. Volume dries up.
3. Price has been above the MA 50 > 150 > 200
4. Price is within 25% of its 52-week high.
5. Price is over 25% of its 52-week low.
6. The 200-day MA has been trending upwards for over a month.
7. The RS Rating is above 70 (71).
EPS Growth:
a. Quarterly QoQ: -
b. Quarterly YoY: +11.20%.
c. TTM YoY: +32.14%.
d. Annual YoY: +6.07%.
(-)
1. There is no significant breakout with substantial volume.
$NDX 3rd Bearish EngulfingSlowly but surely we are seeing deteriorating conditions in every major indices.
NASDAQ:NDX closed and formed the 3rd BEARISH engulfing in 2 weeks, RARE!
Light volume so it's not definitive, but alarming.
TVC:DJI keeps weakening.
SP:SPX many RED candles & bearish engulfing as well.
Light volume though.

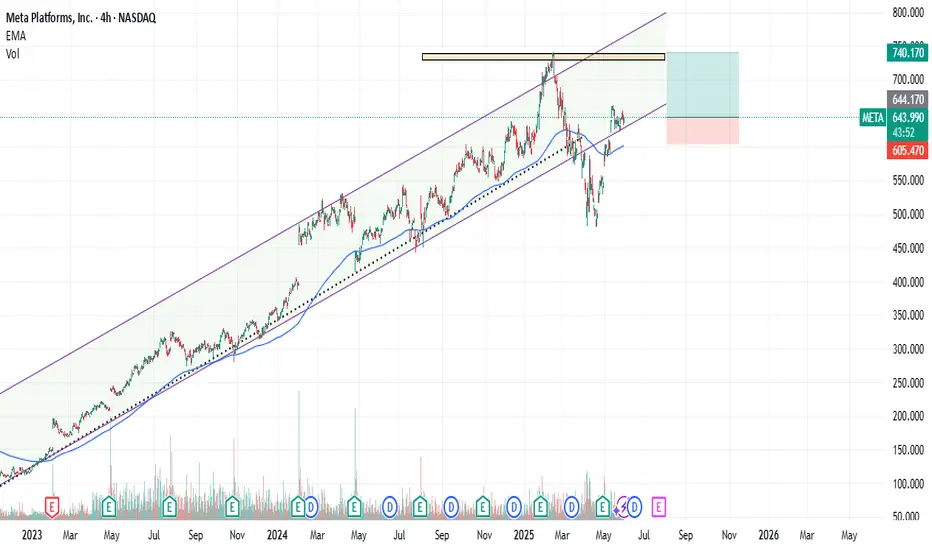
META : Old Peak can be TestedMeta platform has lost altitude from the channel it has formed since 2023, but has gained momentum and re-entered the channel. The possibility of testing the old peak contains a good RR rate.Of course, with a stop-loss close to the 200-period moving average.( Risk/Reward Ratio : 2.48)
Stop-Loss: 605.47
Target : 740.10
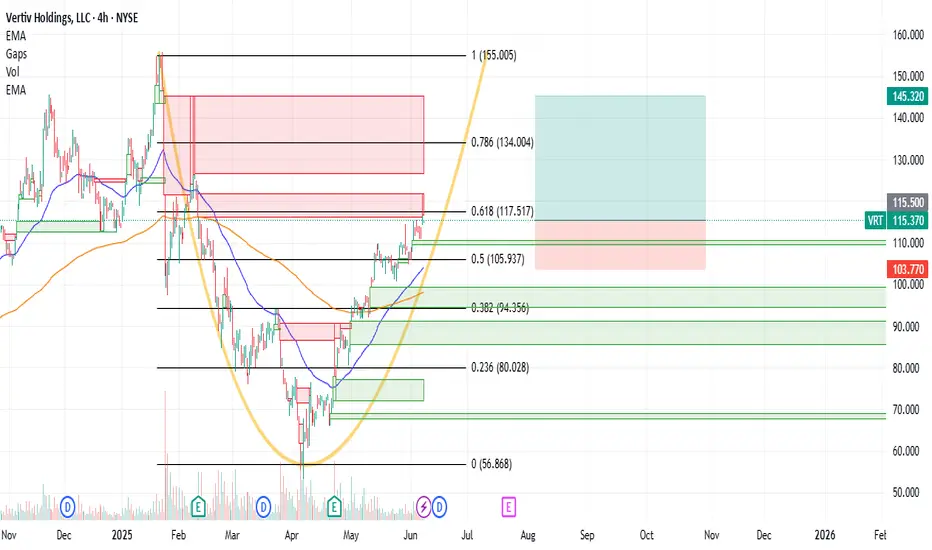
VRT : Long Position Vertiv Holdings is trading above the 50 and 200-period moving averages.
It has overcome the resistances one by one without being exposed to a very high IV.
It has started to draw a cup.
However, it is much better to focus on the big gap rather than the cup formation because with good chances it can encounter a big resistance there.
Targeting the 50-period ema and the 0.5 level of the short-term Fibonacci retracement levels as a stop point gives us the opportunity to try trading at a not bad risk/reward ratio.
With a small position size or small portfolio percent :
Risk/Reward Ratio : 2.54
Stop-Loss : 103.77
Take-Profit : 145.32
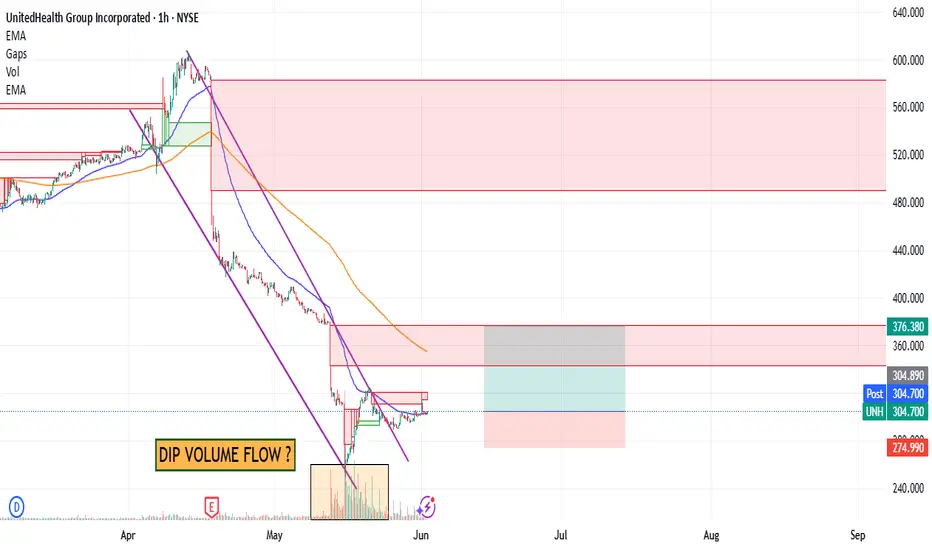
UNH : Are Bad Days Over ? (Cautious)UNH shares have moved above the 50-period moving average but are trading below the 200-period moving average.
For now, since the 200-period moving average is very high, a small trade can be tried by keeping the stop-loss level a little tight.
A few weak movements may pull the average down and the price may break the average.
Therefore, small position sizes are ideal.
NOTE : If we can maintain persistence on 376(Which will take a few days),
then we will look at the other gaps.
Risk/Reward Ratio : 2.39
Stop-Loss : 274.99
Take- Profit Level : 376.38
Regards.
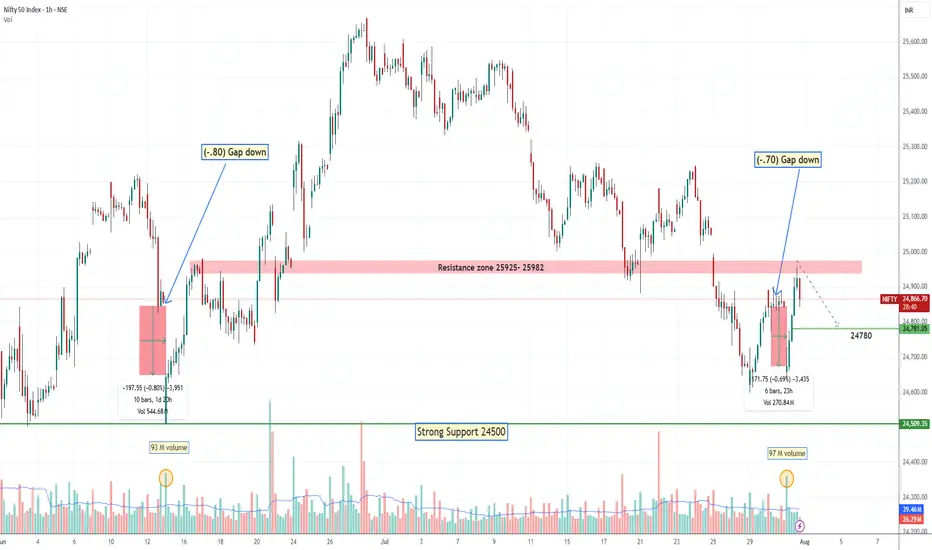
Nifty 24780 Pullback possible on next 1-2 days On 31 July, if someone watch closely price action he could capture Today up move coz Nifty gave almost same price action as 13 June let's try to find what is the Same thing: -
(A)31 July 2025: gap down is (-70%)
volume around 97 million
Bounce Back after gap down around +1%
(B) 13 June: gap down was (-80%)
Volume around 93 million
Bounce back after gap down around +1
On 13 June Nifty faced resistance of 24980 level then retraced. Due to such similarities, we can conclude that it could be pullback around 24780 level although I don't say market will behave same as before, I know every second of market is very dynamic and different from past days, but technical analysis always based on historical data. so, this is just assumption. take the trade on your own analysis & research.
GME 1W: when the memes fade, the structure speaksGameStop is once again testing the lower boundary of its long-term consolidation, bouncing off the 21.53 zone - a level that aligns with the 0.79 Fib retracement and historical support. This zone also intersects with a key trendline on the weekly chart, and just recently, a golden cross (MA50 crossing MA200 weekly) printed - a rare but technically significant signal. The stock continues to trade inside a broad descending channel, and if this support holds, the natural next step is a move back toward the mid-range at 37.42 (0.5 Fib), followed by a possible push toward 64.92. The tactical setup favors a confirmation entry near current levels, with a stop under 21.00. Risk/reward here is among the cleanest GME has offered in months.
On the fundamental side, GameStop remains in a transitional phase. The company is shutting down unprofitable segments, reducing costs, and doubling down on e-commerce and digital distribution. Financial results are still slow to recover, but the latest Q2 2025 report showed positive operating cash flow and narrowing losses. This isn't a value play in the traditional sense - it's more about the potential for renewed retail-driven momentum if technical conditions align.
If there’s still power behind the crowd - this might be one of the most technically compelling entry zones of 2025.

Nightly $SPY / $SPX Scenarios for July 31, 2025🔮 Nightly AMEX:SPY / SP:SPX Scenarios for July 31, 2025 🔮
🌍 Market-Moving News 🌍
🏦 Fed Holds Rates — Dissent Indicates Division
The Federal Reserve maintained its benchmark rate at 4.25%–4.50%. Notably, two governors—Christopher Waller and Michelle Bowman—dissented in favor of a 25 bp rate cut, underscoring internal divisions amid growing political pressure
📈 Strong Q2 Growth, But No Rate-Cut Signal
U.S. GDP expanded at a 3.0% annualized rate in Q2, rebounding sharply from Q1's contraction. Despite this, Powell emphasized persistent inflation, particularly from tariffs, reinforcing the Fed’s cautious policy stance
🛢️ Oil Climbs as Tariff Tensions Rise
Brent crude rose to ~$73.51 and WTI to ~$70.37 on fears of supply disruptions tied to President Trump’s threats of new tariffs on Russian oil and new tariffs imposed on Brazil and South Korea
📊 Key Data Releases & Events 📊
📅 Thursday, July 31:
8:30 AM ET – Initial Jobless Claims (week ending July 26)
Initial claims rose to 222,000, up from 217,000 previously—an early gauge of labor-market trends
8:30 AM ET – Employment Cost Index (Q2)
Quarterly growth in labor costs edged lower to 0.8%, down from 0.9%—a signal of moderate wage pressures
8:30 AM ET – Personal Income (June)
Data released on household income and spending patterns—crucial for assessing consumer resilience heading into Q3
⚠️ Disclaimer:
This information is for educational and informational purposes only and should not be construed as financial advice. Always consult a licensed financial advisor before making investment decisions.
📌 #trading #stockmarket #economy #Fed #inflation #jobs #technicalanalysis
CVX & XOM: The Bull case for OilI review the the Daily and Weekly charts on CVX & XOM, showing tradable patterns that they have formed since 2022. These are longer term trading patterns but are still active and fun to watch.

NIKE Confirms A Bullish Reversal With An Impulsive RecoveryWe talked about Nike on July 10 with our members, where we mentioned and highlighted a completed higher degree ABC correction in wave IV on the monthly and weekly charts.
Today we want to represent a closer view, as we see a five-wave impulsive recovery away from the lows on a daily chart. It actually confirms the bottom and bullish reversal, but since it can be trading in 5th wave that can stop around 80-85 area, we should be aware of a three-wave corrective setback soon. It can slow down the price back to the open GAP, so ideal buy zone is in the 70-60 area. Invalidation level is at 52.
Highlights:
Direction: Up, but watch out for a correction
Structure: Impulse, Wave 5 in final stages
Support: 70 / 60

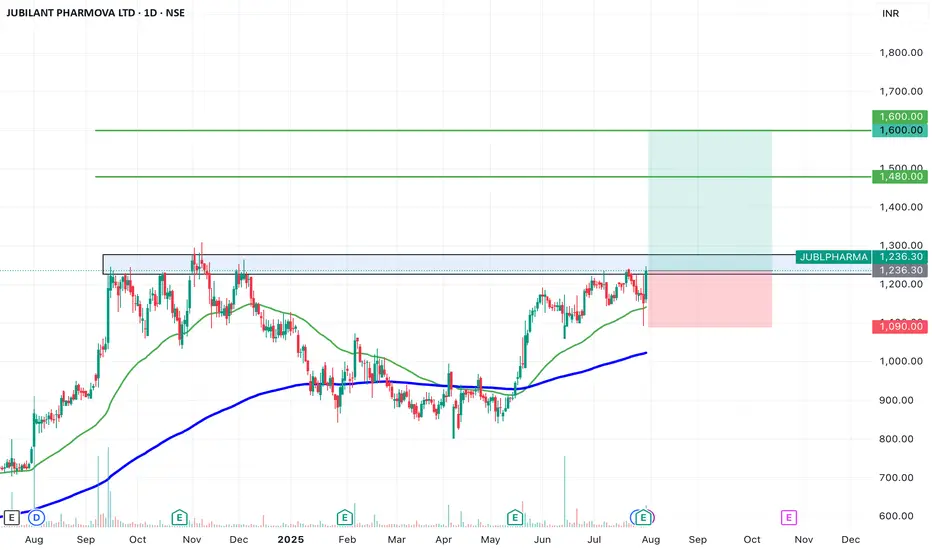
SWING IDEA - JUBILANT PHARMOVAJubilant Pharmova , a diversified pharmaceutical company focused on CRAMS and specialty pharma, is presenting a strong swing opportunity backed by a major pattern breakout and volume confirmation.
Reasons are listed below :
Breakout from an Inverted Head & Shoulders pattern after over a year of consolidation
Attempting breakout above 1250, a key resistance zone with multiple rejections in the past
Strong marubozu candle on the daily chart with a notable volume spike, signaling conviction
Trading near all-time highs, and comfortably above key EMAs, reinforcing trend strength
Target : 1480 // 1600
Stoploss : weekly close below 1090
DISCLAIMER -
Decisions to buy, sell, hold or trade in securities, commodities and other investments involve risk and are best made based on the advice of qualified financial professionals. Any trading in securities or other investments involves a risk of substantial losses. The practice of "Day Trading" involves particularly high risks and can cause you to lose substantial sums of money. Before undertaking any trading program, you should consult a qualified financial professional. Please consider carefully whether such trading is suitable for you in light of your financial condition and ability to bear financial risks. Under no circumstances shall we be liable for any loss or damage you or anyone else incurs as a result of any trading or investment activity that you or anyone else engages in based on any information or material you receive through TradingView or our services.
@visionary.growth.insights
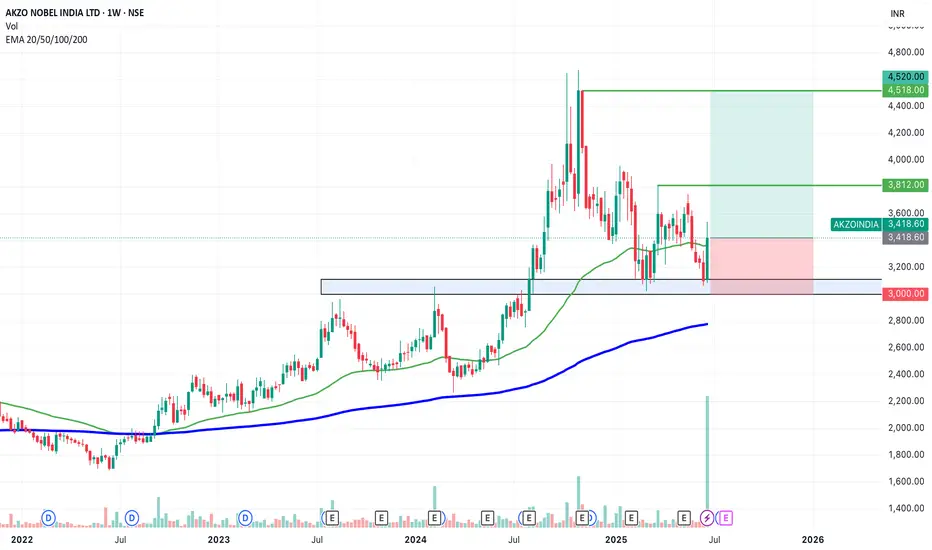
SWING IDEA - AKZO NOBEL INDIA Akzo Nobel India , a subsidiary of the global paints and coatings giant AkzoNobel N.V., is a leading player in India’s decorative and industrial paints market. Known for its premium brand Dulux , the company has strong brand recall, a wide distribution network, and consistent profitability.A strong brand, steady margins, and a bullish chart make this a candidate to watch for a short- to medium-term swing trade.
Reasons are listed below :
Bullish engulfing candle spotted on the weekly timeframe, signaling a potential trend reversal.
Accompanied by the highest-ever volume spike, adding strong conviction to the move.
Price is bouncing off the golden Fibonacci support (0.618), a classic retracement zone where strong reversals often occur.
The level of 3100 acted as a solid support.
The stock is trading above its 50 & 200 EMA on the weekly chart — a sign of long-term strength.
Target - 3812 // 4520
Stoploss - weekly close below 3000
DISCLAIMER -
Decisions to buy, sell, hold or trade in securities, commodities and other investments involve risk and are best made based on the advice of qualified financial professionals. Any trading in securities or other investments involves a risk of substantial losses. The practice of "Day Trading" involves particularly high risks and can cause you to lose substantial sums of money. Before undertaking any trading program, you should consult a qualified financial professional. Please consider carefully whether such trading is suitable for you in light of your financial condition and ability to bear financial risks. Under no circumstances shall we be liable for any loss or damage you or anyone else incurs as a result of any trading or investment activity that you or anyone else engages in based on any information or material you receive through TradingView or our services.
@visionary.growth.insights
BA: Boeing down on better than expected results! 30-07-2025Yesterday we get Boeing earnings report which came better than expected, but the stock down more than 4% as the company is not expected to make positive profit or free cashflow before 2026. No dividends currently paid, so there is nothing attractive to me now.
Disclaimer: This content is NOT a financial advise, it is for educational purpose only.
