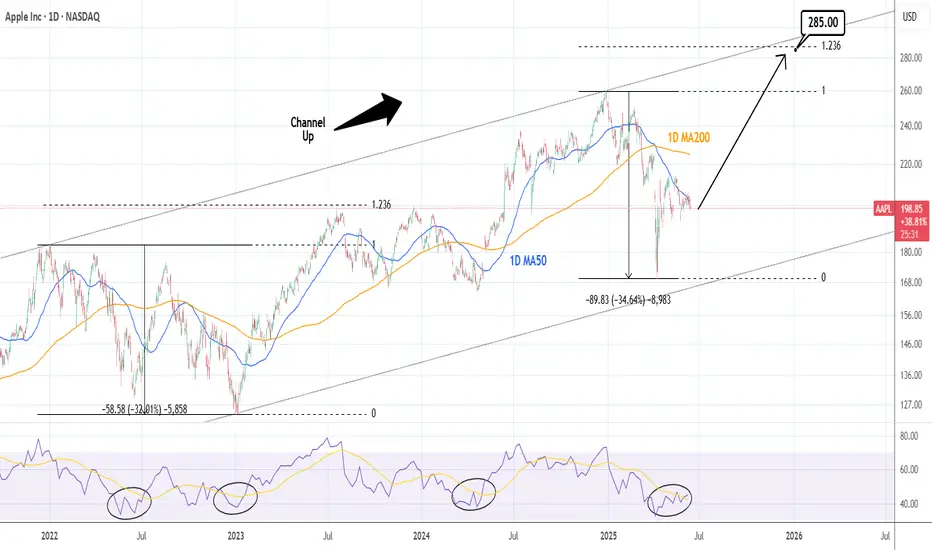
APPLE: 3 year Channel Up targets $285.Apple is marginally bearish on its 1D technical outlook (RSI = 43.788, MACD = -0.260, ADX = 30.978) as the recent weakness impeded the price from making the decisive bullish break-out above it. The 1W RSI structure though indicates that this is a bottom formation and it is evident on the Channel Up that the April 7th low has been the start of the new bullish wave. The first bullish wave which also started after a -32% correction, made a first peak on the 1.236 Fibonacci extension. We are bullish on Apple long term, TP = 285.00.
## If you like our free content follow our profile to get more daily ideas. ##
## Comments and likes are greatly appreciated. ##
Stocks!
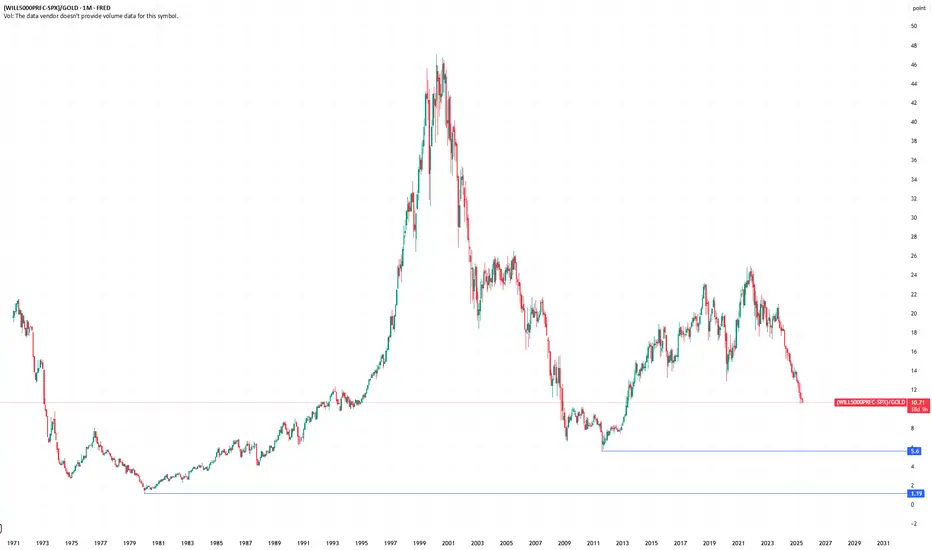
Small Stocks vs. GoldThis index represents small caps minus big caps, divided by gold. A good representation of how small companies in USA are doing related to gold (hard asset). You could argue that this is more representing of real economy and it's health.
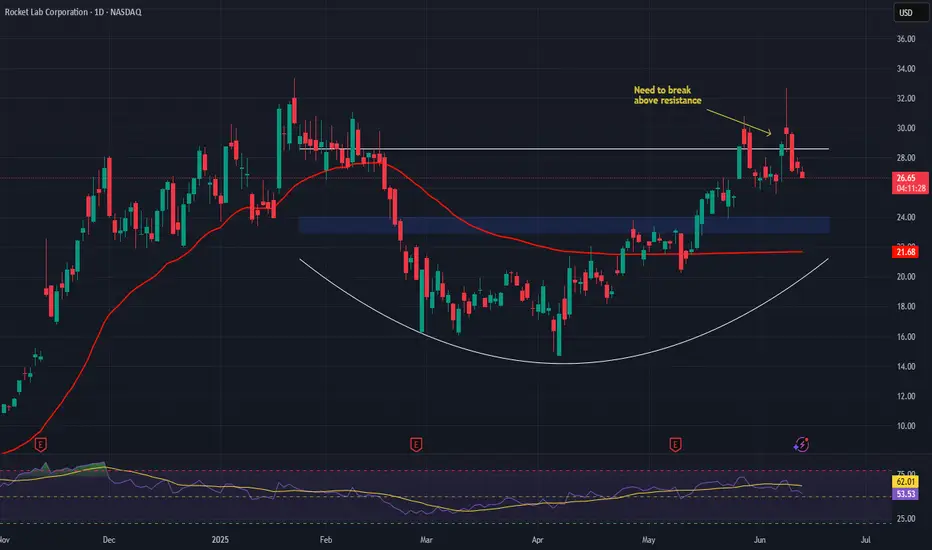
Rocket (RKLB) From Launch Innovator to Space Systems PowerhouseCompany Evolution:
Rocket Lab NASDAQ:RKLB is transforming into a vertically integrated space and defense systems company, leveraging its launch heritage to build long-term, diversified revenue streams.
Key Catalysts:
Rapid Launch Cadence 🛰️
3 Electron launches in 24 days demonstrate operational agility and scalability.
Meets rising demand for high-frequency satellite constellation deployments.
Strategic GEOST Acquisition 🛡️
$275M deal expands into electro-optical and infrared payloads, key for defense/ISR.
Boosts margin profile, backlog durability, and government contract appeal.
Validated Execution & Recurring Revenue 💼
100% mission success rate and multi-launch contract with Japan's iQPS reinforce credibility.
Positions RKLB for long-term cash flow stability and multiyear contract wins.
Investment Outlook:
📈 Bullish above $23.00–$24.00, backed by high reliability and strategic expansion.
🎯 Price Target: $42.00–$43.00, reflecting an expanding TAM, defense sector momentum, and vertically integrated execution.
🌠 RKLB is no longer just reaching orbit—it's building the infrastructure of space. #RKLB #SpaceStocks #DefenseGrowth
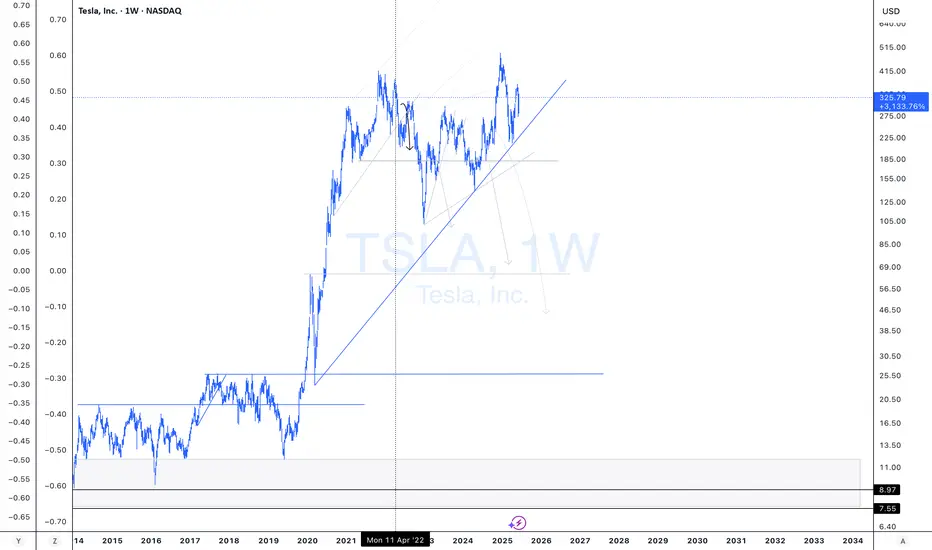
TSLA Short Entry | Recession UnderwayI have added to NASDAQ:TSLA short.
I have also linked my previous Tesla short chart from 2022.
Nothing has changed with Tesla. The company is severely over-valued.
I will continue to provide updates.
S&P 500 Breaks Out — Trump, Tariffs & Bullish Island PatternDonald Trump has mentioned the US stock market in every meeting he has held in the past few days, which has caused the US stock market indices , including the S&P500 Index ( SP:SPX ), to rise:
"Better go out and buy stocks now".
President Donald Trump told a crowd in Saudi Arabia on Tuesday that the markets are just getting started. “It’s going to get a lot higher,” he said, right as the S&P 500 posted its first gain since late February.
But one of the main reasons for the increase in the S&P 500 Index and US stocks is The United States has dropped its tariffs on Chinese goods to 30% , down from a brutal 145% , while China is slashing its own duties on US imports to just 10% , temporarily, for the next 90 days .
-------------------------------------------------
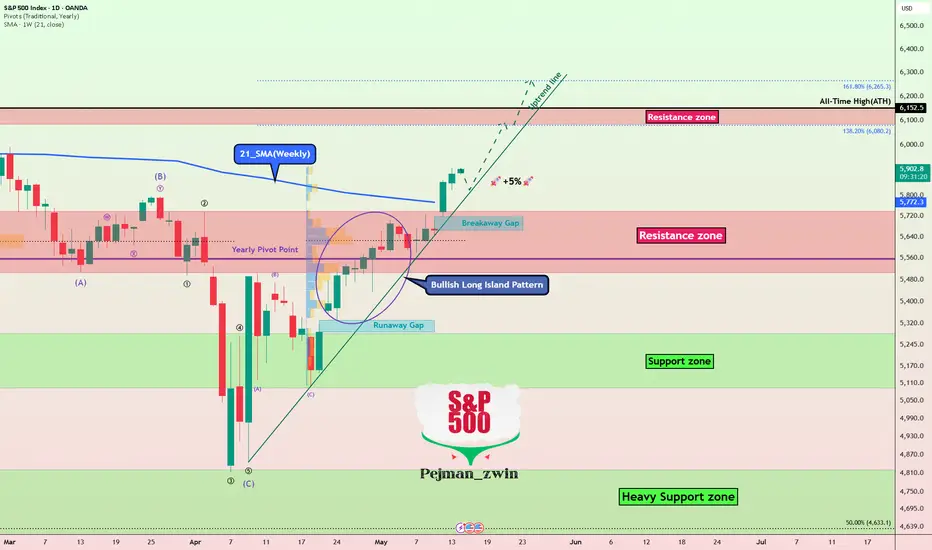
Now let's take a look at the S&P 500 Index chart on the daily time frame .
S&P500 Index managed to break the Resistance zone($5,737_$5,506) and 21_SMA(Weekly) by Breakaway Gap .
In terms of Classic Technical Analysis , the S&P500 Index has managed to form a Bullish Long Island Pattern , and this pattern is one of the continuing patterns and will be a sign of the continuation of the S&P500 Index's upward trend .
In terms of Elliott Wave theory , it seems that the S&P500 index has completed the corrective wave and is in new impulsive waves , which could cause a new All-Time High(ATH) to form.
I expect the S&P500 index to increase by at least +5% as it approaches the Uptrend line , and we will see the possibility of a new ATH .
Please respect each other's ideas and express them politely if you agree or disagree.
S&P 500 Index Analyze (SPX500USD), Daily time frame.
Be sure to follow the updated ideas.
Do not forget to put a Stop loss for your positions (For every position you want to open).
Please follow your strategy and updates; this is just my Idea, and I will gladly see your ideas in this post.
Please do not forget the ✅' like '✅ button 🙏😊 & Share it with your friends; thanks, and Trade safe.
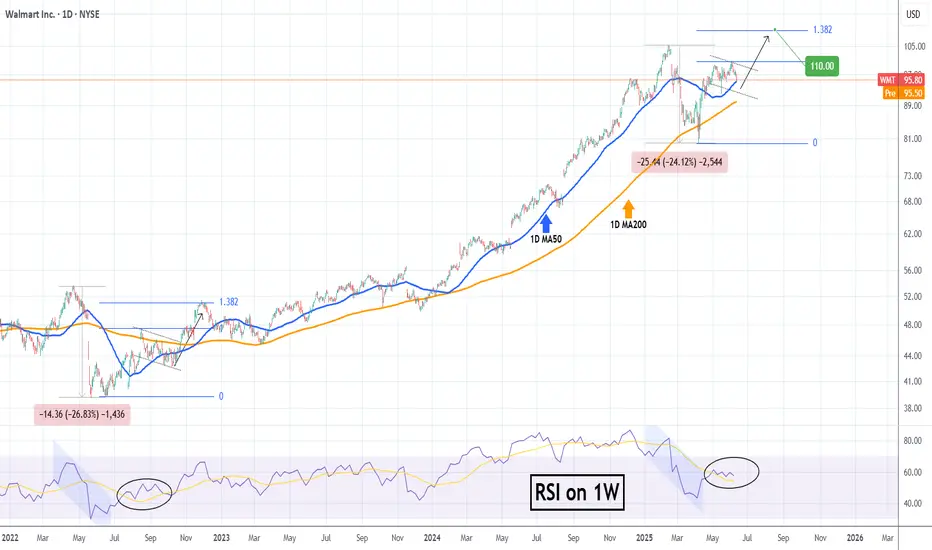
WALMART testing its 1D MA50! Will it bounce?Walmart (WMT) hit yesterday its 1D MA50 (blue trend-line) for the first time since April 21. It appears that the rebound from the Trade War Low has turned sideways on a Double Top formation and the 1D MA50 is the first Support to be tested, with the 1D MA200 (orange trend-line) following.
This pattern resembles the August - September 2022 Bull Flag, which despite breaking below its 1D MA50, it resumed the uptrend shortly after and hit the 1.382 Fibonacci extension before the next 1D MA50 pull-back.
As a result, we expect the stock to reach $110.00 (Fib 1.382) by the end of the Summer.
-------------------------------------------------------------------------------
** Please LIKE 👍, FOLLOW ✅, SHARE 🙌 and COMMENT ✍ if you enjoy this idea! Also share your ideas and charts in the comments section below! This is best way to keep it relevant, support us, keep the content here free and allow the idea to reach as many people as possible. **
-------------------------------------------------------------------------------
💸💸💸💸💸💸
👇 👇 👇 👇 👇 👇
WARBY PARKER to continue its recovery to $34 and beyond#inverseheadandshoulders
They want to have 900 retail locations
currently operating 271 in the US and 5 in Canada.

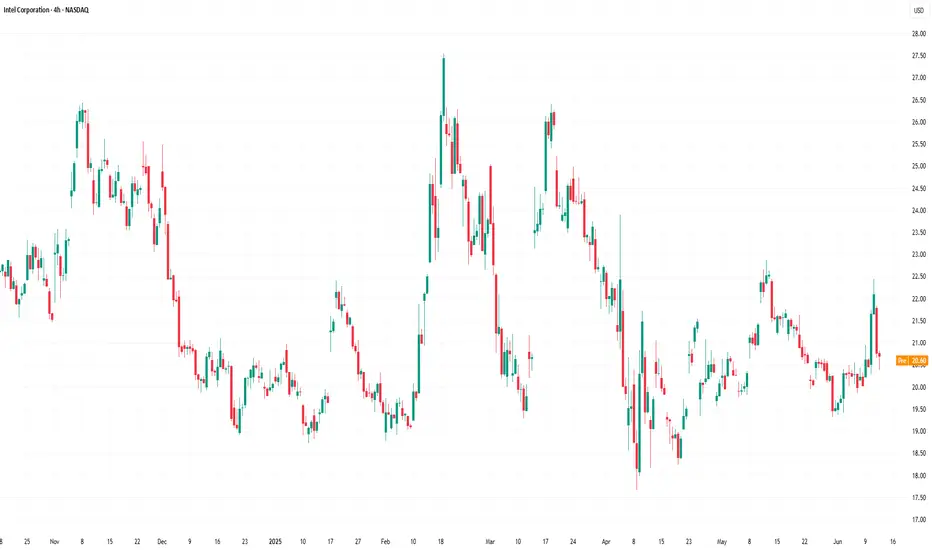
Intel (INTC) Shares Drop Over 6% in a DayIntel (INTC) Shares Drop Over 6% in a Day
As shown on the Intel (INTC) chart, after Tuesday’s candle closed above $21, the price dropped sharply on Wednesday. INTC was the worst-performing stock of the day among the components of the S&P 500 index (US SPX 500 mini on FXOpen).
Why Did INTC Shares Fall?
The decline is linked to growing competitive pressure. According to media reports:
→ On one hand, AMD continues to rapidly expand its share of the server CPU market. A report by Mercury shows that the company already controls 40% of the segment and could match Intel as early as next year.
→ On the other hand, Nvidia is preparing to launch two accelerated processing units (APUs) for the consumer market, which will combine CPU and GPU capabilities in a single product.
Technical Analysis of the INTC Chart
In 2025, the price remains:
→ within a broad downward trend (marked in red);
→ supported by the $18.50–$20 zone.
Meanwhile, price fluctuations in May and June are forming a narrowing triangle (marked in black). Following the recent negative news, it is possible that INTC shares could fall towards the lower boundary of the triangle — or even retest the psychologically important $20 level.
This article represents the opinion of the Companies operating under the FXOpen brand only. It is not to be construed as an offer, solicitation, or recommendation with respect to products and services provided by the Companies operating under the FXOpen brand, nor is it to be considered financial advice.
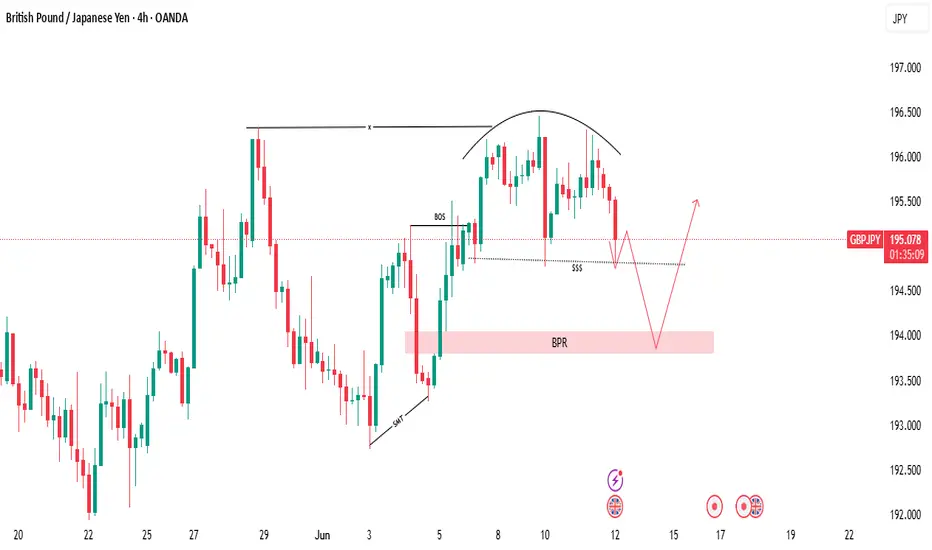
Why? Because liquidity is building at this support zone.🚨 GBP/JPY Traders — Don’t Get Trapped! 🚨
GBP/JPY has just touched a major support level, and on the surface, it looks like a golden buying opportunity. But here’s the catch: this is exactly where most retail traders get trapped.
Why? Because liquidity is building at this support zone. Smart money knows retail traders have stop losses and pending orders sitting right below — and they’re coming for it. 🧠💰
Here’s what the market is likely to do next:
📈 Step 1: A small bullish bounce to lure retail traders in. Everyone starts thinking, “This is the reversal!”
🔄 Step 2: Boom — a sharp move down. Stop hunts. Fakeouts. Panic sells. The market dips below support, grabbing liquidity.
🚀 Step 3: Once liquidity is swept and BPR (Break Point Range) is hit, then the real move begins.
This is a classic setup — trap retail, feed institutional orders, and then drive the market in the true direction.
⚠️ Don’t fall for the bait. Stay patient. Let the trap spring before you strike.
📊 Watch structure. Watch liquidity. Watch price behavior. That’s where the edge is.
DYOR — Do Your Own Research. This isn’t financial advice — it’s a trader’s insight.
Trade smart. Trade sharp. 💼🔥
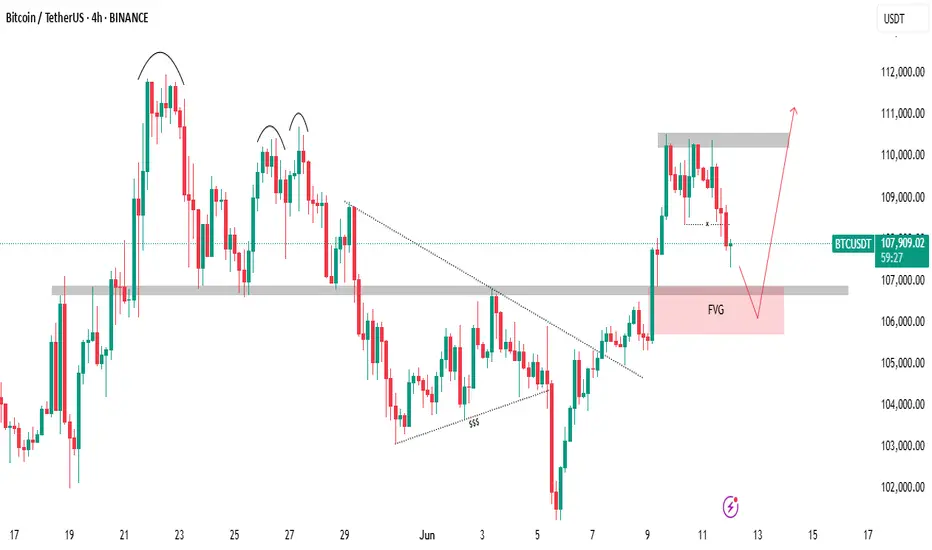
Last week Bitcoin created massive liquidity at a key resistance!🚨 Bitcoin Update – A Bullish Storm Is Brewing? 💥
Last week, Bitcoin created massive liquidity at a key resistance zone, and guess what? That liquidity is still untouched. The market hasn’t fully tapped into it yet — and that’s a big deal.
Recently, BTC smashed through resistance and even left behind a Bullish Fair Value Gap (FVG), signaling strength. But hold on—after this breakout, the market is showing signs of a minor pullback, likely to retest its marked IRL (Important Reaction Level).
📉 It’s cooling off temporarily... but don’t blink. This zone could act as a springboard for the next big leg up.
💡 Here’s the kicker: there’s still a ton of liquidity waiting above. If the market wants it—and it usually does—there’s a high probability (80%+) of another bullish push.
👀 Watch this area closely. It’s a make-or-break zone.
📊 Do Your Own Research (DYOR) – this is not financial advice, just a friendly nudge from the charts.
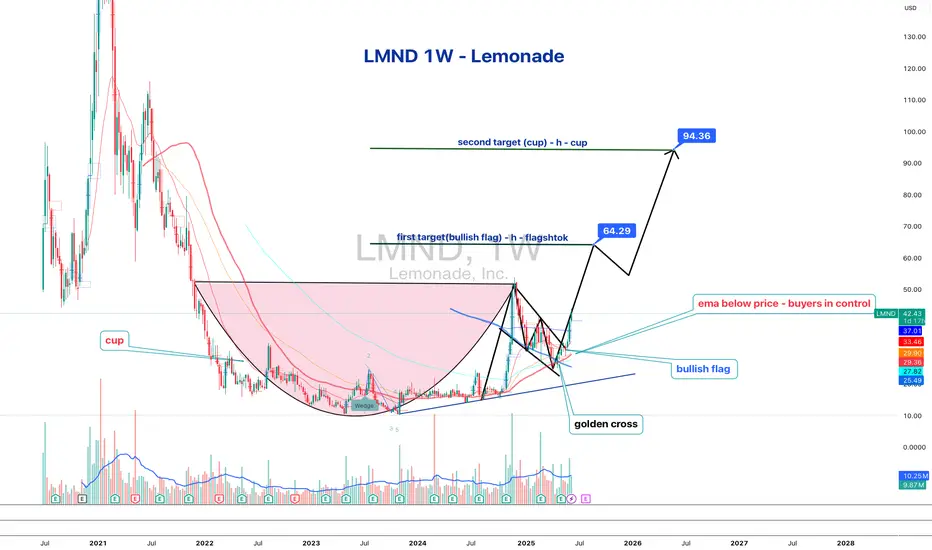
Lemonade Inc.: Breakout in Motion — Cup, Flag, and No BrakesLemonade Inc. (LMND) is accelerating after a clean breakout from a textbook cup with handle pattern, where the handle formed as a tight bullish flag. The breakout occurred around $32, and since then, price action has been sharp, controlled, and uncorrected — currently trading at $42.42 with buyers clearly in charge.
On the fundamental side, LMND is moving through a recovery phase: operational losses are narrowing, revenue is stabilizing, and the company is aggressively leveraging AI to automate its insurance processes. Expansion into Europe continues, and institutional interest is visibly rising — confirmed by volume building alongside price. Within the insuretech sector, LMND is starting to look like a comeback story rather than a cautionary tale.
Technically, the setup remains strong:
– Golden Cross confirmed (EMA50 crossing EMA200)
– EMA50/100/200 all below price — bullish structure firmly intact
– Volume expanding on up-days — healthy confirmation
– RSI hovering in the 60–65 range — momentum is intact, no signs of exhaustion
Targets remain aligned with the structure:
– tp1 = $64 — measured move from the flag
– tp2 = $94 — full realization of the cup pattern
Tactically, this is no longer a “wait and see” setup — the move is in progress. No correction so far, only continuation. Momentum traders may consider entries into strength. Above $45, the move could accelerate further as more participants recognize the structure.
LMND is showing technical and fundamental alignment — confirmed breakout, improving narrative, and strong trend structure. While the impulse holds, this chart favors continuation, not hesitation.
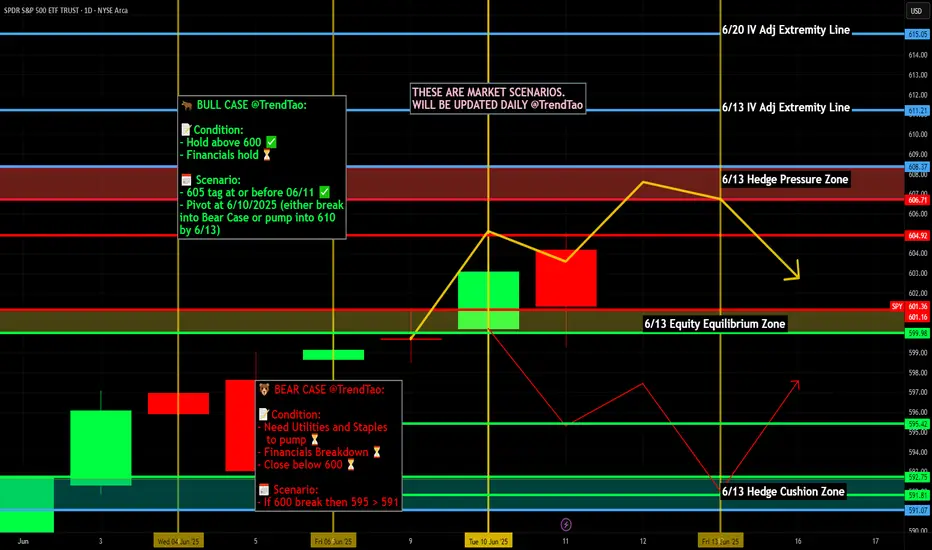
Nightly $SPY / $SPX Scenarios for June 12, 2025🔮 Nightly AMEX:SPY / SP:SPX Scenarios for June 12, 2025 🔮
🌍 Market-Moving News 🌍
💱 Dollar Slides on Trade Truce Hopes & Fed Outlook
The U.S. dollar dropped 0.4%—its lowest level since April 22—after President Trump signaled flexibility on a July 8 trade deadline and U.S.–China talks showed renewed progress, boosting expectations for Fed rate cuts
📊 S&P Shiller CAPE Hints at Overvaluation Risk
Stocks and bonds rallied following rebound, but valuation metrics flash caution: the S&P 500 now sits in the 94th percentile of Shiller CAPE, and equity risk premium has dropped to zero. Analysts warn these levels often precede corrections
🛢️ Oil Holds at Seven-Week Highs
Oil prices remain near seven-week highs (~$66–67/barrel), supported by gradual OPEC+ output increases and hopes that easing trade tensions will aid demand
📈 CPI Cools Again, Bonds Climb
U.S. consumer inflation rose just 0.1% in May (2.4% YoY), easing expectations for tighter Fed policy. Consequently, Treasury yields softened and bond markets outperformed equities
📊 Key Data Releases 📊
📅 Thursday, June 12:
8:30 AM ET – Producer Price Index (May)
An early gauge of inflation at the wholesale level—may reinforce the cooling trend seen in CPI.
8:30 AM ET – Initial & Continuing Jobless Claims
Weekly updates on unemployment filings. Key to monitor for labor-market tightening or softening.
⚠️ Disclaimer:
This report is for educational and informational purposes only—it does not constitute financial advice. Always consult a licensed financial advisor before making investment decisions.
📌 #trading #stockmarket #economy #news #trendtao #charting #technicalanalysis
SPY SHORT FROM RESISTANCE|
✅SPY went up to retest
A horizontal resistance of 610$
Which is also an All-Time-High
So its a very strong level
Which makes me locally bearish biased
And I think that we will see a pullback
And a move down from the level
Towards the target below at 596.43$
SHORT🔥
✅Like and subscribe to never miss a new idea!✅
Disclosure: I am part of Trade Nation's Influencer program and receive a monthly fee for using their TradingView charts in my analysis.

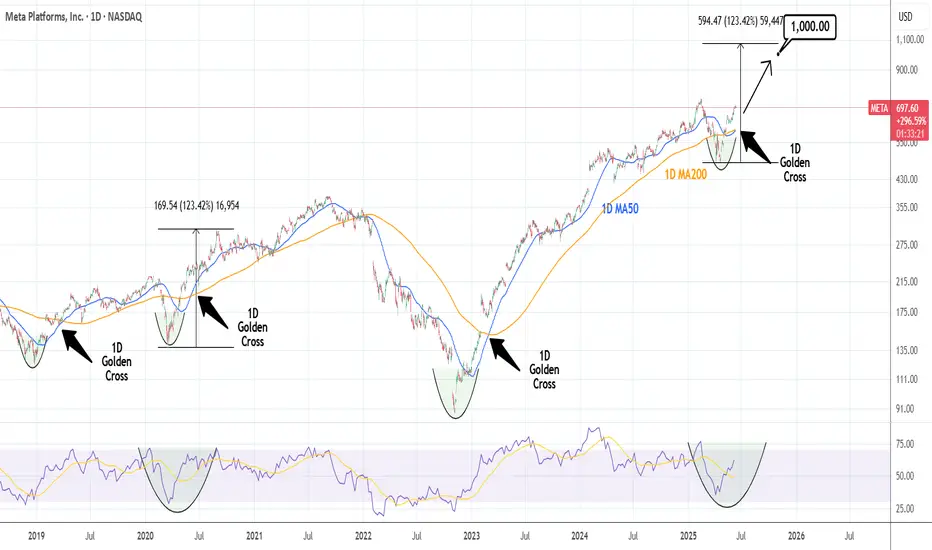
META: Close to a 1D Golden Cross. Strong buy.META is almost overbought on its 1D technical outlook (RSI = 69.797, MACD = 30.360, ADX = 40.237) but is about to form a 1D Golden Cross, the first such pattern since March 1st 2023, which was a little after the November 2022 market bottom. The market technically thrives on such conditions and since 2019, the 3 Golden Cross patterns that were formed were bullish continuation formations. Based on the 1W RSI, the current Golden Cross might be more similar with the June 2nd 2020 Golden Cross that was formed after the COVID crash. It rose by +123.42% before pulling back to the 1D MA200 again, so we remain bullish on META with TP = 1,000.
## If you like our free content follow our profile to get more daily ideas. ##
## Comments and likes are greatly appreciated. ##
VERIZON will run up to $130It's not me
it's the chart that says it will
#HVF
#HuntVolatiltyFunnel
@FrancisHunt-TheMarketSnipe
@TheMarketSniper
@TheCryptoSniper

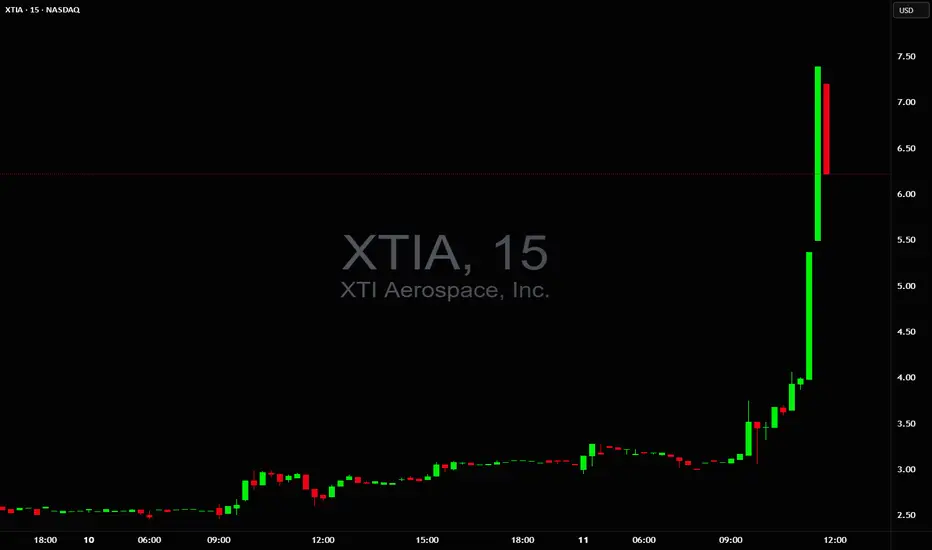
Just crazy $XTIA in minutesFrom halt to halt, doubling on power volume. It started the year at $60 seems like traders are looking at that as they're buying into vertical.
NQ (Nasdaq) Futures Trading Levels [6/11/25]For Day Traders, here's some trading levels for NQ Futures Trading for today. It's CPI day, so we should get some nice swings today. Trade carefully and trade smart!

ELI LILLY Is starting its next big rally.Eli Lilly (LLY) is about to test its 1W MA50 (blue trend-line) following a rebound just below the 1W MA100 (green trend-line). The latter, has been the ultimate market Support since May 2018 (last time it broke below it).
The overall correction since the July 15 2024 High seems like a Bull Flag pattern, no different than all the others after 2018 which only served as healthy rebalancing of an overbought price action.
Based on he 1W RSI in particular and the Bullish Divergence it displayed, the current Bull Flag resembles more the March - October 2019 pattern. Both that and the next one reached their 2.0 Fibonacci extensions.
As a result, our long-term Target on LLY is just below the 2.0 Fib at $1300.
-------------------------------------------------------------------------------
** Please LIKE 👍, FOLLOW ✅, SHARE 🙌 and COMMENT ✍ if you enjoy this idea! Also share your ideas and charts in the comments section below! This is best way to keep it relevant, support us, keep the content here free and allow the idea to reach as many people as possible. **
-------------------------------------------------------------------------------
💸💸💸💸💸💸
👇 👇 👇 👇 👇 👇

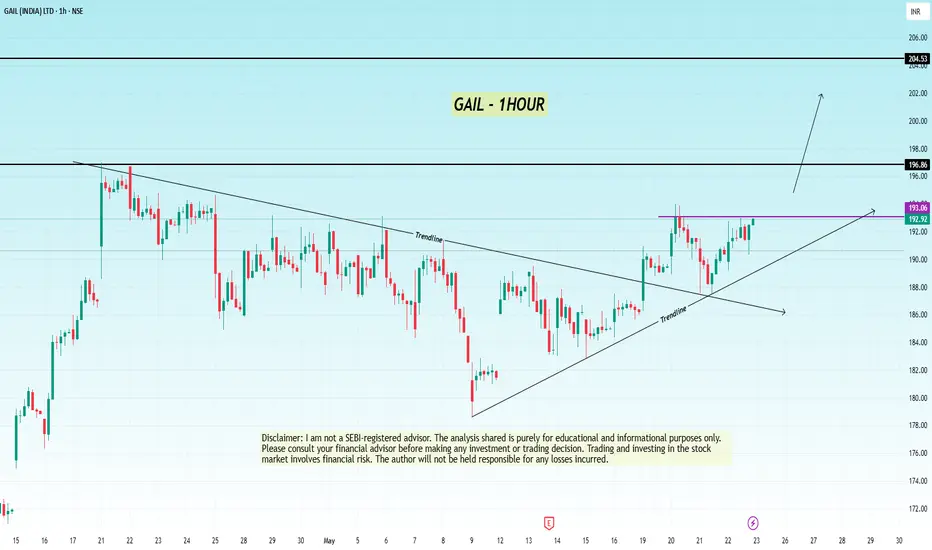
GAIL 1H Chart Analysis (Trendline Breakout Setup)NSE:GAIL GAIL 1H Chart Analysis (Trendline Breakout Setup)
The 1-hour chart of GAIL (India) Ltd shows a clean descending trendline breakout followed by higher lows, indicating strength building up. The price is consolidating just below a horizontal resistance around ₹193, forming a potential ascending triangle pattern.
Trendline Breakout:
Price has broken a long-standing descending trendline.
Retest and higher lows have followed the breakout, showing bullish intent.
Ascending Triangle Pattern:
Horizontal resistance near ₹193 is tested multiple times.
Rising trendline support suggests buyers are becoming aggressive.
Volume Confirmation Needed:
A breakout above ₹193.10 with volume would validate the bullish setup.
Trade Setup:
Buy Entry: Above ₹193.10 (confirmed breakout
Stop Loss: Below ₹190.00 (below rising trendline) CLOSING BASIS
Target 1: ₹196.85 (resistance zone)
Target 2: ₹204.50 (swing high)
The combination of trendline breakout and ascending triangle formation indicates a strong bullish continuation setup. Entry above ₹193.10 is ideal after confirmation, with targets up to ₹204 and risk well-managed below ₹190.
Disclaimer: I am not a SEBI-registered advisor. The analysis shared is purely for educational and informational purposes only. Please consult your financial advisor before making any investment or trading decision. Trading and investing in the stock market involves financial risk. The author will not be held responsible for any losses incurred.
@thetradeforecast
NSE:GAIL NSE:NIFTY
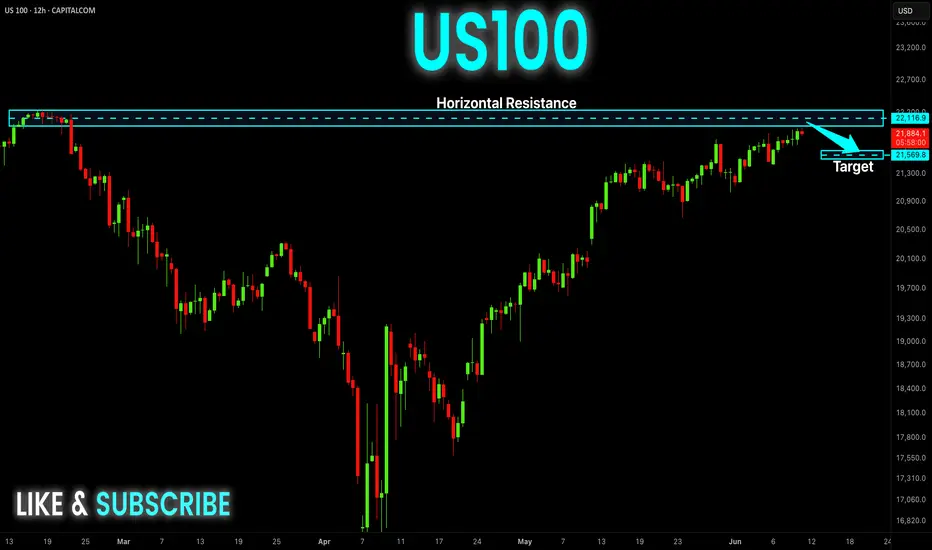
US100 Local Short! Sell!
Hello,Traders!
US100 keeps growing but
The index will soon hit a
Horizontal resistance
Of 22,243 so after the
Retest we will be expecting
A local pullback and a
Local move down
Sell!
Comment and subscribe to help us grow!
Check out other forecasts below too!
Disclosure: I am part of Trade Nation's Influencer program and receive a monthly fee for using their TradingView charts in my analysis.
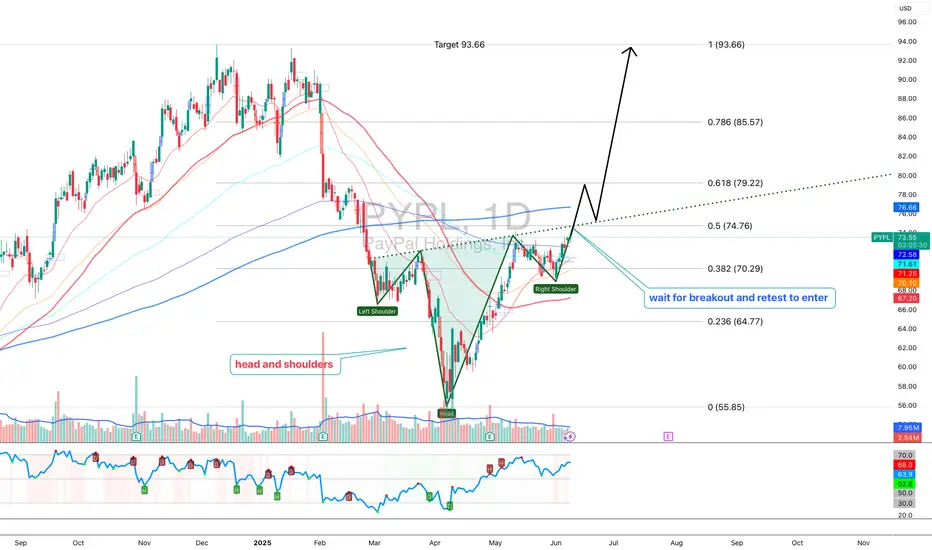
PayPal: Rebound or Rerun?PayPal in 2025: A breakout with backbone or just another spineless fintech?
PayPal is still in the rehabilitation ward after its fall from grace in 2021. Management drama, growth slowdown — the full fintech fatigue package. But something has shifted behind the scenes. A new CEO is cutting costs, AI integration is being whispered about, and earnings have started to surprise again. Wall Street pretends not to notice — but volume tells a different story.
Technically, we’re looking at a well-formed inverse head and shoulders. The neckline stretches from $72.00 to $74.76, aligning with the 0.5 Fibonacci level. A confirmed breakout above this zone opens the path to a clear target at $93.66 — the 1.0 Fibonacci extension. Multiple EMA clusters and strong pattern symmetry reinforce the setup. But no fairy tales here: the real entry comes after a retest. Without confirmation, it’s just another pretty formation for chart enthusiasts.
Nightly $SPY / $SPX Scenarios for June 11, 2025🔮 Nightly AMEX:SPY / SP:SPX Scenarios for June 11, 2025 🔮
🌍 Market-Moving News 🌍
🤝 Cautious Optimism on U.S.–China Trade Progress
Markets responded positively to fresh developments in ongoing U.S.–China trade talks, with S&P 500 and Nasdaq closing ~0.6% higher — the third straight day of gains — on hopes of easing trade barriers
📉 Treasury Yields Climb as Auction Approaches
Bond investors grew cautious ahead of a key Treasury debt auction and incoming U.S. inflation data. The 10-year yield stayed elevated, weighing modestly on equities .
💹 Global Markets Showing Resilience
Asian and European markets tracked U.S. gains midweek, driven by trade-talk optimism, despite lingering concerns over slower global growth and debt levels .
📊 Key Data Releases 📊
📅 Wednesday, June 11:
(No major U.S. releases — focus remains on market reactions to trade talks and Treasury auctions.)
⚠️ Disclaimer:
This information is for educational and informational purposes only and should not be construed as financial advice. Always consult a licensed financial advisor before making investment decisions.
📌 #trading #stockmarket #economy #news #trendtao #charting #technicalanalysis

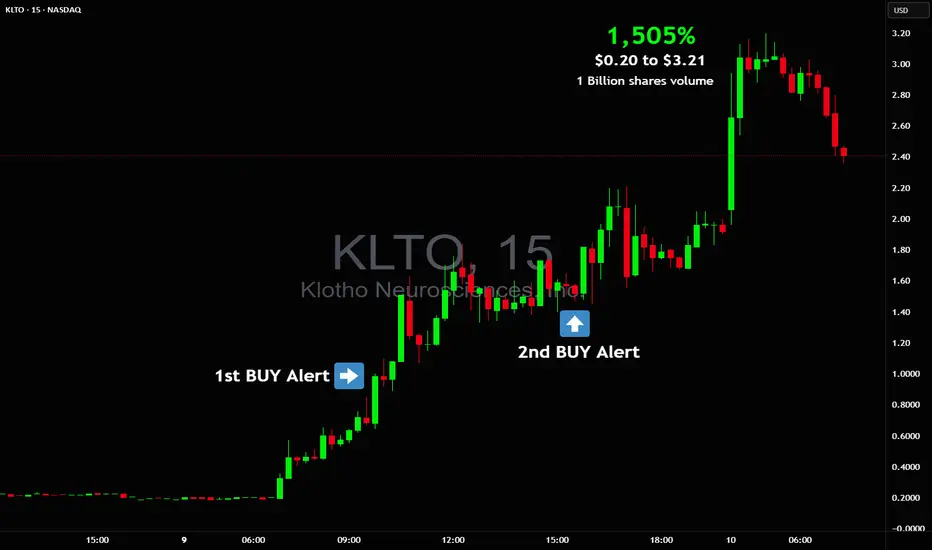
1,505% from $0.20 to $3.21 on massive 1+ Billion volume $KLTOWOW 🤯 1,505% from $0.20 to $3.21 on massive 1+ Billion shares traded 🚀 NASDAQ:KLTO
I sent out 2 Buy Alerts for everyone to get paid nicely ✅
This will trigger more runners, premarket already got movers NASDAQ:MEGL , NASDAQ:MRIN , NASDAQ:EVGN