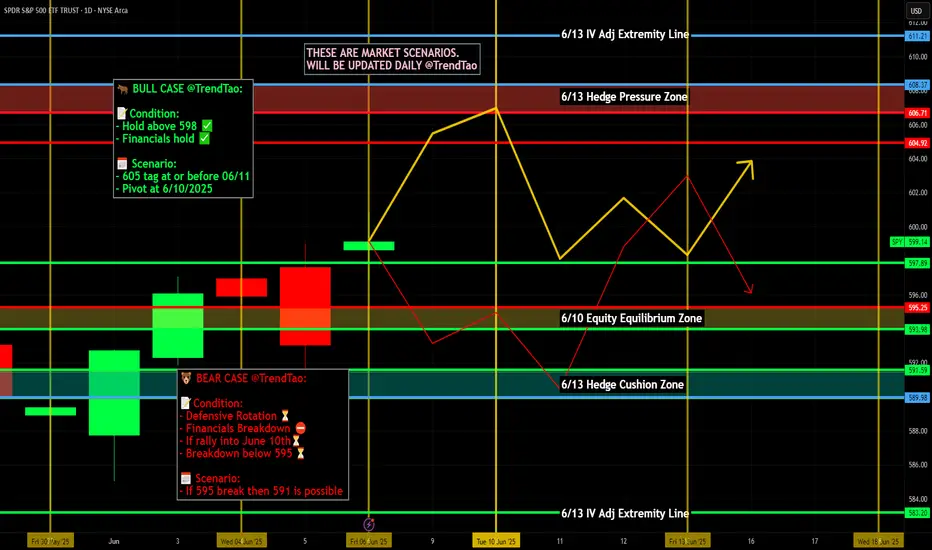
Nightly $SPY / $SPX Scenarios for June 10, 2025🔮 Nightly AMEX:SPY / SP:SPX Scenarios for June 10, 2025 🔮
🌍 Market-Moving News 🌍
📱 Apple Disappoints at WWDC Keynote
Apple ( NASDAQ:AAPL ) faced criticism after a lackluster WWDC keynote. Major AI and Siri upgrades were delayed, prompting a 1–1.5% drop in Apple shares—the weakest move during today's presentation
🎮 GameStop to Report Q1, Crypto Pivot in Focus
GameStop ( NYSE:GME ) is scheduled to announce Q1 earnings after market close. Investors will be watching for updates on its $500M Bitcoin allocation and potential crypto-related strategies
📈 Small-Business Optimism Rises
The NFIB Small Business Optimism Index for May came in at 95.9—above the 94.9 consensus—showing modest improvement in sentiment among small firms
📊 Key Data Releases & Events 📊
📅 Tuesday, June 10:
6:00 AM ET – NFIB Small Business Optimism (May):
A reading above expectations could boost risk market sentiment by showing stronger Main Street confidence.
⚠️ Disclaimer:
This is for educational/informational purposes only and does not constitute financial advice. Please consult a licensed professional before making investment decisions.
📌 #trading #stockmarket #economy #news #trendtao #charting #technicalanalysis
Stocks!
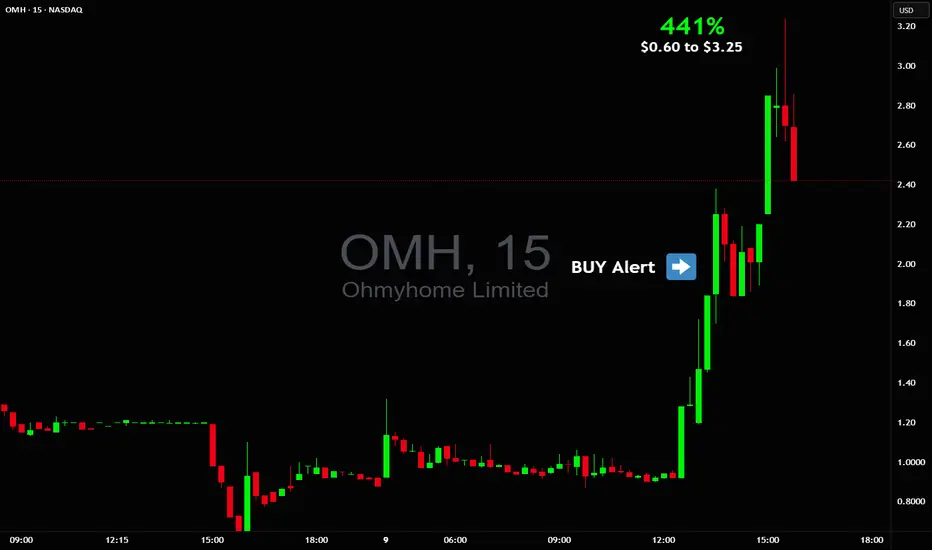
BIG 441% Monday from $0.60 to $3.25 $OMH🔥 BIG 441% Monday from $0.60 to $3.25
Easiest money made today was on NASDAQ:OMH buy before halt, then once it came out of halt it was just gapped up into 💸💸💸
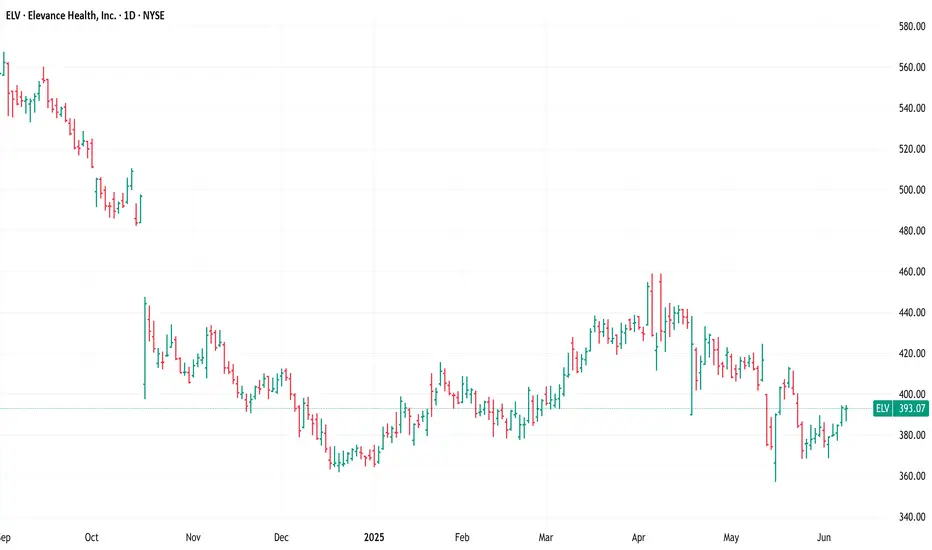
$ELV, Long, TP>10-15%NYSE:ELV , Long, TP>10-15%
Fundamentally the stock is good.
Choose an entry point and do not forget about a protective order if you are trading with leverage.
Don't risk it if you're not sure.
Good luck to everyone.
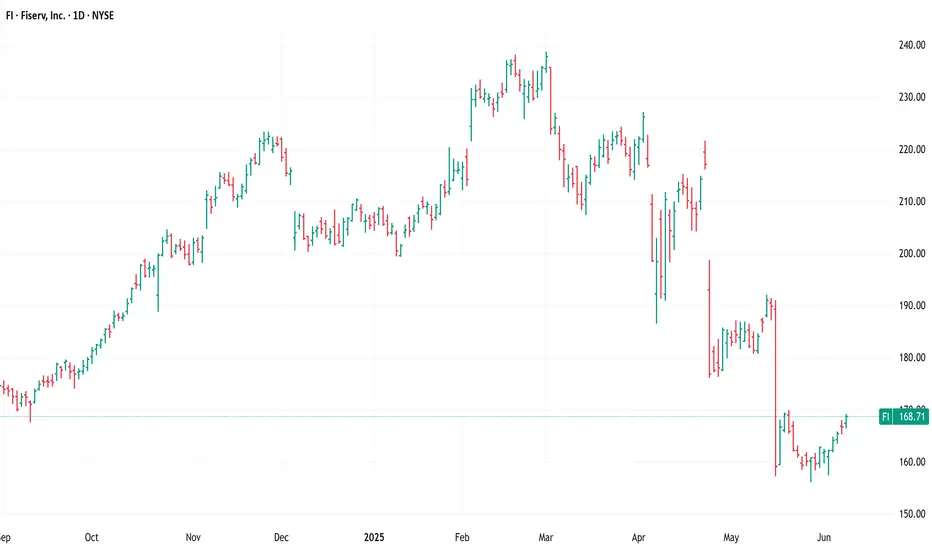
$FI, Long, TP>15-20%NYSE:FI , Long, TP>15-20%
Fundamentally the stock is good.
Choose an entry point and do not forget about a protective order if you are trading with leverage.
Don't risk it if you're not sure.
Good luck to everyone.
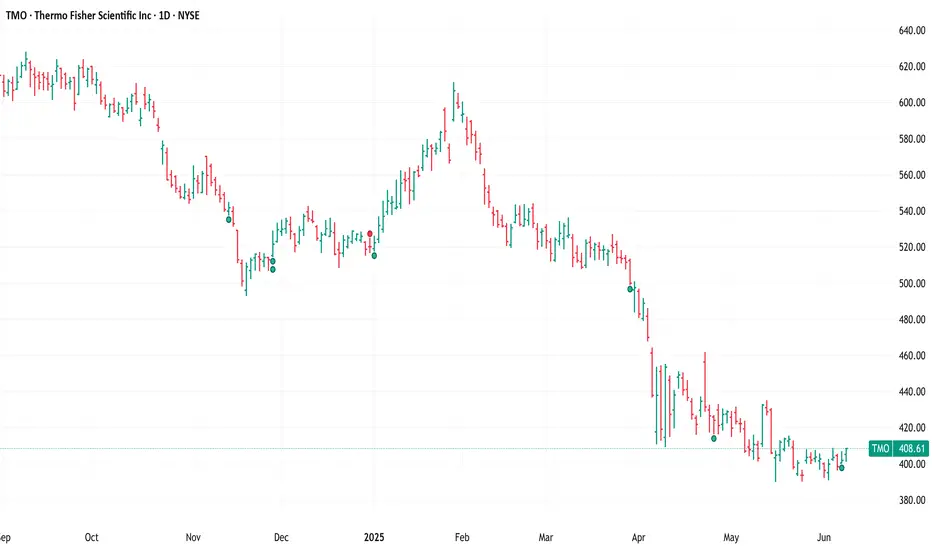
$TMO, Long, TP>15-25%NYSE:TMO , Long, TP>15-25%
Fundamentally the stock is good.
Choose an entry point and do not forget about a protective order if you are trading with leverage.
Don't risk it if you're not sure.
Good luck to everyone.
Review and plan for 10th June 2025 Nifty future and banknifty future analysis and intraday plan.
Positional ideas.
This video is for information/education purpose only. you are 100% responsible for any actions you take by reading/viewing this post.
please consult your financial advisor before taking any action.
----Vinaykumar hiremath, CMT

Apple (AAPL) Shares Consolidate Ahead of WWDCApple (AAPL) Shares Consolidate Ahead of WWDC
Today, 9 June, marks the start of Apple’s Worldwide Developers Conference (WWDC) — an event that traditionally attracts significant attention from investors and traders.
It is fair to say that WWDC 2025 begins against a rather negative backdrop:
→ Since the start of 2025, AAPL stock price has fallen by 19%, and Apple has lost its title as the world’s most valuable company, now trailing behind Microsoft and Nvidia.
→ Expectations raised by last year’s conference — particularly regarding new AI features in the iPhone — were not fully realised. As Barron’s noted, in March, an Apple spokesperson admitted that the new Siri “will take longer than we thought to implement these features. We expect to roll them out next year.”
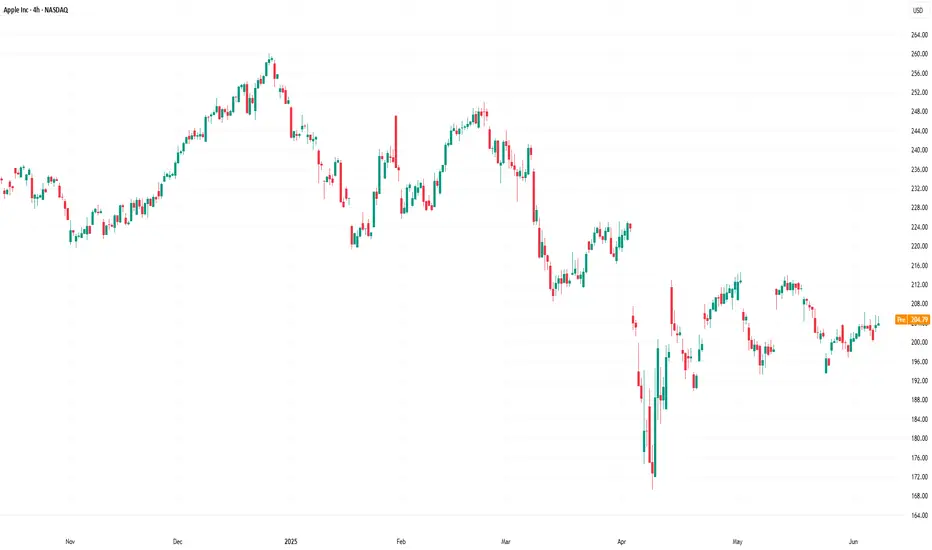
Technical Analysis of the AAPL Chart
AAPL price movements are forming a narrowing triangle pattern:
→ The red trendline highlights sustained downward pressure on AAPL shares in 2025 — partly driven by concerns over the impact of the ongoing trade war;
→ On the other hand, the area below the psychological $200 level may attract buyers willing to take on risk.
WWDC 2025 could well provide fresh hope for the bulls and prompt an attempt to break out upwards from the triangle pattern.
This article represents the opinion of the Companies operating under the FXOpen brand only. It is not to be construed as an offer, solicitation, or recommendation with respect to products and services provided by the Companies operating under the FXOpen brand, nor is it to be considered financial advice.
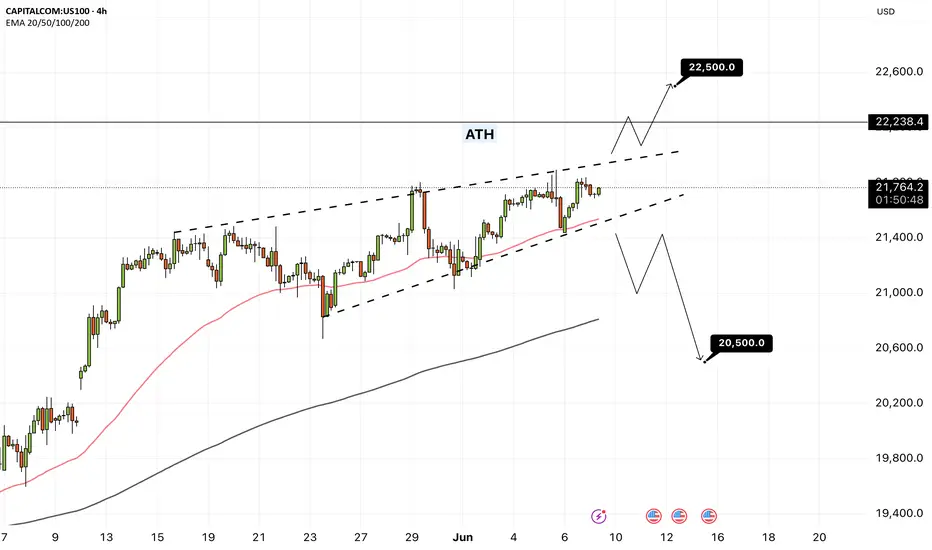
NAS100 - Will the stock market reach its previous ATH!?The index is above the EMA200 and EMA50 on the 4-hour timeframe and is trading in the specified pattern. In case of a valid break of this range, I expect a new trend to form. It is better to wait for confirmation on the break in order to control further risk.
U.S. President Donald Trump announced that an American delegation will meet with Chinese representatives in London on June 9 to discuss a potential trade agreement. In a post on Truth Social, Trump stated, “I’m pleased to announce that Treasury Secretary Scott Bessent, Commerce Secretary Howard Lutnick, and U.S. Trade Representative Jamieson Greer will meet with Chinese officials on Monday, June 9, 2025, in London to discuss a trade deal.” He added that he expects the meeting to go “very well.” U.S. stock markets rose on Friday, and Chinese markets are now following suit. The Hang Seng Index has reached its highest level since March.
Meanwhile, Amazon has completely halted its hiring budget for office workers in its core retail business. This decision applies only to white-collar staff and excludes warehouse employees and those in its cloud computing division. According to Business Insider, which cited internal company emails, the hiring freeze affects Amazon’s online marketplace, logistics operations, and grocery business.
Having doubled its workforce between 2019 and 2021 to 1.6 million, Amazon reduced that number to 1.55 million last year. Since late 2022, the e-commerce giant has laid off at least 27,000 employees.
This move comes as the U.S. jobs report released Friday helped ease some concerns, though signs of broader economic challenges remain. Experts suggest that such a hiring freeze could reflect broader economic trends—where mass layoffs are avoided, but hiring slows down significantly.
In May, the U.S. economy added 139,000 jobs, down from 147,000 in April. The unemployment rate remained steady at 4.2%, staying within the narrow range it has held over the past year. The labor market has remained resilient, dismissing fears that tariffs would cause a significant slowdown. So far, tariff-related disruptions have not been severe enough to destabilize the job market—at least not in May.
Data indicates that employers continue to refrain from layoffs, even as hiring has slowed considerably compared to the post-pandemic surge. Labor market analysts expect signs of weakness to emerge in the coming months, as businesses become more cautious about hiring due to uncertainty surrounding tariffs—according to recent surveys. For now, however, the labor market remains strong.
The absence of red flags in employment may give the Federal Reserve more room to maintain its patient stance on interest rate cuts. This year, Fed officials have kept interest rates higher than average to curb inflation by increasing borrowing costs. The Fed’s dual mandate is to keep inflation low and employment high, and it may opt to cut rates to stimulate the economy if the labor market weakens.Fed Chair Jerome Powell and other FOMC members have said they are waiting to see whether President Trump’s trade wars will stoke inflation, trigger job losses, or both. So far, neither scenario has materialized. Strong labor market data may give them further justification to stay in wait-and-see mode. Rosner wrote, “Given the Fed’s sharp focus on inflation risk management, today’s stronger-than-expected jobs report is unlikely to alter its patient approach. We expect the Fed to remain on hold at this month’s meeting and believe further deterioration
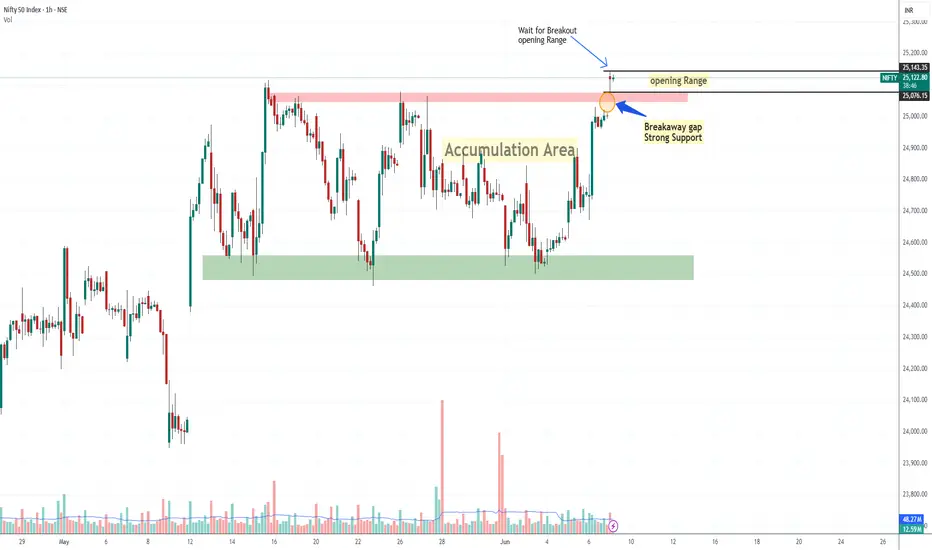
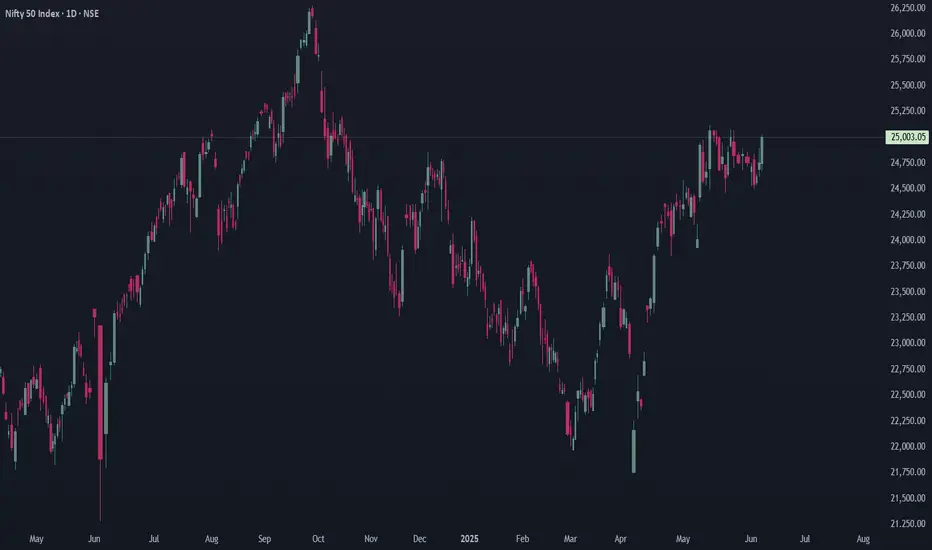
Nifty Gave Breakaway Gap Strong Bullish SignalWhat is Breakaway GAP?
A breakaway gap refers to the situation in the market where there is a strong price movement that crosses support or resistance. Breakaway gaps are formed after substantial periods of consolidation of prices in the market. It signifies a break from the previous trading range or pattern, and it suggests that a new trend or direction is emerging.
Nifty was trading in a range for 5 days and today 6/09/2025 it gap up and sustained above 25000 crucial level, the importance of break-away gap is that it's very strong sign of bullishness in market this also strong support too so if nifty come to retrace it would become support around 25000 level,
if nifty break today opening rang then it's very likely that it will go further so there are possibly Two entry Sign for Long: - first, OR breakout, second: -retracement on 15 Min chart near 20 Ema -50 Ema. Thats My opinion
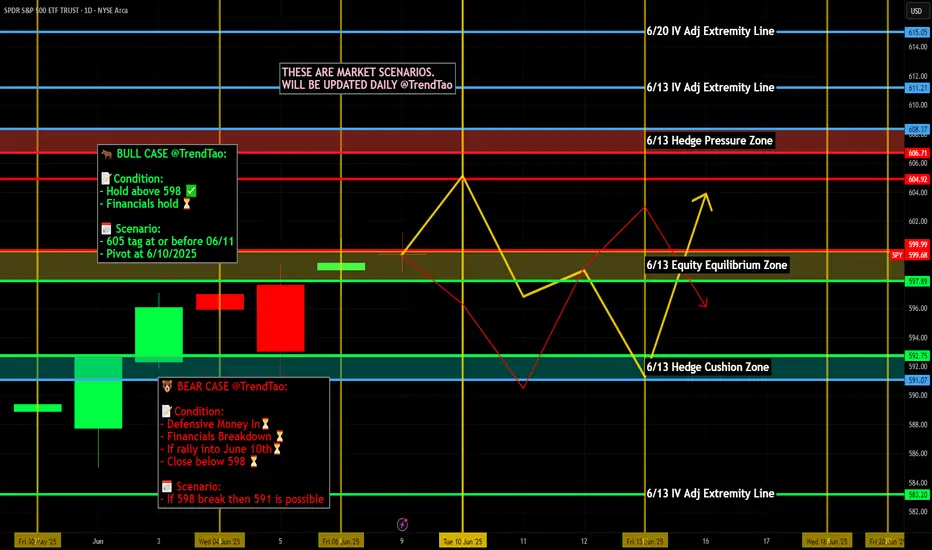
Weekly $SPY / $SPX Scenarios for June 9–13, 2025 🔮 Weekly AMEX:SPY / SP:SPX Scenarios for June 9–13, 2025 🔮
🌍 Market-Moving News 🌍
📱 Apple WWDC & Tech Momentum
Apple’s annual Worldwide Developers Conference kicks off Monday with CEO Tim Cook set to discuss new products, services, and likely AI initiatives—tracks should watch include impacts on NASDAQ:AAPL and AI-related stocks
🧨 GameStop Eyed for Crypto Pivot
GameStop (a meme-stock darling) reports earnings Tuesday. Markets are watching for updates on its $500M bitcoin investment and potential pivot toward crypto-driven revenue streams
🇨🇳 U.S.–China Trade Talks in London
High-level trade dialogue begins Monday between U.S. and Chinese representatives in London, offering possible relief to trade tensions and providing a lift to risk assets
📉 Key Inflation Data Midweek
Wednesday brings the May CPI release—crucial for assessing tariff-driven inflation trends and likely to influence Fed policy outlook ahead of next month’s meeting
💹 Oil Markets React to Trade Uncertainty
Oil prices are stable to slightly up ahead of trade talks, as Brent holds around $66/barrel—reflecting balanced supply concerns and hopes for easing global tensions
🌐 G7 Summit and Global Policy Risks
G7 finance ministers convene in Canada (50th anniversary), tackling trade strains, Russia–Ukraine, and inflation. Global macrospoilers could trigger renewed volatility
📊 Key Data Releases & Events 📊
📅 Monday, June 9
Apple WWDC begins (CEO keynote)
U.S.–China trade talks start in London
📅 Tuesday, June 10
GameStop Q2 earnings (+ bitcoin update)
NFIB Small Business Index (6:00 AM ET)
📅 Wednesday, June 11
8:30 AM ET – Consumer Price Index (May)
Watch for inflation signal from tariffs.
8:30 AM ET – Core CPI (May)
Core inflation trend under scrutiny.
📅 Thursday, June 12
8:30 AM ET – Producer Price Index (May)
Early check on wholesale inflation
8:30 AM ET – Initial & Continuing Jobless Claims
📅 Friday, June 13
10:00 AM ET – University of Michigan Consumer Sentiment (June, preliminary)
Consumer mood and tariff impact insights
⚠️ Disclaimer:
This is for informational/educational purposes only. Not financial advice. See a licensed advisor before making investing decisions.
📌 #trading #stockmarket #economy #news #trendtao #charting #technicalanalysis
Stocks & ETF : Breaking out and Ready for Massive Bull runBelow is the list of stocks and ETFs that are in the early stage of breakout with ultra volume level. Good time to buy.
NSE:SCHNEIDER
NSE:ASAHIINDIA
NSE:HINDZINC
NSE:ABREL
NSE:TATAINVEST
NSE:UJJIVANSFB
NSE:PNBHOUSING
NSE:BANDHANBNK
NSE:DLF
NSE:ICICIGI
NSE:IDFCFIRSTB
NSE:SHRIRAMFIN
NSE:AUTOBEES
NSE:INDUSINDBK
NSE:ABB
NSE:TATACHEM
NSE:GODREJPROP
NSE:SIGNATURE
NSE:JPPOWER
NSE:HFCL
HOOD (Robinhood) - Price Above Bollinger Band and Shooting StarsHOOD (Robinhood) stock price has been in an uptrend since May 2025.
Recent fundamentals such as corporate earnings, EPS, Revenue, Acquisitions have been good in Q2 2025.
However currently, HOOD price has printed 2 shooting stars above the upper bollinger band and linear regression lines (blue arrow).
Potential selling and profit-taking could occur, especially if there is a significant bearish catalyst or news in the stock market.
A -4% or -8% move selloff could occur over time if the price gaps up to an overextended level too fast, such as $80 to $85.
Both the weekly and daily charts are starting to show bearish divergence so I am watching both the technicals and fundamentals this month.

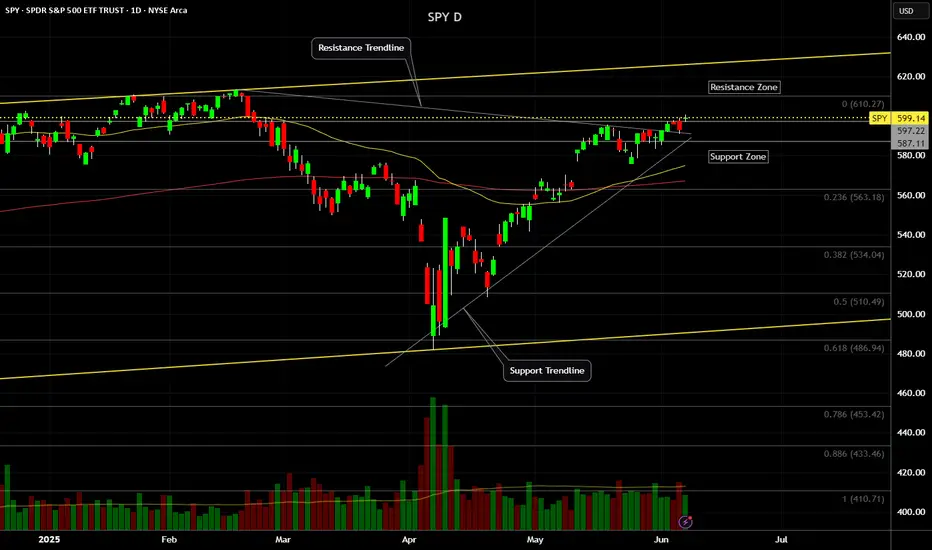
SPY (S&P500 ETF) - Price Attempting Breakout Above ResistanceSPY (S&P500 ETF) price is attempting to breakout above Daily resistance levels of $594 and $597.
SPY ETF has been in an uptrend since May 2025. A Golden Cross also occured on May 19th 2025, signaling that a potential longer term bullish rally could occur.
Friday's candle closed as a Doji signaling some potential indecision after recent price volatility.
SPY price is not at any extreme level on the Daily chart.
If SPY price ever gaps up and rallies up to the $612 to $620 resistance zone, price could sell off stronger (short-term).
In June 2025, trade deal and inflation news will most likely be the catalyst for further volatility, in addition to government news announcements.
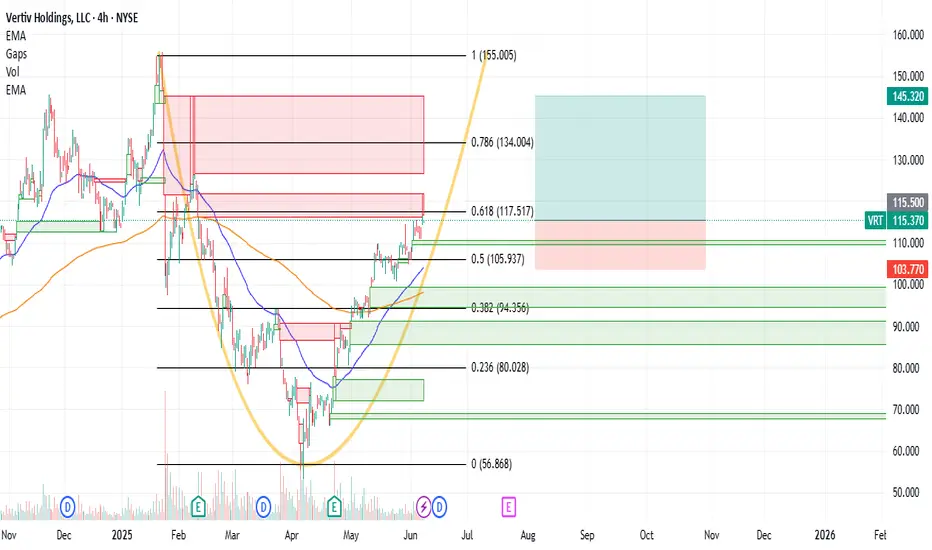
VRT : Long Position Vertiv Holdings is trading above the 50 and 200-period moving averages.
It has overcome the resistances one by one without being exposed to a very high IV.
It has started to draw a cup.
However, it is much better to focus on the big gap rather than the cup formation because with good chances it can encounter a big resistance there.
Targeting the 50-period ema and the 0.5 level of the short-term Fibonacci retracement levels as a stop point gives us the opportunity to try trading at a not bad risk/reward ratio.
With a small position size or small portfolio percent :
Risk/Reward Ratio : 2.54
Stop-Loss : 103.77
Take-Profit : 145.32
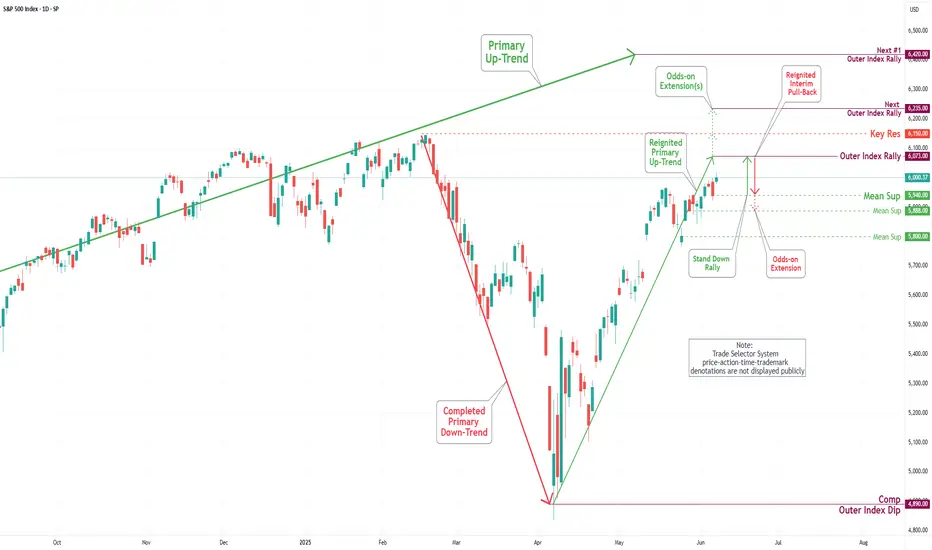
S&P 500 Daily Chart Analysis For Week of June 6, 2025Technical Analysis and Outlook:
The S&P 500 Index has demonstrated an upward trajectory during this week's trading session, surpassing the established Outer Index Rally level of 5955 and the Key Resistance level of 5965. Currently, the index is exhibiting a bullish trend, with a focus on the Outer Index Dip target, set at 6073. Furthermore, additional critical levels have been identified, including Key Resistance at 6150 and the Next Outer Index Rally at 6235. Conversely, there is a potential decline in index prices from the current level or upon completion of the Outer Index Dip 6073, which may lead to a retest of the Mean Support at 5940, with the possibility of extending the pullback to the Mean Support at 5888.
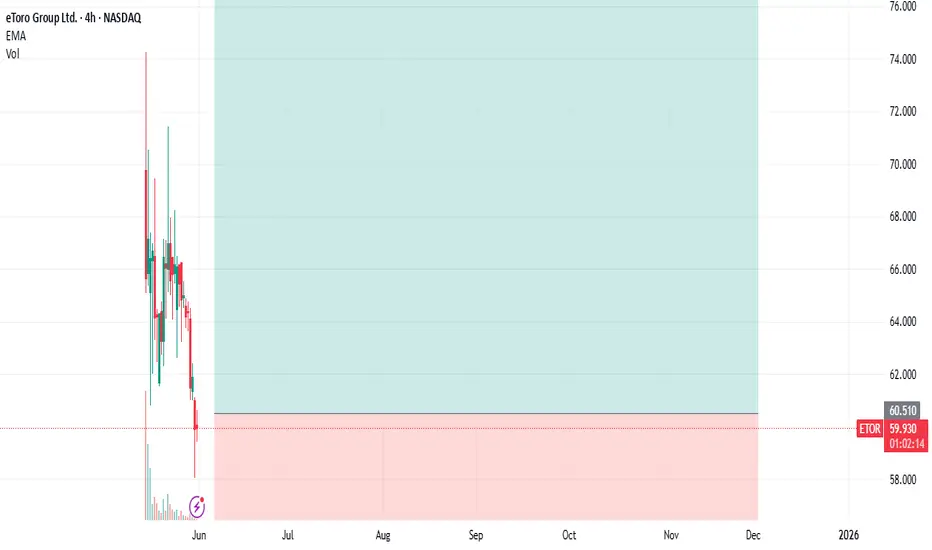
ETOR : Entry after IPOKind of social trading platform.
Etoro Platform also uses artificial intelligence.
I researched that it also allows trading of crypto assets.
$10B SPAC initiative canceled in 2022.
We re approaching mid 2025 .
Current market cap: around $5-5.3B.
Ground for progress may be present in good market conditions.
While institutions bought at $52, individuals were most likely able to buy above $70.
This was a great misfortune.
Very high opening of the IPO caused sharp sales, but holding for the medium term may be beneficial.As I briefly mentioned above, parameters that will bring momentum to stock may occur.
Constantly looking at the screen so much in such instruments can create a huge sense of panic and failure.
Target price: 90.00 - 94.00
Stop: 50.00
Amount: 1/3 of your portfolio's financial technology stocks ( e.g)
Risk - Reward Ratio > 2.80
Regards.
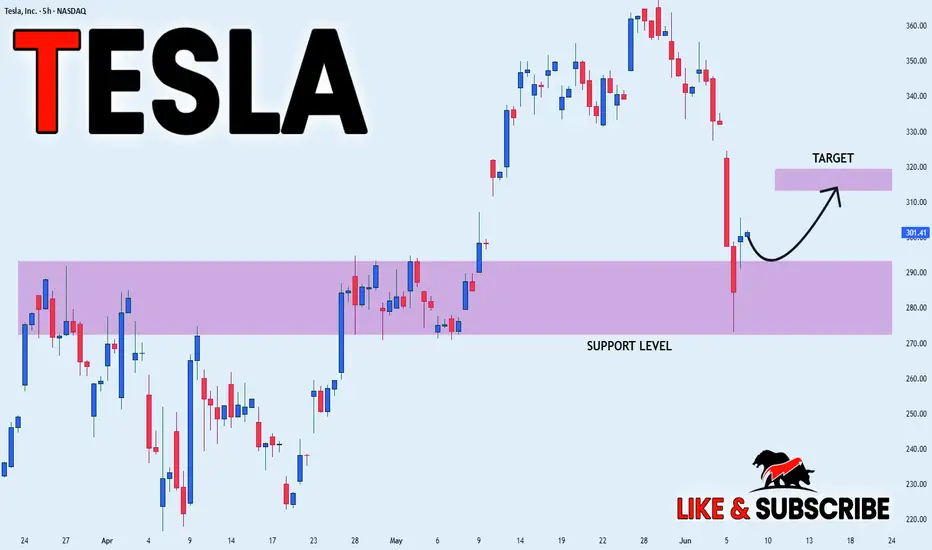
TESLA RECOVERY AHEAD|LONG|
✅TESLA lost more than 25%
On the Elon VS Trump fallout
In less than a week which is
Seen by many as an excellent
Opportunity to add TESLA stocks
To their portfolios with a great
Discount which is why we are
Already seeing a nice rebound
From the wide strong horizontal
Support just above 270$ level
And as we are locally bullish
Biased we will be expecting
Further growth on Monday
LONG🚀
✅Like and subscribe to never miss a new idea!✅
Disclosure: I am part of Trade Nation's Influencer program and receive a monthly fee for using their TradingView charts in my analysis.
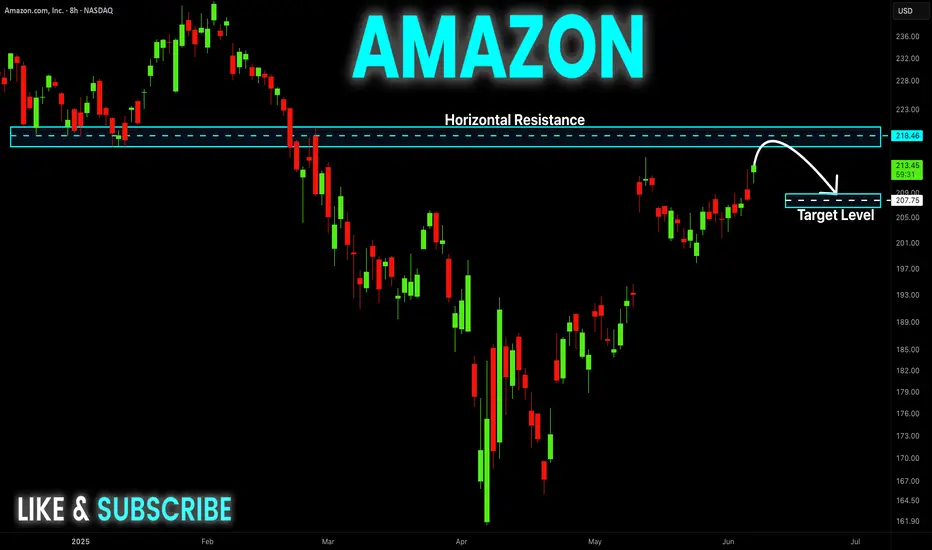
AMAZON Resistance Ahead! Sell!
Hello,Traders!
AMAZON keeps gaining
Bullish momentum so we
Are bullish biased mid-term
However it will soon hit a
Horizontal resistance of 219.00$
From where we will be expecting
A local bearish correction
Sell!
Comment and subscribe to help us grow!
Check out other forecasts below too!
Disclosure: I am part of Trade Nation's Influencer program and receive a monthly fee for using their TradingView charts in my analysis.
TESLA Is it a good buy after the Trump - Musk clash?Tesla (TSLA) lost $150 billion yesterday, closing the session down by -14%, following President Trump's public feud with its CEO Elon Musk. Trump responded to Musk' criticism over the new tax bill, claiming that Musk was upset because the bill takes away tax benefits for electric vehicle purchases.
The obvious question that arises for investors is this: Is Tesla still a buy?
Quick answer? Yes. And once the dust from the fundamentals/ news settles, the technical patterns will prevail.
The long-term pattern since the January 03 2023 bottom has been a Channel Up. The recent April 07 2025 Low has been a Higher Low on this pattern as, even though it didn't touch the Channel's bottom, it did triple bottom on the 0.236 Fibonacci Channel retracement level.
This kick-started the new Bullish Leg of the pattern and yesterday's correction may be nothing more than the start of a Bull Flag formation, similar to those that took place half-way through both previous Bullish Legs.
You can even see how similar the 1W RSI patterns are among the 3 fractals, which have been Accumulation Phases before the start of the 2nd part of the Bullish Leg.
Even though the 1.618 Fibonacci extension is a technical possibility, we can settle for a $600 Target, which would fulfil the conditions of keeping the price action within the Channel Up by the end of the year.
-------------------------------------------------------------------------------
** Please LIKE 👍, FOLLOW ✅, SHARE 🙌 and COMMENT ✍ if you enjoy this idea! Also share your ideas and charts in the comments section below! This is best way to keep it relevant, support us, keep the content here free and allow the idea to reach as many people as possible. **
-------------------------------------------------------------------------------
💸💸💸💸💸💸
👇 👇 👇 👇 👇 👇

Tesla Monthly TF (Next Target —110-140)I will not bore you with too many details. I will do an analysis based on the moving averages to support my bias, bearish at this point.
April 2024 tests EMA89 as support and this support level holds. This results in a bullish impulse.
The impulse ends December 2024. On the drop, TSLA founds support at EMA55 monthly. There is bounce at this level and this bounce ends as a lower high.
» When this happens, the next moving average in line gets tested, in this case EMA89 or a minimum of 191 as the next target.
EMA55 monthly sits at 229.88 (230). This level will fail as support, why? Because the test of it in March and April led to a lower high and this lower high will be followed by a lower low.
If TSLA had moved higher than December 2024, then any drop or correction would not go below EMA55. Since the action is ending as a lower high, then the next drop which is already underway will break through this level.
The main level for the current move sits around 110-140 based on the long-term. These levels are close to the lows in January 2023 and December 2022.
Technical analysis can help you predict a move regardless of its cause. Don't believe me? See the 'related publications'.
Thanks a lot for your continued support.
Namaste.

Tesla Daily, Update (Bearish Trend Extends)Today TSLA produced the highest bearish volume session since July 2020. This high volume and strong sellers pressure shows up to break EMA55, EMA89 and MA200 daily as support. Needless to say, this is a very strong bearish development.
The break of this long-term support comes after a major lower high. May 2025 much lower compared to December 2024.
My point is to alert you of a much stronger correction than expected on this stock. Now that MA200 has been lost as support, with the highest volume in five years after a strong lower high, we can expect the continuation of the bearish trend.
I will look at Tesla on the monthly timeframe in a separate publication.
Thank you for reading.
Namaste.

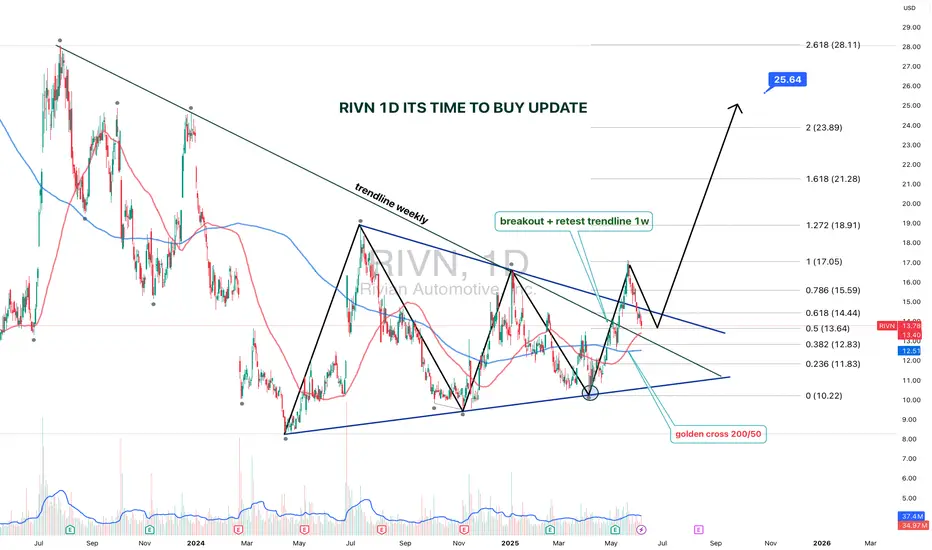
RIVN 1D — It’s Time to Buy: Setup UpdateThe setup on Rivian (RIVN) just got upgraded from “interesting” to “strategically significant.” We’re looking at a textbook symmetrical triangle that’s been developing since July 2023, with a clean breakout and retest on the weekly trendline.
The breakout was followed by a bullish retest, right at the intersection of the triangle base and the key trendline. Volume kicked in, price held — and that’s what smart money calls confirmation.
Now, the Golden Cross is live: the 50-day MA just crossed the 200-day MA from below. Price is confidently holding above both — momentum is shifting hard. Fibs from the bottom (10.22) to the last local top (17.05) project the first target at $17, and the extended Fibonacci confluence gives us $25.64 as a long-range goal (2.618 extension).
The weekly trendline — which acted as resistance for over a year — has flipped to support. Price action respects it, bulls are loading, and structure is clean.
This is not just a bounce. It’s a technical rotation from accumulation to expansion.
The time to talk about potential is over — price action has spoken.
Nightly $SPY / $SPX Scenarios for June 6, 2025 🔮 Nightly AMEX:SPY / SP:SPX Scenarios for June 6, 2025 🔮
🌍 Market-Moving News 🌍
🇺🇸 U.S. Labor Market in Focus
Investors are closely watching the upcoming May employment report, which is expected to show a gain of 125,000 jobs, down from 177,000 in April. The unemployment rate is anticipated to remain steady at 4.2%. These figures will provide insights into the labor market's response to recent economic pressures, including tariff impacts .
🇮🇳 RBI Expected to Cut Rates Amid Low Inflation
The Reserve Bank of India (RBI) is anticipated to announce a 25 basis point cut in the repo rate on June 6, marking the third consecutive reduction. This move aims to support economic growth amid persistent low inflation and global uncertainties .
📊 Key Data Releases 📊
📅 Friday, June 6:
8:30 AM ET – U.S. Employment Report (May):
Analysts expect non-farm payrolls to increase by 125,000, with the unemployment rate holding at 4.2%. Average hourly earnings are projected to rise by 0.3% month-over-month. These figures will be critical in assessing the health of the labor market and potential Federal Reserve policy actions .
3:00 PM ET – U.S. Consumer Credit (April):
The Federal Reserve will release data on consumer credit, with forecasts predicting an increase of $10 billion. This report will shed light on consumer borrowing trends and financial health .
⚠️ Disclaimer:
This information is for educational and informational purposes only and should not be construed as financial advice. Always consult a licensed financial advisor before making investment decisions.
📌 #trading #stockmarket #economy #news #trendtao #charting #technicalanalysis
