NEGG pushed up to over 100%. Why the fireNEGG pushed up to over 100%
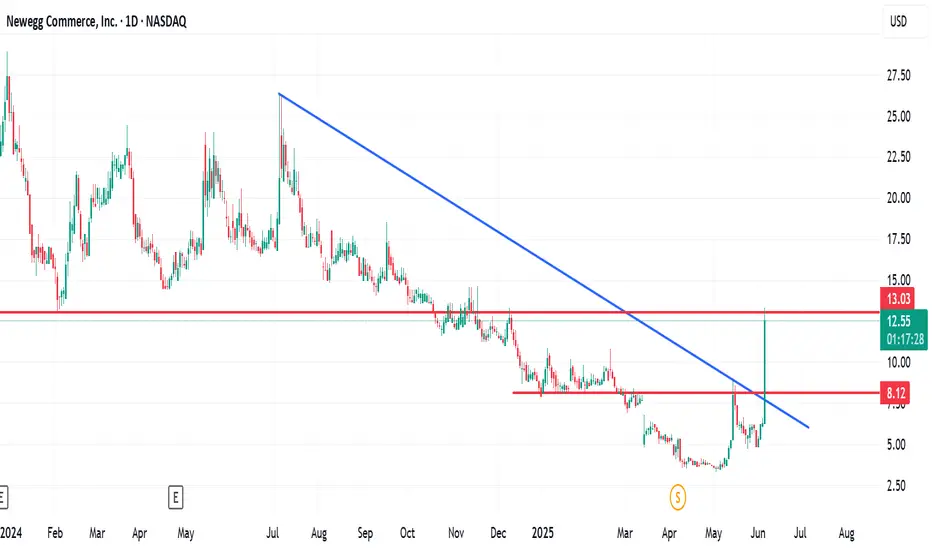
Newegg Commerce Inc. (NASDAQ: NEGG) experienced a significant surge in its stock price on June 5, 2025, with shares rising over 100% during the trading day.
The stock opened at $6.29 and reached an intraday high of $11.50, closing at $11.33, marking a substantial increase from the previous day's close.
The dramatic increase in NEGG's stock price appears to be driven largely by retail investor enthusiasm, reminiscent of previous "meme stock" phenomena.
Such surges are often fueled by social media discussions and speculative trading, rather than fundamental business developments. --- As said by Ainvestment
Stocks!
Kiniksa (KNSA) – Rare Disease Revenue & Pipeline Momentum Company Overview:
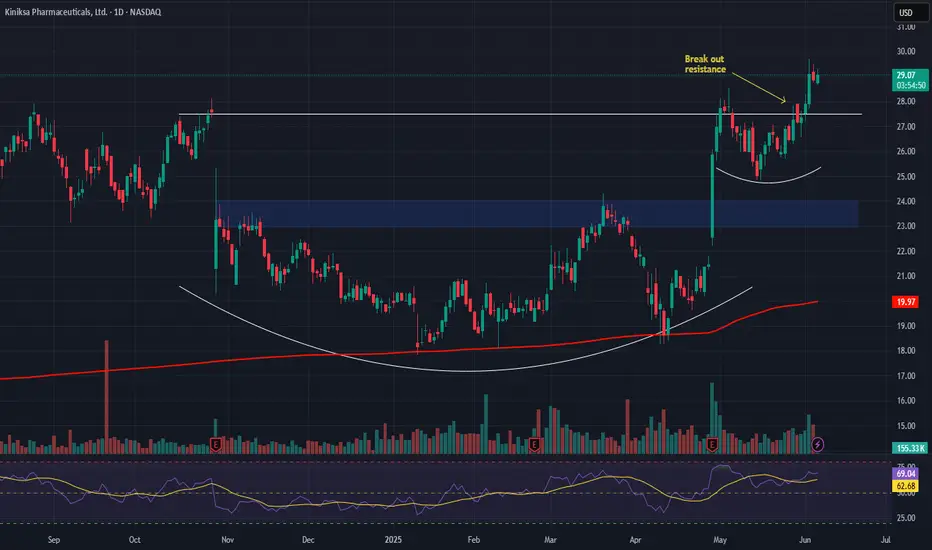
Kiniksa NASDAQ:KNSA is establishing itself as a high-growth biopharma player, with a sharp focus on autoimmune and inflammatory diseases. The company’s strategy is paying off through commercial execution and a robust, de-risked pipeline.
Key Catalysts:
🏆 Arcalyst Commercial Success
Core driver in recurrent pericarditis treatment
Delivering double-digit YoY revenue growth
Expanding potential in broader inflammatory indications
🧬 Deep Clinical Pipeline
KPL-404 (anti-CD40): Targets autoimmune diseases like lupus and rheumatoid arthritis
Mavrilimumab: Late-stage potential in rare inflammatory conditions
Orphan Drug & Breakthrough Therapy designations → accelerated approvals + exclusivity
📊 Strong Earnings Momentum
Recent beat on both revenue and EPS
Reinforces credibility in commercial & clinical execution
May attract institutional investors and technical breakout traders
Investment Outlook:
✅ Bullish Above: $23.00–$24.00
🎯 Target Price: $38.00–$40.00
📈 Thesis Drivers: Proven revenue engine (Arcalyst), high-potential pipeline, regulatory tailwinds, and institutional attention
🔬 Kiniksa is not just a clinical-stage story—it's a commercial growth engine with rare disease upside. #KNSA #BiotechStocks #RareDisease
Tesla (TSLA) Share Price Falls by 3.5%Tesla (TSLA) Share Price Falls by 3.5%
Yesterday, the share price of Tesla (TSLA) dropped by 3.5%, placing it among the five worst-performing stocks of the day in the S&P 500 index (US SPX 500 mini on FXOpen). Since the peak on 29 May, the decline now totals nearly 10%.
Why Tesla (TSLA) Shares Are Falling
Among the bearish factors are:
→ A drop in car sales in Europe. Sales in Germany fell by 36% year-on-year in May.
→ Growing competition from China. May deliveries from Tesla’s Chinese factory were down 15% year-on-year.
→ Elon Musk’s criticism of the US President’s proposed government spending bill.
Media reports also suggest that Musk took offence at staffing decisions at NASA, while Trump is reportedly losing patience with Musk over his attacks on the spending bill.
A potential rift between Musk and Trump could have far-reaching consequences — including for TSLA shares.
Technical Analysis of TSLA Stock Chart
Six days ago, we:
→ Drew an ascending channel (shown in blue), noting that the upper boundary could pose a challenge to further gains;
→ Highlighted the $355–$375 zone (shown in purple) as a possible resistance area;
→ Suggested a correction scenario following a roughly 27% surge in TSLA’s stock price during May.
Since then, the price has dropped towards the median line of the ascending channel. If this fails to offer sufficient support, the correction may continue towards the lower boundary of the channel, which is reinforced by support around the psychological $300 level and former resistance at $290.
News related to the planned rollout of Tesla’s robotaxi trials could significantly impact TSLA’s price movements in June.
This article represents the opinion of the Companies operating under the FXOpen brand only. It is not to be construed as an offer, solicitation, or recommendation with respect to products and services provided by the Companies operating under the FXOpen brand, nor is it to be considered financial advice.

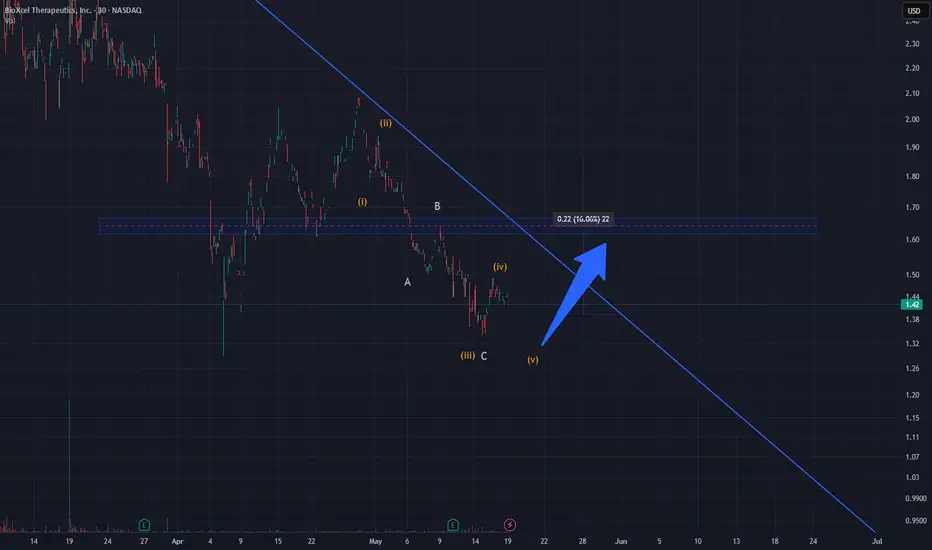
Ending Diagonal Complete? Bounce Toward 1.60 AheadBTAI has likely completed an impulsive 5-wave decline followed by an ABC corrective structure. The final leg (v) of the downtrend appears to have ended near $1.35, where price action shows a reversal signal.
Currently, price is attempting to recover and may retest the descending trendline and previous structure zone near $1.60 — a level that served as strong support previously and now acts as resistance.
If the price breaks this zone with volume confirmation, it could trigger a short-term bullish breakout. Until then, this is considered a corrective rally within the broader downtrend.
Key Levels:
Support: $1.35
Resistance: $1.60
Target: $1.60 (potential +16%)
Conclusion:
A short-term bounce is unfolding. Watch $1.60 for reaction — rejection or breakout will determine the next leg.
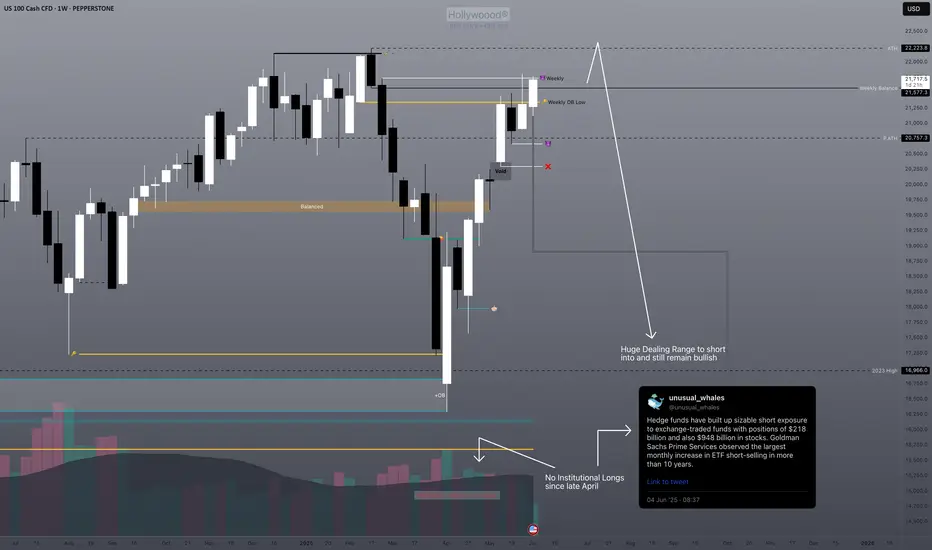
Hedge funds are unusually bearish and here's why...We have a huge dealing range to short into and still remain bullish, it's basically free money on technical retracement/correction while not ruining the market.
The retailers have been buying since April but there is no institutional orderflow evidenced by no peak above average volume levels.
Technicals will reign supreme here. Trump is either trolling about the rate decrease or he has no idea about chart technicals 😮💨. I bet he's trolling, as he has cabinets on cabinets of market advisors who know fully how correction cycles work.
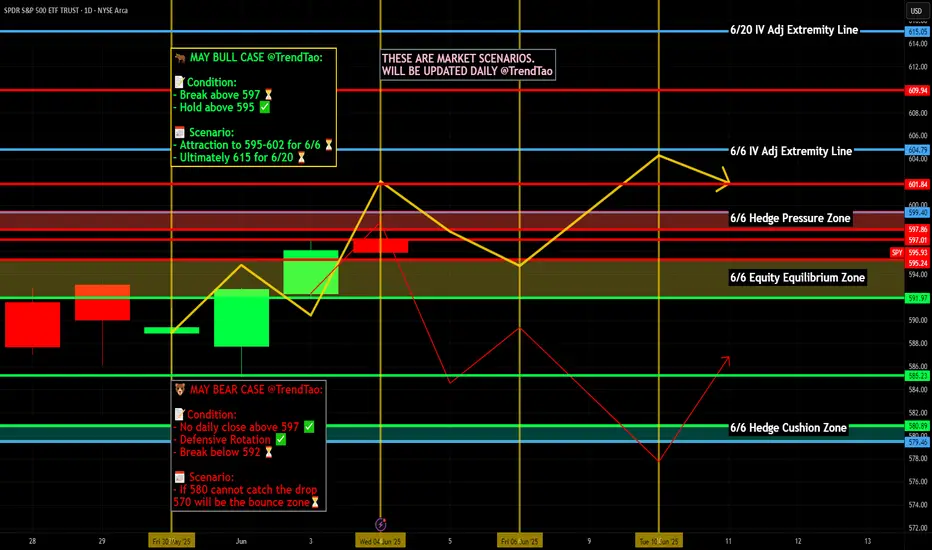
Nightly $SPY / $SPX Scenarios for June 5, 2025🔮 Nightly AMEX:SPY / SP:SPX Scenarios for June 5, 2025 🔮
🌍 Market-Moving News 🌍
🇺🇸 JOLTS Job Openings Surprise to Upside
U.S. job openings unexpectedly rose to 7.39 million in April—well above forecasts—indicating that labor demand remains robust despite macro headwinds and trade-policy uncertainty
🛢️ OPEC+ Greenlights July Supply Increase
OPEC+ agreed to boost production by 411 K barrels per day starting in July, adding downward pressure to oil prices and weighing on energy equities
📈 Fed’s John Williams Signals Patience
New York Fed President John Williams reiterated that the Fed sees no urgency to cut rates, citing mixed inflation signals and a balanced labor market—keeping investors cautious on rate-cut timing
📊 Key Data Releases 📊
📅 Thursday, June 5:
8:30 AM ET – JOLTS Job Openings (April)
Measures total U.S. job vacancies, a leading indicator of labor-market strength.
10:00 AM ET – OPEC+ Press Conference (Post-Meeting)
Details on production quotas for July, guiding energy market supply expectations.
⚠️ Disclaimer:
This information is for educational and informational purposes only and should not be construed as financial advice. Always consult a licensed financial advisor before making investment decisions.
📌 #trading #stockmarket #economy #news #trendtao #charting #technicalanalysis
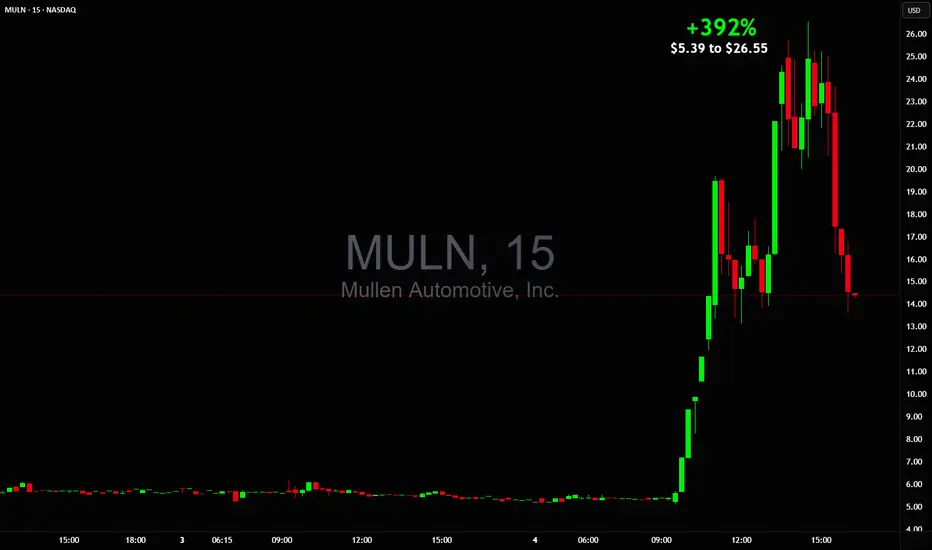
$5 to $26 big +400% day for $MULNThe biggest mover of the entire stock market NASDAQ:MULN with huge 400% squeeze. Mentioned probable bounce from $14.50 in chat, then double bottom possibility and stronger bounce from $14.50 again, after double bottom was confirmed it rocketed beyond $20 and $25.
It closed the day right at same $14.50 area once again, we'll see how it trades tomorrow.
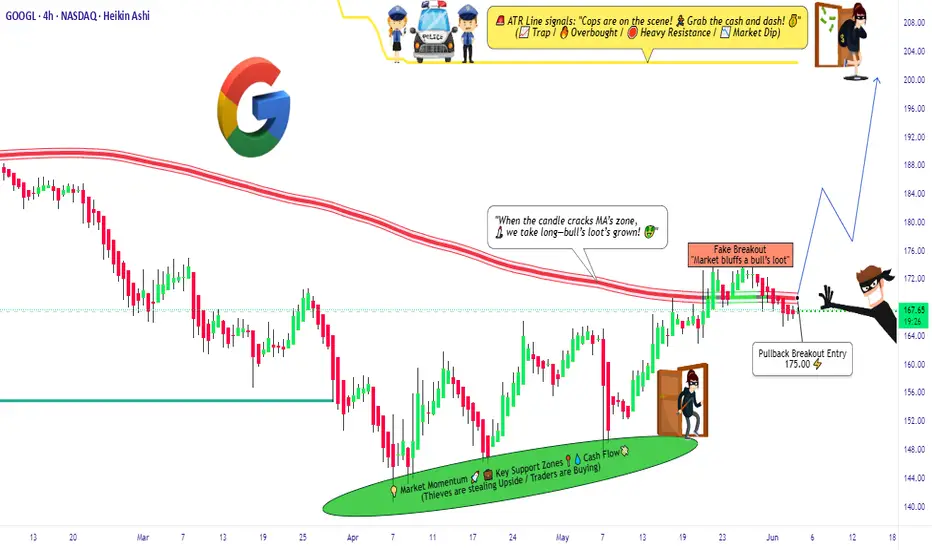
"GOOGL Technical Play: MA Bounce for Swing Traders!"🚀 GOOGL Stock Heist: The Ultimate AI & Ad-Tech Gold Rush (Swing Trade Plan)
🌟 Market Pirates, Ready to Raid? 🏴☠️💰
🔥 Thief Trading Blueprint for GOOGL (Alphabet Inc.)
🎯 Entry (The Vault is Open!)
Pullback Breakout Strategy:
Buy Zone: Wait for a pullback near the Moving Average "Wall" (e.g., 200-day LSMA, depending on trend alignment).
Confirmation: Enter long if price bounces off the MA with volume support or breaks above a tight consolidation.
Exact Entry: $175.00 (key psychological level + MA confluence). Use buy limits for precision.
Breakout Add-On: If GOOGL clears $180 with momentum, consider adding to the position.
🛑 Stop Loss (Escape Route)
SL: Place below the recent swing low (4H/1D timeframe) or 2-3% below entry (~$170.50 if entering at $175).
Trailing SL: Adjust upward as price climbs to lock profits.
🏆 Target 🎯: $200.00 (The Ad-Tech & AI Jackpot!)
Why $200?
Cantor Fitzgerald’s bullish $200 target for NVDA reflects AI-sector optimism—similar tailwinds apply to GOOGL (AI integration in ads, cloud, and Gemini AI growth) 5.
Resistance levels and institutional liquidity zones align with this round-number target.
📈 Why GOOGL?
AI & Cloud Momentum: Google Cloud + Gemini AI adoption mirrors NVDA’s AI hype 15.
Technical Strength: Reclaimed 200-day SMA? Check for higher lows and sector leadership (like NVDA’s recent behavior) 314.
Fundamental Catalyst: Upcoming earnings or AI partnership announcements could fuel FOMO.
⚠️ Risk Management
Avoid news spikes: Earnings/regulatory news = volatility traps.
Scale out: Take partial profits at $190, let runners aim for $200.
💥 Pirate’s Bonus
Like/Boost if this plan helps! More heists incoming (TSLA? AAPL?). Stay tuned!
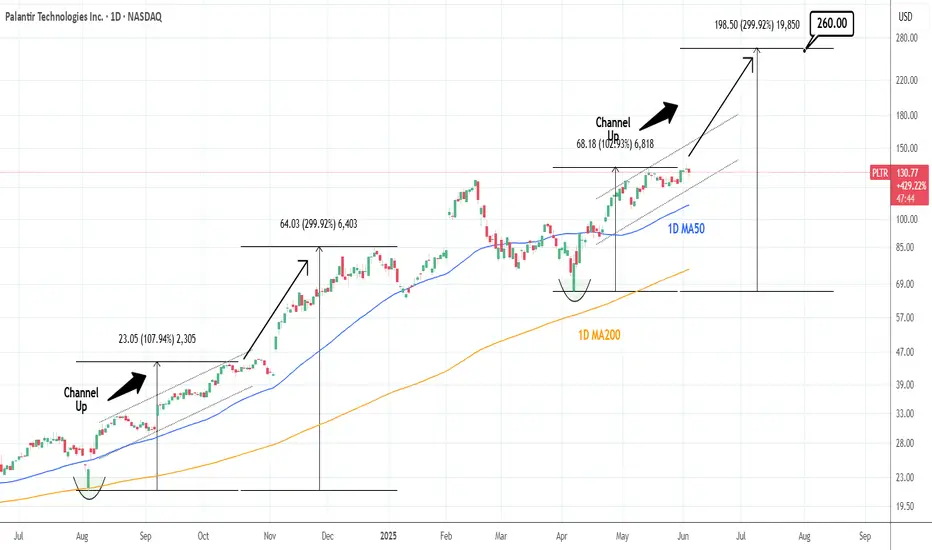
PALANTIR: Bullish breakout to $260 imminent.Palantir is on a strong bullish 1D technical outlook (RSI = 62.809, MACD = 6.320, ADX = 29.658) as it maintaines a Channel Up pattern that is supported by the 1D MA50. The starting point was of course the April 7th 2025 bottom and it looks very similar to the previous major bottom on the 1D MA200 on August 5th 2024. Expect the same total rise (+299%) before the next 1D MA50 test. TP = 260.
See how our prior idea has worked out:
## If you like our free content follow our profile to get more daily ideas. ##
## Comments and likes are greatly appreciated. ##
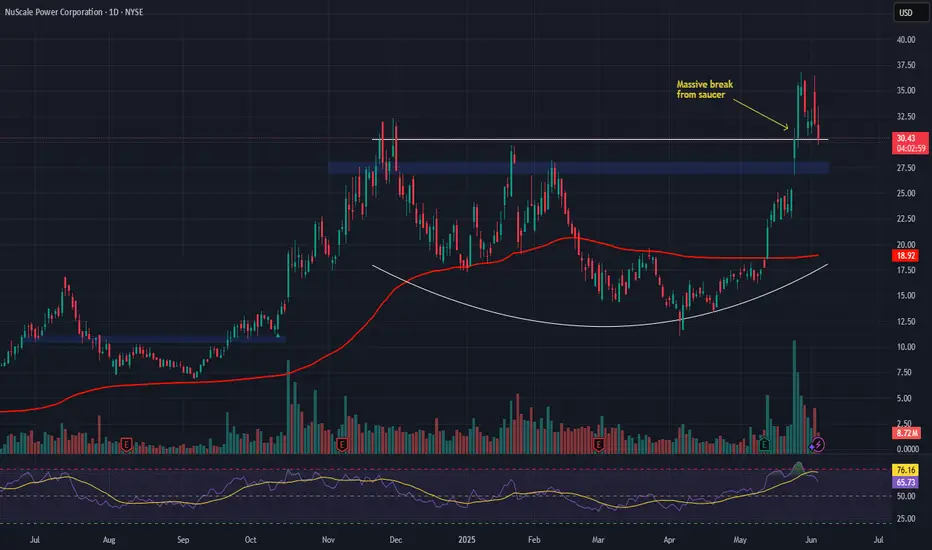
NuScale Power Corp. (SMR) – Leading the Nuclear RenaissanceCompany Overview:
NuScale NYSE:SMR is pioneering small modular reactor (SMR) technology—offering a scalable, carbon-free solution for baseload energy at a time when AI, quantum computing, and data centers are driving unprecedented power demand.
Key Catalysts:
Regulatory Leadership 🏛️
Only SMR design approved by the U.S. Nuclear Regulatory Commission (NRC) ✅
Creates a regulatory moat—a multi-year head start over competitors
Enhances institutional credibility and accelerates deployment
Global Flagship Project: RoPower, Romania 🇷🇴
462 MW project → pre-orders already underway
Final investment decision by year-end could validate tech and unlock global markets
First major deployment in Europe signals international expansion readiness
Explosive Growth Outlook 🚀
77% forecasted revenue CAGR through 2025 vs. industry avg of 8.3%
62% reduction in per-share losses expected → strong operating leverage
Positioned to meet clean energy mandates and private sector demands for resilient, low-carbon power
Investment Outlook:
✅ Bullish Above: $27.00–$28.00
🎯 Price Target: $48.00–$50.00
📈 Thesis Drivers: First-mover advantage, regulatory approval, and global SMR project pipeline
⚛️ NuScale isn’t just building reactors—it’s building the future of energy. #SMR #NuclearEnergy #CleanPower
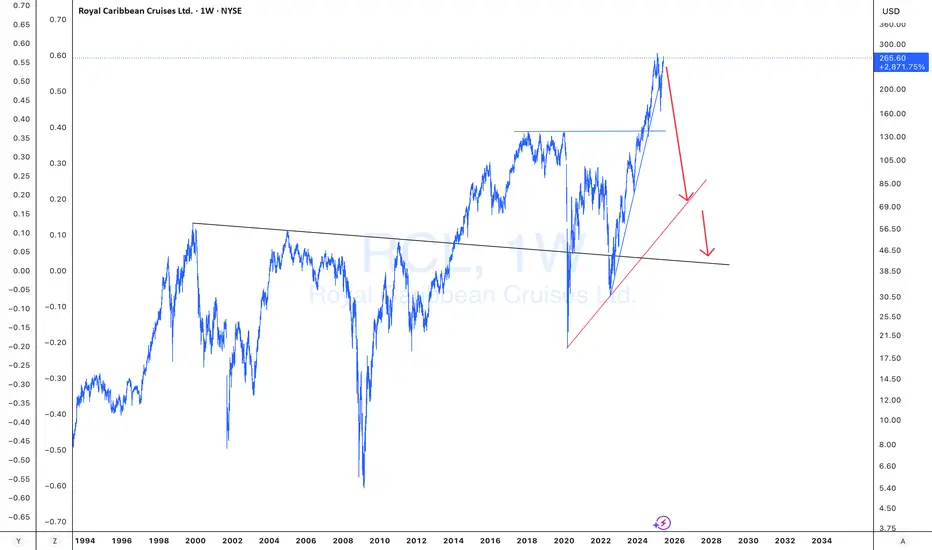
SHORT $RCL | Recession UnderwayRoyal Caribbean bailout cash drying up.
This chart is a good indication of current economic weakness.
I am looking for NYSE:RCL to drop 60% - 80% from the all time high.
I will continue to monitor and provide updates.
God bless!
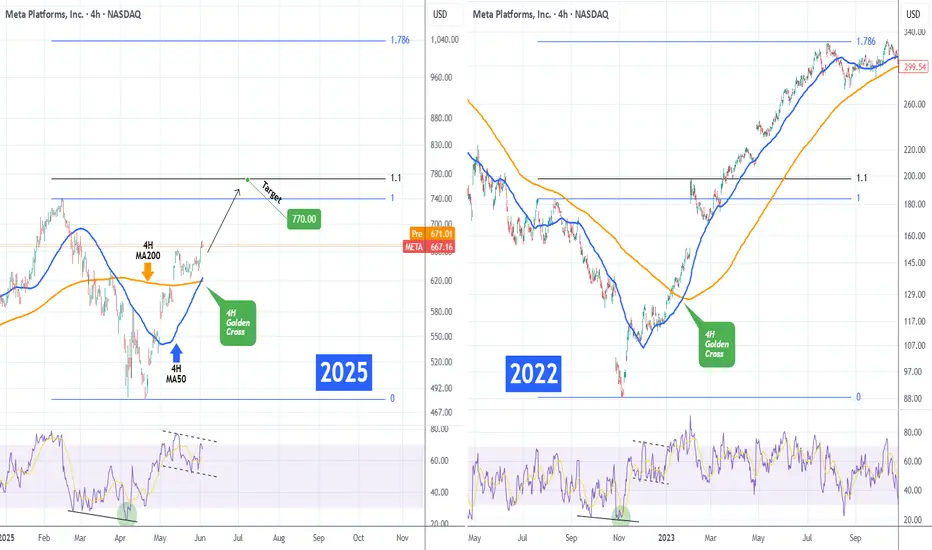
META Formed 1st 4H Golden Cross since Jan 2023!Meta Platforms (META) just completed yesterday its first 4H Golden in almost 2.5 years (since January 24 2023), flashing the strongest bullish signal it could at the moment!
Practically that Golden Cross was formed directly after the November 2022 bottom of the Inflation Crisis. The 4H RSI patterns between the two time periods are identical, so it is highly likely to see the market repeat that price action.
That suggests that the immediate Target on what seems to be an Inverse Head and Shoulders pattern is the 1.1 Fibonacci extension at $770.00, as META did on February 03 2023.
On the long-term and assuming a favorable macro environment (Trade Deals, Rate Cuts) it could reach the 1.786 Fibonacci extension a little over $1000, before the next major market correction.
-------------------------------------------------------------------------------
** Please LIKE 👍, FOLLOW ✅, SHARE 🙌 and COMMENT ✍ if you enjoy this idea! Also share your ideas and charts in the comments section below! This is best way to keep it relevant, support us, keep the content here free and allow the idea to reach as many people as possible. **
-------------------------------------------------------------------------------
💸💸💸💸💸💸
👇 👇 👇 👇 👇 👇
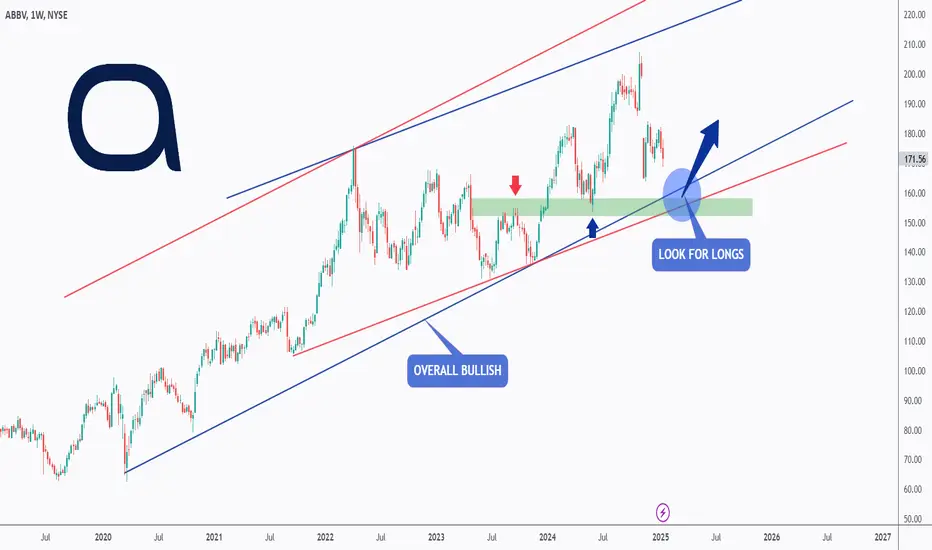
ABBV - Are you Ready?Hello TradingView Family / Fellow Traders. This is Richard, also known as theSignalyst.
📈ABBV has been in a correction phase and it is currently approaching the lower bound of the red and blue channels.
Moreover, the green zone is a strong round number $150 and structure!
🏹 Thus, the highlighted blue circle is a strong area to look for buy setups as it is the intersection of structure and lower trendlines acting as non-horizontal support.
📚 As per my trading style:
As #ABBV approaches the blue circle, I will be looking for bullish reversal setups (like a double bottom pattern, trendline break , and so on...)
📚 Always follow your trading plan regarding entry, risk management, and trade management.
Good luck!
All Strategies Are Good; If Managed Properly!
~Rich
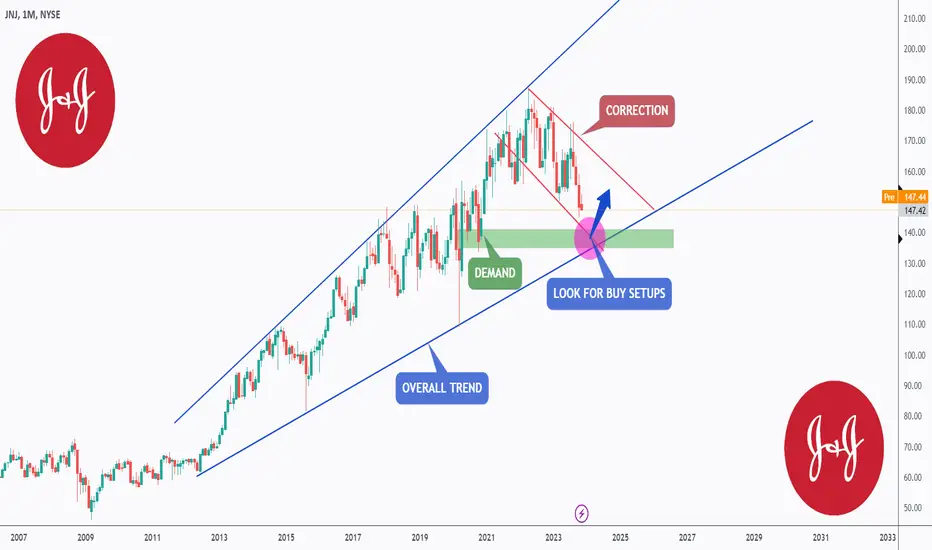
JNJ - Macro View 🌐Hello TradingView Family / Fellow Traders. This is Richard, also known as theSignalyst.
📈 JNJ has exhibited an overall bullish trend, trading within the ascending wedge pattern outlined in blue. It is presently nearing the lower boundary/blue trendline.
At present, JNJ is undergoing a correction phase and is trading within the descending red channel. It is currently approaching the lower limit and a highlighted demand zone in green.
🏹 Thus, the highlighted purple circle is a strong area to look for buy setups as it is the intersection of the green demand and lower blue and red trendlines acting as a non-horizontal support.
📚 As per my trading style:
As JNJ approaches the lower purple circle zone, I will be looking for bullish reversal setups (like a double bottom pattern, trendline break , and so on...)
📚 Always follow your trading plan regarding entry, risk management, and trade management.
Good luck!
All Strategies Are Good; If Managed Properly!
~Rich
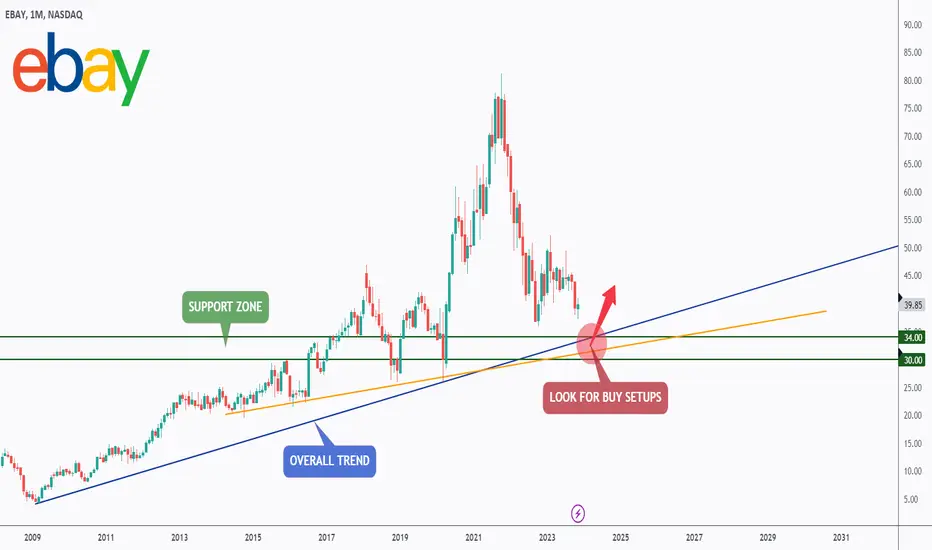
ebay is on sale 🛒Hello TradingView Family / Fellow Traders. This is Richard, also known as theSignalyst.
📈 EBAY has exhibited an overall bullish trend , trading above the orange and blue trendlines.
At present, EBAY is undergoing a correction phase and it is currently approaching a strong support zone 30 - 34
🏹 Thus, the highlighted red circle is a strong area to look for buy setups as it is the intersection of the green support and lower blue and orange trendlines acting as a non-horizontal support.
📚 As per my trading style:
As #EBAY approaches the lower red circle zone, I will be looking for bullish reversal setups (like a double bottom pattern, trendline break , and so on...)
📚 Always follow your trading plan regarding entry, risk management, and trade management.
Good luck!
All Strategies Are Good; If Managed Properly!
~Rich
Nightly $SPY / $SPX Scenarios for June 4, 2025🔮 Nightly AMEX:SPY / SP:SPX Scenarios for June 4, 2025 🔮
🌍 Market-Moving News 🌍
🌐 Markets Rally on Chinese PMI Surprise
China’s Caixin Manufacturing PMI unexpectedly climbed to 50.8 in May, signaling expansion in smaller export-focused factories. Asian markets jumped, lifting U.S. equity futures as investors recalibrated global growth expectations .
📉 U.S. Factory Orders Remain Soft
April’s U.S. Factory Orders fell 0.4%, underscoring persistent weakness in industrial demand amid elevated input costs and trade uncertainty. Declines in durable-goods orders weighed on industrial stocks .
🏦 Fed’s Bowman to Speak on Economic Outlook
Fed Governor Michelle Bowman is scheduled to deliver remarks at 2:00 PM ET, likely emphasizing caution on future rate moves given mixed data. Markets will watch for any shifts in tone regarding inflation risks and labor-market resilience .
🛢️ Oil Prices Slip on Rising U.S. Inventories
U.S. crude inventories rose by 3.8 million barrels last week, according to API data, pressuring oil prices lower and dragging energy shares down as supply concerns outweighed strong demand signals .
📊 Key Data Releases 📊
📅 Wednesday, June 4:
2:00 PM ET – Fed Governor Michelle Bowman Speaks
Remarks on economic outlook and monetary policy, watched for any hints on the Fed’s next moves.
⚠️ Disclaimer:
This information is for educational and informational purposes only and should not be construed as financial advice. Always consult a licensed financial advisor before making investment decisions.
📌 #trading #stockmarket #economy #news #trendtao #charting #technicalanalysis

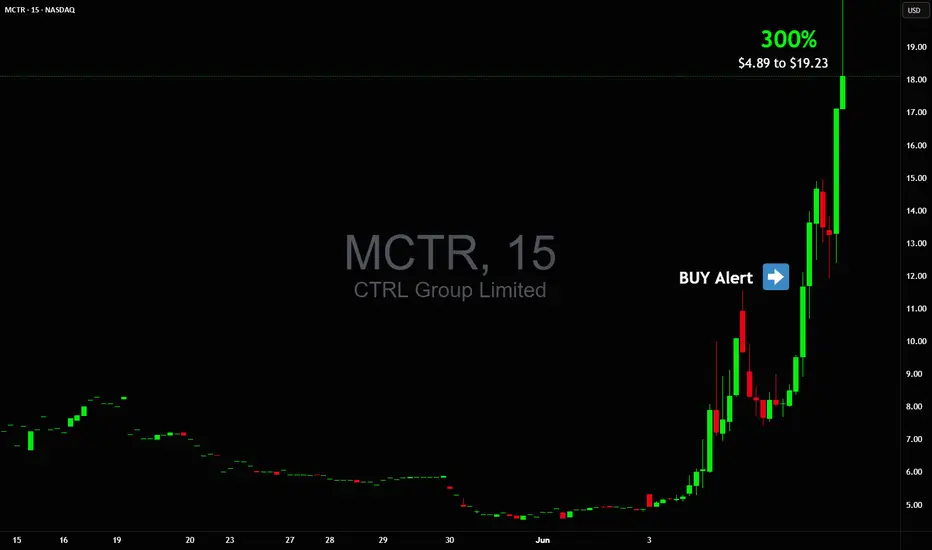
HUGE $5 to $49 today +900% vertical $MCTR told you early!HUGE 🤯 $5 to $49 today +900% vertical 🚀 shared a chart with you early before it went on a power squeeze NASDAQ:MCTR

$5 to $19 or +300% vertical! Catching a safe piece of $MCTR$5 to $19 🚀 Catching a safe piece daily from the move like that is all you need to keep the job away 💯 NASDAQ:MCTR
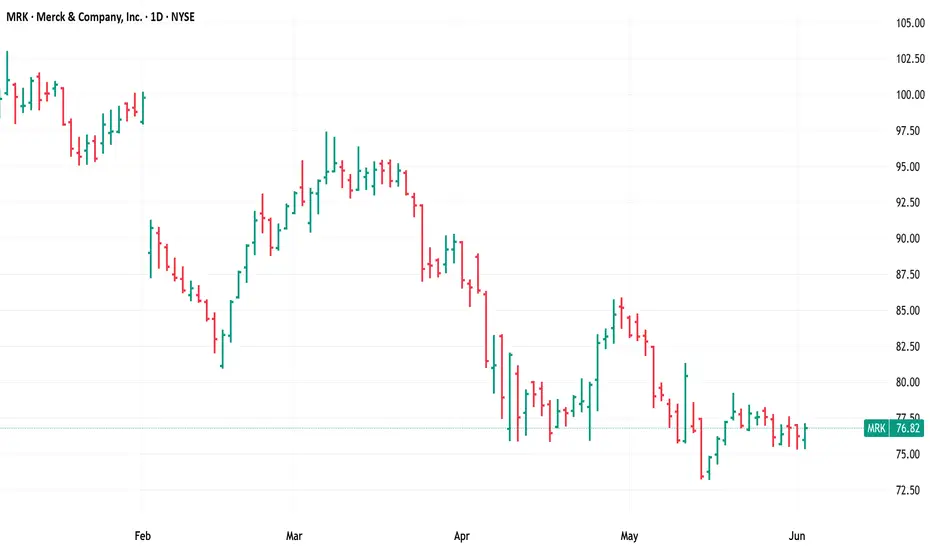
$MRK, Long, TP>15-25%NYSE:MRK , Long, TP>15-25%
Fundamentally the stock is good.
Choose an entry point and do not forget about a protective order if you are trading with leverage.
Don't risk it if you're not sure.
Good luck to everyone.
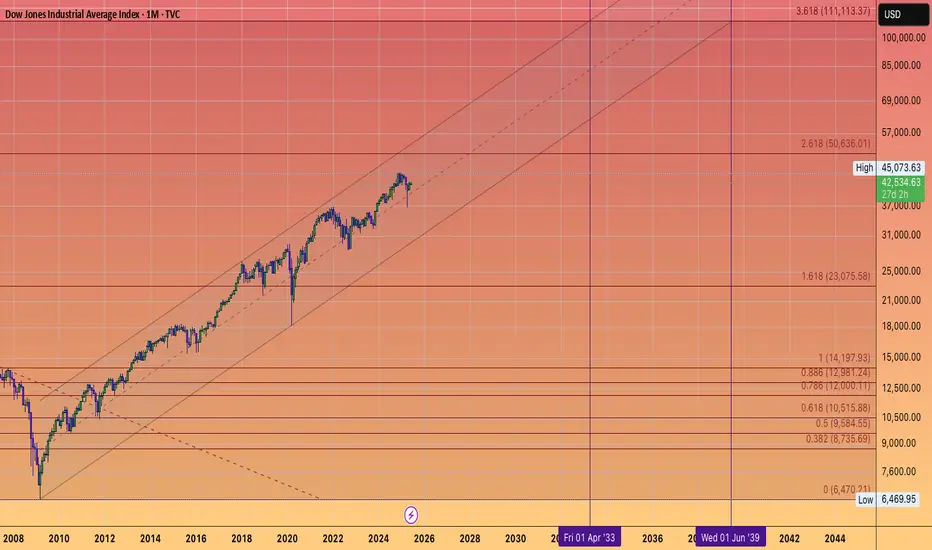
DOW JONES TO 111 THOUSAND..in the the 2030's.
as an investor you must be thinking 2 decades down the line.
NOT 2 quarters.
They can not
stop
printing #FIAT
it's in the code.
A 8% compound rate puts the Dow Jones at 85,000 in 2034.
I'm long forever.
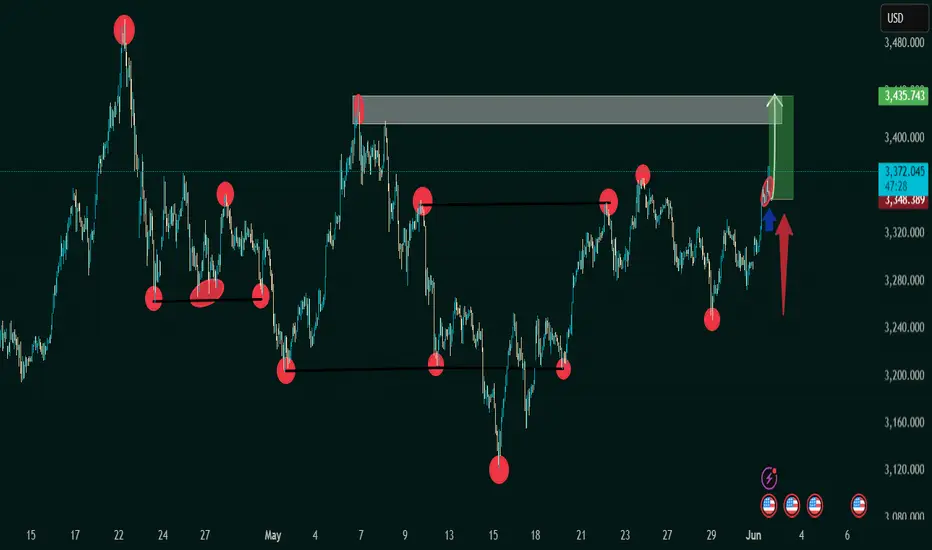
XAU/USD (Gold vs US Dollar) 1h timeframe 1. "Bullish Breakout Anticipation: Gold Eyes $3,435 Zone"
This title emphasizes the potential breakout scenario:
The chart shows price pushing into a previous supply zone (highlighted rectangle).
The green box and arrow indicate a bullish target near $3,435.
Key resistance has been tested multiple times (red circles), suggesting weakening seller control.
📈 2. "Double Bottom Reversal Validates Bullish Momentum in XAU/USD"
This reflects a technical pattern recognition:
A potential double bottom forms near the May 15th and late May lows.
The breakout from the neckline (around $3,350–$3,370) confirms the reversal.
Red-to-green zone suggests the projected move post-breakout.
🔄 3. "Range Consolidation Broken: XAU/USD Breaks Key Resistance"
Focuses on market structure:
Horizontal support/resistance lines indicate a range-bound market.
The recent move above previous highs signals a range breakout.
Blue arrow suggests a retest could offer a long entry point.
💡 4. "Buy Opportunity Triggered on Retest: Targeting Supply Zone Break"
This suits a trading plan scenario:
Red and blue arrows suggest a pullback-and-go trade setup.
The price may revisit the breakout level (~$3,348) before heading higher.
The green zone is the profit target area.
⚔️ 5. "Battle of Supply and Demand: Bulls Gaining Control Above $3,370"
Captures the market sentiment shift:
Multiple failed attempts to break lower (marked with red circles).
Final bullish breakout shows momentum shift to buyers.
If volume confirms, the breakout could be strong and sustained.
MSTR - The Saylor in the Storm!Hello TradingView Family / Fellow Traders. This is Richard, also known as theSignalyst.
📈MSTR has been overall bullish trading within the rising channel marked in blue. (log chart)
Currently, it is in a correction phase within the falling red channel.
Moreover, the red zone is a strong demand.
🏹 Thus, the highlighted blue circle is a strong area to look for buy setups as it is the intersection of demand and lower trendlines acting as non-horizontal support.
📚 As per my trading style:
As #MSTR approaches the blue circle, I will be looking for bullish reversal setups (like a double bottom pattern, trendline break , and so on...)
📚 Always follow your trading plan regarding entry, risk management, and trade management.
Good luck!
All Strategies Are Good; If Managed Properly!
~Rich

Full trade plan with exact prices laid out ahead of time!After shortsellers forcefully pushed NASDAQ:MODV down from mid $2's I said this will most likely result into powerful squeeze.
I said buy at the dip $2.31 exactly, waited to get filled, double dip to $2.31 happened to get a full position and from there straight up to mid $3's, took profits in 2 parts and sent out messages live as it was happening so everyone that followed along knew what to do.
Solid +30% gain in minutes, taking safest piece of the 200% move the stock made before focus shifted elsewhere.
That's how it's done, in and out at highly predictable levels, then moving on to the next stock because NASDAQ:NIVF NASDAQ:EYEN NASDAQ:REVB are already up and hot this morning, not marrying it and holding & hoping forever.
