Nightly $SPY / $SPX Scenarios for May 21, 2025🔮 Nightly AMEX:SPY / SP:SPX Scenarios for May 21, 2025 🔮
🌍 Market-Moving News 🌍
🇺🇸 G7 Finance Ministers Convene Amid Tariff Tensions
Finance ministers from G7 nations are meeting in Banff, Alberta, focusing on restoring global stability and growth. Discussions are expected to address excess manufacturing capacity, non-market economic practices, and financial crimes. Tensions may arise due to recent U.S. tariffs affecting multiple G7 nations.
🛢️ Oil Prices Rise on Geopolitical Concerns
Oil prices increased over 1% following reports that Israel may be preparing a military strike on Iranian nuclear facilities. Such actions could disrupt Middle East oil supplies, particularly if Iran blocks the Strait of Hormuz, a vital passage for crude exports.
📈 Retail Earnings in Focus
Major retailers, including Lowe's ( NYSE:LOW ), Target ( NYSE:TGT ), and TJX Companies ( NYSE:TJX ), are set to report earnings today. Investors will be closely monitoring these reports for insights into consumer spending patterns amid ongoing economic uncertainties.
📊 Key Data Releases 📊
📅 Wednesday, May 21:
10:00 AM ET: State Employment and Unemployment (Monthly) for April 2025
10:30 AM ET: EIA Crude Oil Inventory Report
⚠️ Disclaimer:
This information is for educational and informational purposes only and should not be construed as financial advice. Always consult a licensed financial advisor before making investment decisions.
📌 #trading #stockmarket #economy #news #trendtao #charting #technicalanalysis
Stocks!

Tesla Faces Resistance, Conclusion: 1,206 New All-Time High?The Tesla stock, TSLA, is facing resistance right now; what to expect?
Expect additional growth but...
Good afternoon my fellow trader, Tesla will continue growing, mark my words.
Volume has been rising now since January 2024, that's a long time. Almost a year and a half with more and more action joining this stock and this is one of the most traded stocks in the whole world. Increasing volume is a very strong bullish signal.
The highest volume session came on the 7-April week and this week closed green. It produced the highest volume since February 2023.
Back in 2023, trading volume started to rise in January and this signaled the start of a long-term bullish trend, higher highs and higher lows. This trend is still valid today.
The bullish bias is confirmed. Let me show you.
» EMAs:
TSLA trades above all moving averages, short-term and long-term. Incl. SMA200 and EMA89/55.
» MACD bullish cross:
This is a very strong signal. Last week the MACD produced a bullish cross and is now coming out of the bearish zone. This is bullish for two reasons, the histogram turns green and there is plenty of room available for additional growth. In a way, this signal shows that the bullish wave is only starting now and that it will continue long-term. This MACD signal doesn't show up unless a bullish wave is coming. You can look back at the weekly MACD and confirms this for yourself. Each time the b-cross is in, this stock grows for months.
» RSI bullish zone (57.63):
To be honest, I don't like how the RSI is looking but we have the classic higher highs and higher lows pattern. The reading is bullish and shows plenty of room available for growth. It could be better though but still, leaning up and supporting more up.
» RENKO (weekly):
Clearly bullish. This confirms TSLA is in an uptrend now and will keep going higher.
» RENKO (daily):
In the daily RENKO chart the bullish bias/signal is even more pronounced, meaning, no room for doubts.
» To end this 'it is obvious Tesla will continue rising technical analysis', let's consider the monthly timeframe:
— We have a perfect rising channel.
— There is a rounded bottom (orange) which is a reversal signal.
— There is a hammer candlestick last month which is also a reversal signal.
— This month is full green which confirms both the hammer and rounded bottom as reversal signals.
All these signals are saying that the bullish trend will continue now.
Last month produced the highest volume since June 2023.
» Tesla (TSLA) is going up.
Namaste.

Nu Holdings (NU, 1D) — Technical AnalysisNu Holdings (NU, 1D) — Technical Analysis: Trendline Breakout, EMA/MA Confirmation, Recovery Toward Key Levels
On the daily chart, Nu Holdings has broken out of a descending trendline, signaling a potential structural reversal. The breakout was confirmed by a close above key exponential and simple moving averages (EMA 50/100/200), with the EMAs beginning to align in a bullish sequence. The price has held above the critical Fibonacci retracement level at $11.73 (0.618), which now serves as a key demand zone. Volume shows signs of increasing during upward impulses, suggesting accumulation interest. The current recovery structure indicates potential targets at $12.58 (0.5 Fibonacci), followed by $13.42 (0.382) and $14.46 (0.236). A more extended move could lead toward the previous supply zone near $16.15 if momentum persists.
From a fundamental standpoint, Nu Holdings continues to attract investor attention within the fintech sector, especially amid broader rotation back into growth and tech-driven financial platforms. The company's expanding market presence and improving financial metrics may support the current technical setup. As long as the price holds above the broken trendline and maintains strength above the key $11.73 level, the bullish scenario remains in focus with targets pointing toward the $13.42–$14.46 range and potentially higher in the medium term.

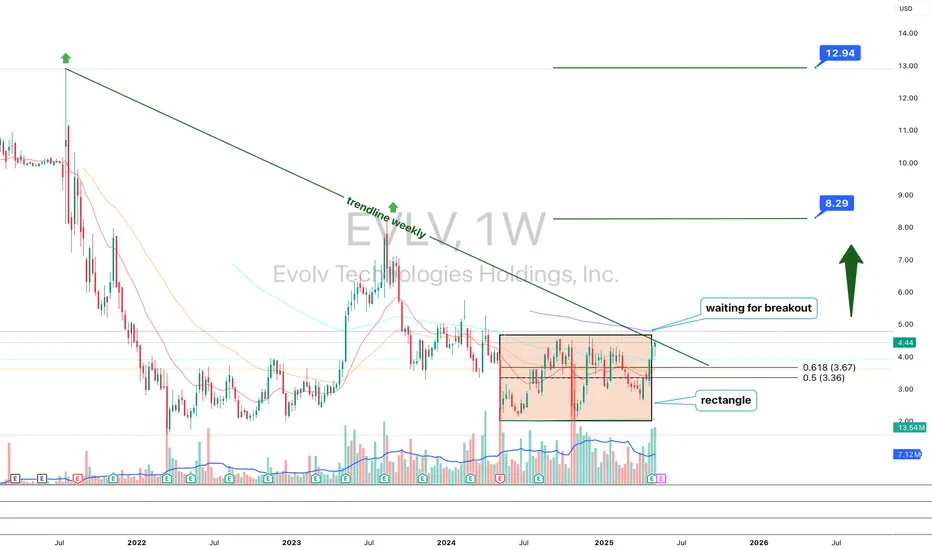
EVLV 1WEVLV — a rectangle pattern has formed, and the 100 MA has crossed above the 200 MA, signaling the start of a potential trend reversal. Targets: $8.29 and $12.94.
As of May 2025, the fundamental outlook for Evolv Technologies Holdings Inc. (ticker: EVLV) is as follows:
The company continues to show strong revenue growth and improving key financial metrics, despite remaining unprofitable. Revenue for 2024 reached $103.9 million, up 31% from 2023, while the net loss was halved to $54 million. EBITDA improved to -$21 million from -$51.8 million the year before. Annual recurring revenue (ARR) grew by 39% to $99.4 million. The company maintains a strong financial position with $51.9 million in cash and zero debt.
The stock is currently trading at $4.44, above its estimated intrinsic value of $2.76 according to AlphaSpread. Analysts remain optimistic, giving EVLV a “Strong Buy” rating and forecasting an average price target of $5.31, suggesting about 19.6% upside potential.
However, investors should keep in mind that the company is still unprofitable, and the current market valuation exceeds its fundamental value.
CATL’s HK Debut IGNITES EV Revolution Tesla’s Secret Weapon?🔥 CATL’s HK Debut IGNITES EV Revolution Tesla’s Secret Weapon?
BOOM! Chinese battery king CATL ($CATL.HK) just skyrocketed in its Hong Kong debut, defying Pentagon blacklists. Powering Tesla, VW, and Mercedes, it’s the EV supply chain’s 800-lb gorilla. Funds are pouring in for global domination miss this, and you’re sidelined!
⚡️ Pro Tip: EV stocks are heating up, but US-China tensions could crash the party. Watch NYSE:NIO , NASDAQ:LI too!
🚀 Share this if you’re bullish on EVs! What’s your top EV pick?

$3's to $7's catching easiest vertical part of the chart $SYTAGot to let the stock evolve properly, once enough of shortsellers are trapped inside they can only try to manipulate with crash attempts and when even those don't work out they're forced to cover (buy to exit their short position) into vertical push, and those amounts cannot be just clicked out in a second, it takes time to scale in and it takes time to scale out. The only problem is when it's in a bullish uptrend it gets faster and wilder.
Sent out Buy Alert for $3.80 buy expecting vertical and we got it! NASDAQ:SYTA

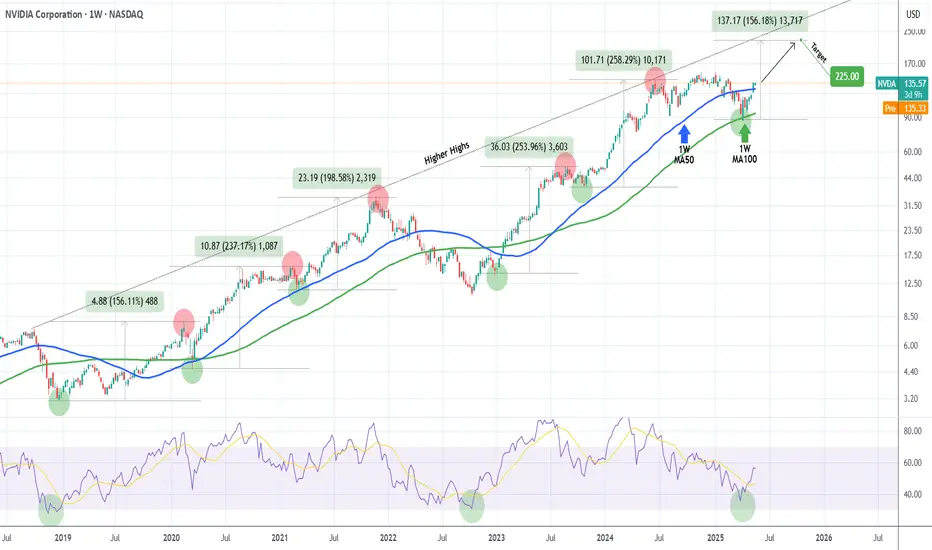
NVIDIA The 1W MA100 rebound is targeting $225 at least.NVIDIA Corporation (NVDA) broke last week above its 1W MA50 (blue trend-line) for the first time in 2.5 months and all this is generated by April's bottom rebound on the 1W MA100 (green trend-line).
The 1W MA100 has been intact since January 23 2023, so this rebound technically initiates a new Bullish Leg. Since the December 2018 bottom (previous U.S. - China Trade War), the minimum rise on such a Bullish Leg has been +156.11%. As a result, NVIDIA can now target $225 at least before the end of 2025.
-------------------------------------------------------------------------------
** Please LIKE 👍, FOLLOW ✅, SHARE 🙌 and COMMENT ✍ if you enjoy this idea! Also share your ideas and charts in the comments section below! This is best way to keep it relevant, support us, keep the content here free and allow the idea to reach as many people as possible. **
-------------------------------------------------------------------------------
💸💸💸💸💸💸
👇 👇 👇 👇 👇 👇
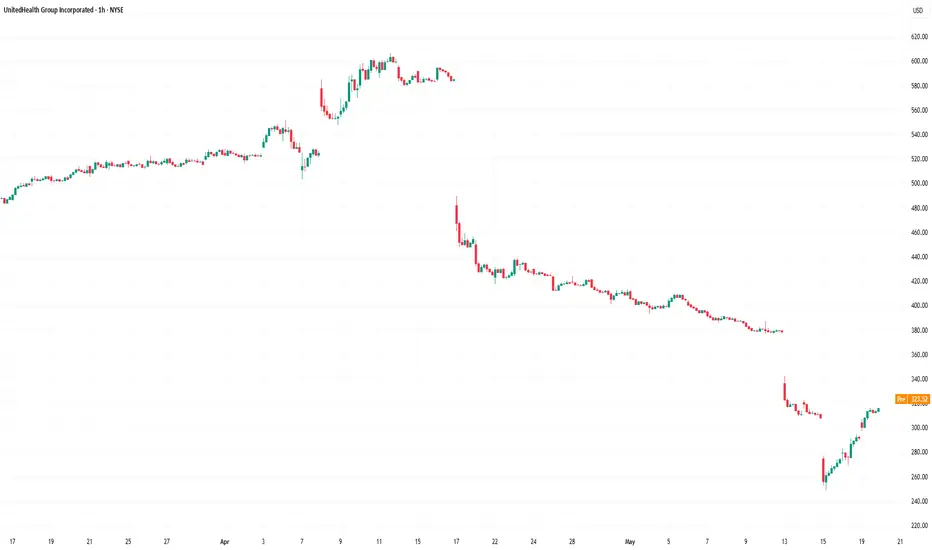
UnitedHealth (UNH) Share Price ReboundsUnitedHealth (UNH) Share Price Rebounds
A month ago, in our analysis of the UNH chart, we:
→ highlighted that UnitedHealth shares had lost nearly 23% in value;
→ drew a descending channel and suggested that bearish pressure could continue, threatening the support level around $450, which had held since early 2022.
Since then, UNH’s stock price decisively broke below that level (as marked by the arrow), falling to around $250 — its lowest point since spring 2020 — before staging a sharp rebound. This steep price movement was driven by a series of fundamental developments, including:
→ the resignation of the CEO and news of a Department of Justice investigation into potential Medicare fraud;
→ UnitedHealth withdrawing its earnings guidance for the coming year;
→ political debates over the Medicaid programme as part of the 2025 budget negotiations;
→ President Trump’s directive to cut prescription drug prices.
Recent news that the new CEO and several top executives have bought tens of millions of dollars’ worth of UNH shares appears to have renewed investor confidence — the share price rose above the $300 mark yesterday.
Technical Analysis of UNH Share Chart
These latest developments justify an update to the descending channel configuration. Of particular note is the gradual decline with limited volatility — a sign that the price is moving along the channel's median line (highlighted on the chart).
In this setup:
→ the bounce from the $250 level points to the lower boundary of the channel;
→ traders may consider a scenario where the current recovery pushes UnitedHealth stock towards the median, after which supply pressure may return and offset the recent dominance of demand.
It’s also possible that the key psychological level of $300 could now act as support.
This article represents the opinion of the Companies operating under the FXOpen brand only. It is not to be construed as an offer, solicitation, or recommendation with respect to products and services provided by the Companies operating under the FXOpen brand, nor is it to be considered financial advice.
Apple respite before sell offApple bounced straight of major support at circa $170, with the SMI now also rising we could see a few weeks of short term respite before continuing down to test the major support line again. Also notice a backtest of the rising trend at around 21%.
Long term view is still bearish, don't think we've seen the yearly bottoms yet. Will be interesting to see how this plays out especially with bonds.

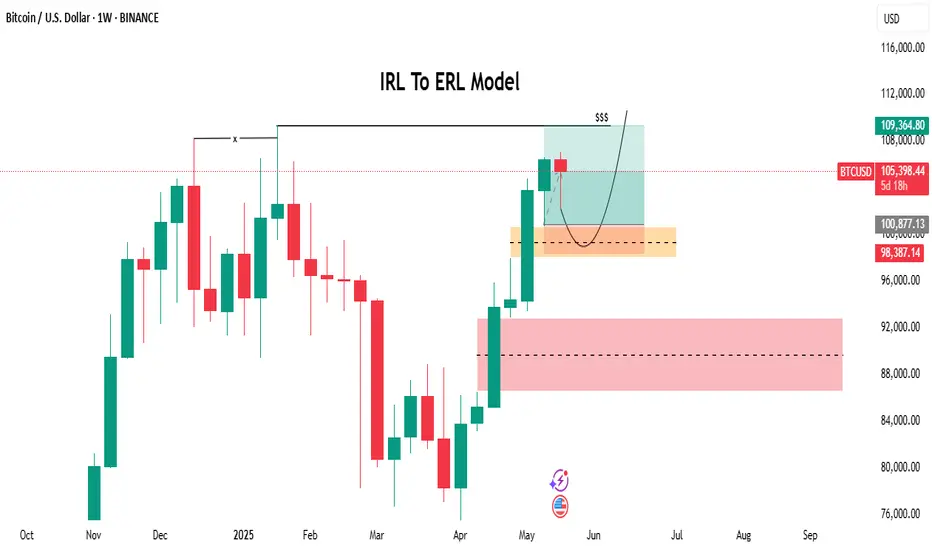
Bitcoin has recently touched its weekly Fair Value GapBitcoin (BTC) Market Update
Bitcoin has recently touched its weekly Fair Value Gap (FVG) and is now showing upward momentum. This price behavior is aligning with a potential transition from an Intermediate Reversion Level (IRL) to an Extended Reversion Level (ERL), suggesting the formation of a structured bullish model.
Given the current positive market sentiment surrounding BTC and the fact that the asset has already absorbed significant sell-side liquidity, the potential for further upward movement remains strong. There is a possibility that the market could aim for the 110K level in the near term if bullish conditions persist.
Investors and traders are advised to monitor the market closely as this structure develops, considering both technical indicators and macroeconomic influences to make informed decisions.
DYOR!
Nightly $SPY / $SPX Scenarios for May 20, 2025🔮 Nightly AMEX:SPY / SP:SPX Scenarios for May 20, 2025 🔮
🌍 Market-Moving News 🌍
📉 Bear Market Concerns Emerge
Veteran investor David Kotok warns of a potential bear market, projecting that tariffs could reduce S&P 500 earnings per share from $260 to $230 over the next year. This outlook suggests a possible decline of the index to the 4,000–4,400 range, with elevated Treasury yields further pressuring valuations.
🚢 Retail Inventory Challenges Amid Tariff Uncertainty
The Port of Los Angeles reports potential lower inventories for retailers due to ongoing U.S.-China tariff uncertainties. Despite a temporary 90-day tariff reduction, complexities in forecasting cargo volumes persist, potentially leading to fewer product choices and rising prices for consumers.
🛍️ Retail Earnings Spotlight
Major retailers, including Home Depot ( NYSE:HD ), are set to report earnings today. Investors will closely monitor these reports for insights into consumer spending patterns amid economic uncertainties.
💬 Federal Reserve Officials Scheduled to Speak
Federal Reserve officials, including Richmond Fed President Tom Barkin and Boston Fed President Susan Collins, are scheduled to speak today. Their remarks will be scrutinized for indications of future monetary policy directions.
📊 Key Data Releases 📊
📅 Tuesday, May 20:
10:00 AM ET: Labor Force Characteristics of Foreign-born Workers (Annual 2024)
10:00 AM ET: State Job Openings and Labor Turnover for March 2025
⚠️ Disclaimer:
This information is for educational and informational purposes only and should not be construed as financial advice. Always consult a licensed financial advisor before making investment decisions.
📌 #trading #stockmarket #economy #news #trendtao #charting #technicalanalysis

zSpace (IPO) NEW LISTINGA tech company called zSpace priced very low inline with the types of people that like to buy low cost stock, i.e. cryptocurrency investors. As for what the company does and if the company will succeed, only time will tell.

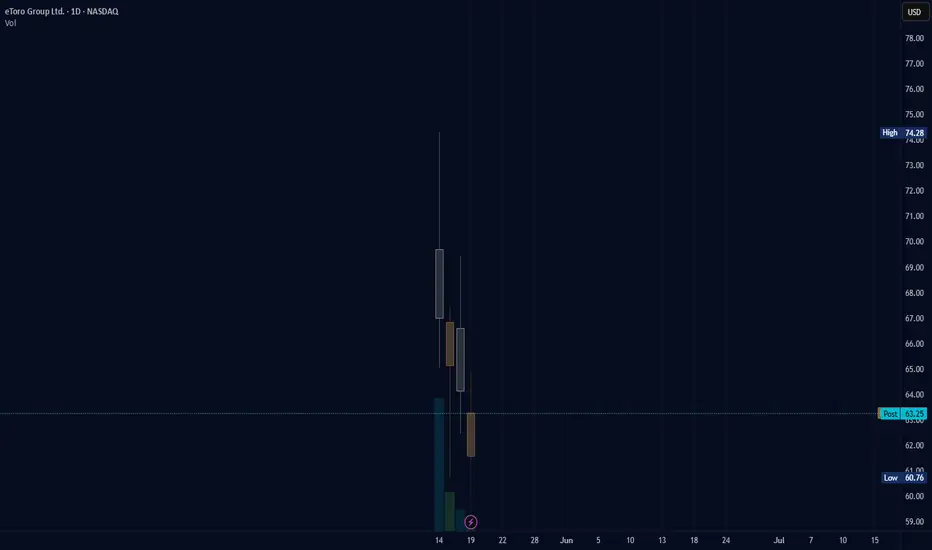
etoro (new listing)stock listing of ETORO to NASDAQ, I've heard of this company. Most of the time when a company that most people have heard of is listed there is a higher chance of the company doing well. As of right now the price is only in the red since the date of listing. The listing price was supposed to be around $46-$50 so officially the stock market, as usual, is not showing the truth; based on being compared to cryptocurrency prices. The listing shows that the price started at a peak which was probably after a bunch of pre-market trades happened and bumped the price up. That was not the true entry IPO list price.
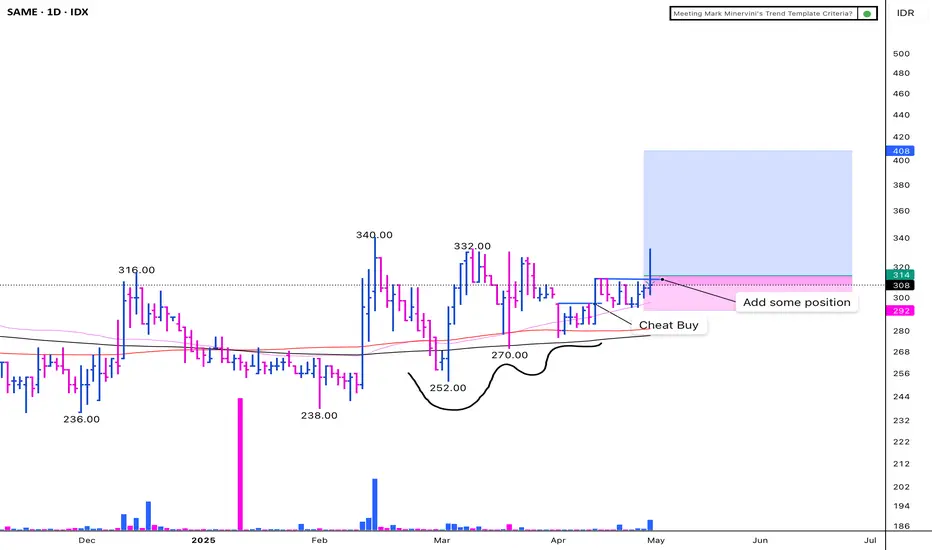
SAME - VCP (10W 25/5 3T)IDX:SAME - VCP
(+):
1. Low risk entry point on pivot level
2. Volume dries up
3. Price above MA 50 > 150 > 200 over 10 weeks
4. Price is within 25% of 52 weeks high
6. Price is over 30% of 52 weeks low
7. 200 day MA trending up over 1 month
8. RS Rating is over 70 (80)
9. 9. EPS Growth:
a. Quarterly QoQ: +852.30%
b. Quarterly YoY: +570.99%
b. TTM YoY: -3.34%
c. Annual YoY: -3.36%
(-)
1. Breakout with huge volume but long wick
Note: I will sell half if hit first Stop Loss, and sell remaining on the last stop loss on first cheat buy
LYFT – High Tight Flag Setup Post Earnings BreakoutNASDAQ:LYFT – High Tight Flag Breakout Setup Post Earnings
LYFT has exploded on earnings and is now setting up a textbook high tight flag — one of my favorite continuation patterns.
🔹 Earnings Surge → Flag Formation
NASDAQ:LYFT followed a similar path to NYSE:HIMS , which ran to the 16s after earnings.
Since the earnings pop, it has spent 6 days consolidating above the 9 EMA — strong bullish sign.
Today, it opened down $0.50, but buyers stepped in immediately, defending support.
🔹 High Tight Flag Setup
This is a classic high tight flag — strong initial move followed by tight sideways consolidation.
The longer it stays in this tight range, the stronger the breakout can be.
🔹 My Trading Plan:
1️⃣ Starter Position: Considering a starter position here, just above the 9 EMA, to catch the early move.
2️⃣ Confirmation Add: Full size on a clean breakout over the $17 level.
3️⃣ Stop Loss: Tight stop just below the 9 EMA — risk defined, reward potential is high.
🔹 Why This Setup is Compelling:
Strong earnings run + tight flag = perfect continuation setup.
Similar setup worked on NYSE:HIMS — earnings pop followed by a massive run.
Buyers stepping in at the first sign of weakness shows bullish strength.
⚠️ Risk Management: Start small, add on confirmation — always respect your stops.

Analysing the Spike in Volatility on the Walmart (WMT) ChartAnalysing the Spike in Volatility on the Walmart (WMT) Share Price Chart
On Thursday, the US retail giant reported its quarterly results — which turned out to be broadly better than expected. While total revenue was roughly in line with analysts’ forecasts, earnings per share came in higher at $0.61 versus the expected $0.57.
At the same time, Walmart CEO Doug McMillon stated on Thursday:
"We will do everything we can to keep our prices as low as possible. But given the scale of the tariffs, even at reduced levels, we won't be able to absorb all the pressure, considering the reality of tight retail margins."
This statement may have raised concerns among market participants about the company’s future earnings, contributing to Friday’s drop in the share price to $92.
It also drew the attention of the US President. On Saturday, Donald Trump said that Walmart (WMT) should “swallow the tariffs” instead of blaming them and raising prices.
In response, Walmart reiterated that it will keep prices as low as possible for as long as it can — which has always been the company’s approach.
Technical Analysis of the WMT Stock Price Chart
Looking at the broader market context, we can see that price fluctuations formed a narrowing triangle in late April — a sign that buyers and sellers had reached some agreement around a fair value of approximately $95.50.
In early May, sentiment shifted in favour of the bulls, with this level acting as support (marked by an arrow).
The earnings release triggered a spike in volatility — the ATR indicator is now at a one-month high. The Walmart stock price extremes seen at the end of last week suggest two key levels, roughly equidistant from the $95.50 axis:
→ resistance around $99 (reinforced by the psychological level of $100);
→ support around $92.
Given the above, it is reasonable to suggest that once the market has digested the news, price movements may calm down again. In that case, we may well see another narrowing triangle form on the WMT chart — slightly above the previous one.
This article represents the opinion of the Companies operating under the FXOpen brand only. It is not to be construed as an offer, solicitation, or recommendation with respect to products and services provided by the Companies operating under the FXOpen brand, nor is it to be considered financial advice.

btc . w4 . may . wOpen . LONGto catch everyone of guard, whom thinks we're crashing today:
. LONG: look for good tpo at nyOpen, of running aLow and pump to liquidate and grab liquidity
. SHORT: still on the table - but the LONG could be a runner
btc . w4 . may . wOpen . SHORTideally :
. good tpo and price not finding a floor during ny
SHORT
. ladder limits
. start pw.0.5
. end pwVAH - pdEQ
. withhold 30% of total order to add upon trade confirmation
. tp1 +1.5%
. tp 2 . mOpen . 94133.6 + 9%
- ride the momentum shift downwards

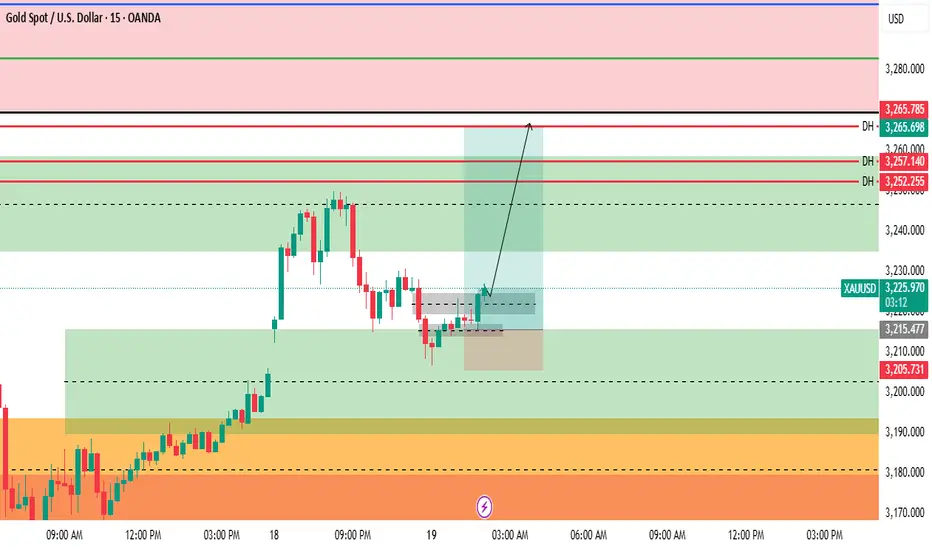
Gold Urgent Update.Gold Urgent Update
Gold has recently touched its 4-hour bullish Fair Value Gap (FVG) and is now moving upward. Additionally, there is existing liquidity from previous days positioned above the current price level, which further increases the probability of a continued bullish move.
There is a high likelihood that the market could rise towards the price levels of 3250, 3260, and possibly even 3265. These levels should be closely monitored, as they represent potential short-term targets based on the current price action and market structure.
At this stage, it is advised to avoid entering any selling (short) positions unless a clear and confirmed bearish signal is observed. The market sentiment remains decisively bullish, and until any bearish reversal patterns are confirmed, the upward trend should be respected.
Please conduct your own research (DYOR) and practice proper risk management when trading towards the mentioned target levels.
NIFTY!Gift nifty at supply area which means a selling could start or slow buying could persist. Although stocks are showing good momentum, i will keep a cautious watch all over.
TCS EASY CHARTI think this is one of the most easy chart of a stock io know what is and will happen in the stock. I will be posting details of smaller levels on this stock.
Weekly $SPY / $SPX Scenarios for May 19–23, 2025🔮 Weekly AMEX:SPY / SP:SPX Scenarios for May 19–23, 2025 🔮
🌍 Market-Moving News 🌍
📉 Moody's Downgrades U.S. Credit Rating
Moody's has downgraded the U.S. sovereign credit rating from Aaa to Aa1, citing concerns over rising national debt and interest payment ratios. This move aligns Moody's with previous downgrades by Fitch and S&P Global, potentially impacting investor sentiment and increasing market volatility.
🛍️ Retail Earnings in Focus
Major U.S. retailers, including Home Depot ( NYSE:HD ), Lowe’s ( NYSE:LOW ), Target ( NYSE:TGT ), TJX Companies ( NYSE:TJX ), Ross Stores ( NASDAQ:ROST ), and Ralph Lauren ( NYSE:RL ), are set to report earnings this week. Investors will be closely monitoring these reports for insights into consumer spending patterns amid ongoing tariff concerns.
💬 Federal Reserve Officials Scheduled to Speak
Several Federal Reserve officials, including Governor Michelle Bowman and New York Fed President John Williams, are scheduled to speak this week. Their remarks will be scrutinized for indications of future monetary policy directions, especially in light of recent economic data and market developments.
📊 Key Data Releases 📊
📅 Monday, May 19:
8:30 AM ET: Federal Reserve Bank of Atlanta President Raphael Bostic speaks.
8:45 AM ET: Federal Reserve Vice Chair Philip Jefferson and New York Fed President John Williams speak.
10:00 AM ET: U.S. Leading Economic Indicators for April.
📅 Tuesday, May 20:
8:30 AM ET: Building Permits and Housing Starts for April.
10:00 AM ET: Federal Reserve Bank of Minneapolis President Neel Kashkari speaks.
📅 Wednesday, May 21:
10:00 AM ET: Existing Home Sales for April.
10:30 AM ET: EIA Crude Oil Inventory Report.
📅 Thursday, May 22:
8:30 AM ET: Initial Jobless Claims.
9:45 AM ET: S&P Global Flash U.S. Manufacturing and Services PMI for May.
📅 Friday, May 23:
10:00 AM ET: New Home Sales for April.
⚠️ Disclaimer:
This information is for educational and informational purposes only and should not be construed as financial advice. Always consult a licensed financial advisor before making investment decisions.
📌 #trading #stockmarket #economy #news #trendtao #charting #technicalanalysis

btc . recap . w3 . maymon to eager . wait mon to show its hand - cw!
. early LONG compound because of the bullish outlook
- tp2 108462
tue didn't ride momentum - blind bullish
. tp1 HIT
. missed SHORT at 10pm (UTC+2)
- should have traded the momentum of mon looking to form support during the week later . for more compound LONG
wed mid of range . cw
. no trade zone
thu
. waiting for run of aLow during ny
. compound LONG - 101485
. tp1 HIT
fri didnt catch enough upward momentum
. tp1 HIT
. last limit order for bullish continuation . tpo - 102862.5
wknd
. tp1 for weekly LONG idea finally hit
. duration 5d 22h
. +4.33%
conclusion :
trade what you see, go with momentum, but have a narrative.
outlook :
america downgraded from AAA to AA+ . People will turn hardcore bearish, once the price starts falling. this could be the trigger to find the long awaited drop - while having retail call out a bearmarket . massive potential here, to both sides. wOpen and monday full data (while keeping an close eye on tpo and footprint charts), are key .
