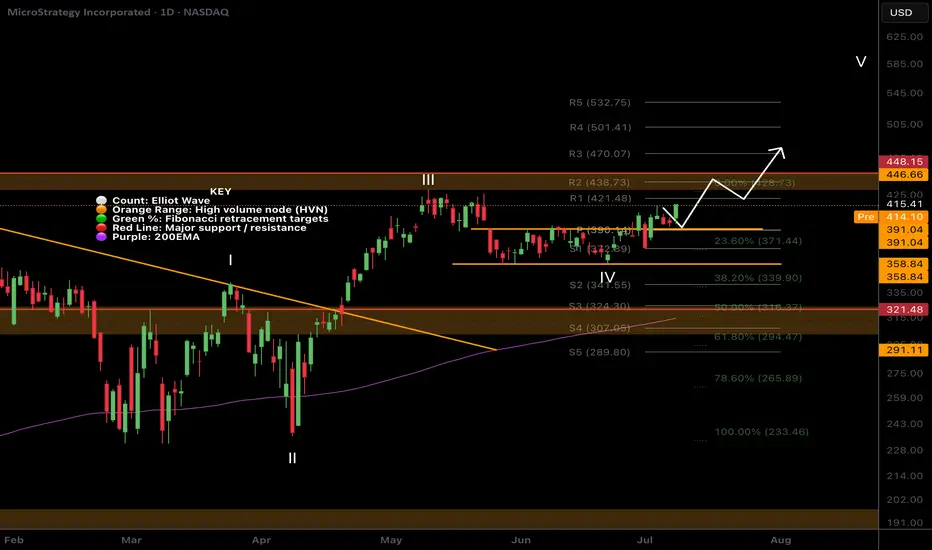
$MSTR Continues on last weeks path!NASDAQ:MSTR continues to breakout above the channel after a retest as support.
High Volume Node at $440 may proof tough but if price breaks through we could see a strong FOMO induced breakout into price discovery.
Analysis is invalidated below the channel at $358.
Safe Trading
Stocks!
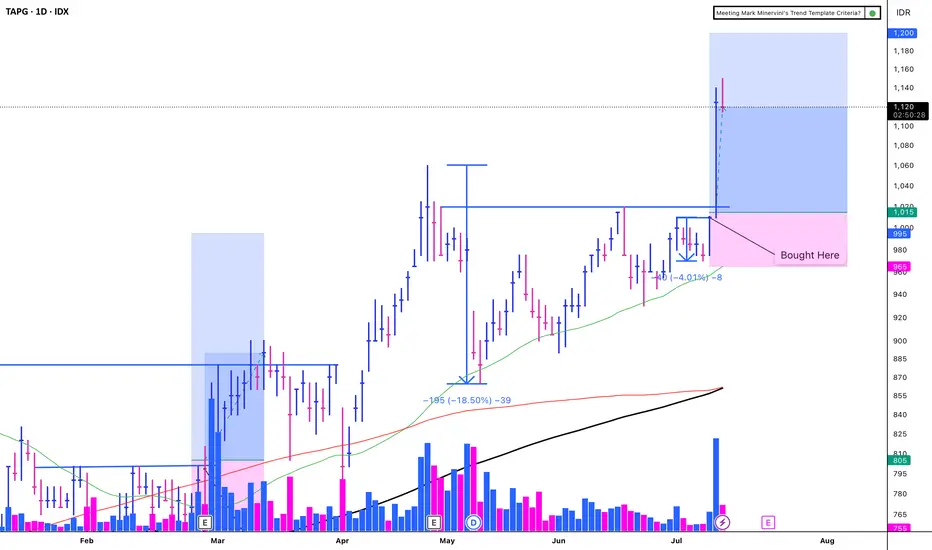
TAPG - VCP (11W 18/4 3T)IDX:TAPG - VCP
(+):
1. Low risk entry point on a pivot level.
2. Volume dries up.
3. Price has been above the MA 50 for over 10 weeks, with values exceeding 150, 200, and 300.
4. Price is within 25% of its 52-week high.
5. Price is over 30% of its 52-week low.
6. The 200-day MA has been trending upwards for over a month.
7. The RS Rating is above 70 (86).
8. There has been a significant breakout with substantial volume
**EPS Growth:**
a. Quarterly QoQ: -46.42%.
b. Quarterly YoY: +117.27%.
c. TTM YoY: +111.05%.
d. Annual YoY: +94.02%.
(-)
1. Trump Implements a 32% Increase in Tariffs on Indonesia
2. The market is volatile due to the ongoing war
SMCI - Bull Flag Breakout SetupSMCI formed a strong bullish impulse followed by a bull flag pattern.
A breakout above the flag structure may signal continuation if confirmed with strong price action.
Trade Plan:
• Entry: On breakout or retest
• Stop Loss: Below flag support
• TP1: Recent high
• TP2: Measured flagpole extension
This setup is worth monitoring for potential bullish continuation.
Disclaimer: This is not financial advice. For educational purposes only.

Nightly $SPY / $SPX Scenarios for July 10, 2025🔮 Nightly AMEX:SPY / SP:SPX Scenarios for July 10, 2025 🔮
🌍 Market-Moving News 🌍
🏦 Global Banks Profit from Tariff Volatility
Major banks like JPMorgan, BofA, and Citigroup are expected to see ~10% growth in trading revenue in Q2, fueled by volatility from President Trump’s tariff policy shifts. Treasury trading volumes hit record highs as markets priced in policy swings
📈 S&P 500 Nears Lull Amid Bull Market Strains
Despite record highs in 2025, investors are warning that the rally may be reaching its limit. Bullish sentiment is strong, but analysts caution that sluggish consumer spending, rising inflation from tariffs, and few rate-cut signals from the Fed could cap downside momentum
🐻 Bear Case Gains Ground
Stifel’s Barry Bannister projected a potential ~12% correction in the second half of 2025. Key risks include slowing consumer spending, weak capital investment under tariff uncertainty, and persistent core inflation above 3%, negatively impacting earnings and growth outlooks
⚖️ “One Big Beautiful Bill” Could Add Trillions in Debt
The new fiscal package signed July 4 will add $3–4 trillion to national debt over the next decade while extending tax cuts and revising EV incentives. Bond market and Fed policy implications may become more pronounced if growth fails to keep pace
📊 Stocks vs Bonds: Diverging Signals
While equities climb and megacaps extend gains, Treasury yields have risen five days straight—signaling growing caution over real growth prospects. The yield curve steepening hints at mixed signals: growth optimism in stocks, but bond market signaling economic risk ahead
📊 Key Data & Events
📅 Thursday, July 10:
No major scheduled economic releases. Markets remain driven by tariff headlines, bank earnings reactions, and evolving Fed signals.
⚠️ Disclaimer:
This is for informational and educational purposes only—not financial advice. Consult a licensed advisor before making investment decisions.
📌 #trading #marketvolatility #tariffs #banks #Fed #debt #technicalanalysis
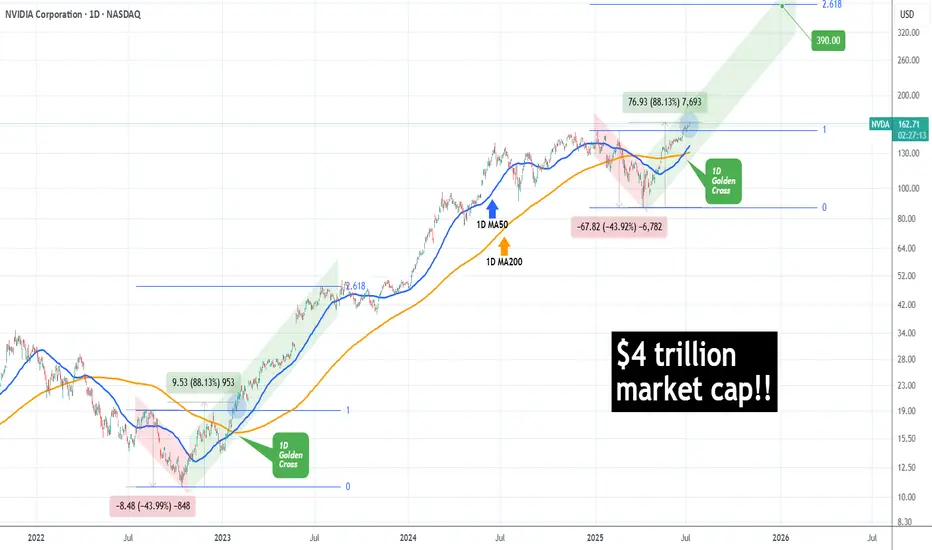
NVIDIA made history! First company with $4 trillion market cap!NVIDIA Corporation (NVDA) became today the first company in history to surpass a $4 trillion market value, as A.I. bulls extended the recent rally and pushed the price past the approximate $163.93 level needed to reach this market capitalization threshold.
The long-term trend on the 1D time-frame couldn't look more bullish. Coming off a 1D Golden Cross less than 2 weeks ago, the price has turned the 1D MA50 (blue trend-line) into Support and sits at +88.13% from the April 07 2025 Low.
This is the exact set-up that the market had when it was coming off the 2022 Inflation Crisis bottom (October 13 2022). As you can see, both fractals started with a -44% decline, bottomed and when they recovered by +88.13%, there were just past a 1D Golden Cross. In fact that Golden Cross (January 24 2023) was the last one before the current.
NVIDIA entered a Channel Up (green) on its recovery and for as long as the 1D MA50 was supporting, it peaked on the 2.618 Fibonacci extension before it pulled back below it.
If history repeats this pattern, we are looking at a potential peak around $390, which may indeed seem incredibly high at the moment, but as we pointed out on previous analyses, the market is in the early stages of the A.I. Bubble, similar to the Internet Bubble of the 1990s.
-------------------------------------------------------------------------------
** Please LIKE 👍, FOLLOW ✅, SHARE 🙌 and COMMENT ✍ if you enjoy this idea! Also share your ideas and charts in the comments section below! This is best way to keep it relevant, support us, keep the content here free and allow the idea to reach as many people as possible. **
-------------------------------------------------------------------------------
💸💸💸💸💸💸
👇 👇 👇 👇 👇 👇
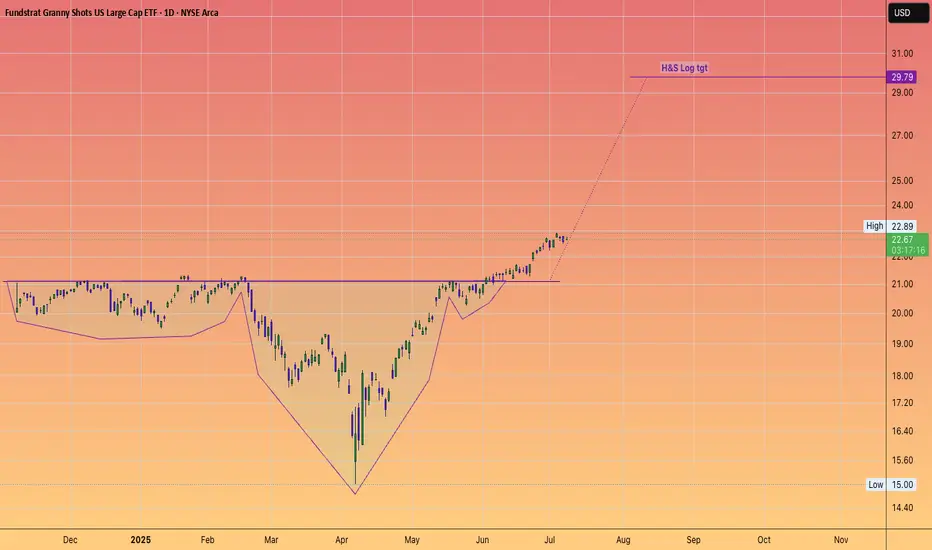
TOM LEE leading the charge in this new BULL MarketThank you for providing excellent analysis,
being on the right side of the trade
and helping retail with your public speaking on your own channel, podcasts, and of course CNBC.
I wish you continued success in you Granny shots ETF which is already over $1.5 Billion in AUM!
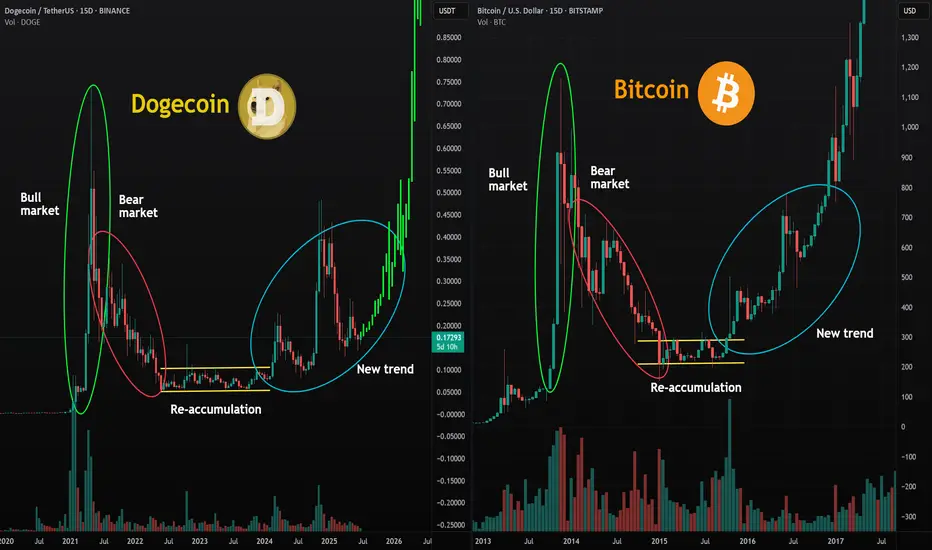
Dogecoin Will Shock Investors With Its Next Move!Today I’m doing an in-depth analysis of Dogecoin and its market cycle in comparison to the early Bitcoin cycles. As you can see, the same human psychology and emotions are playing out in the Dogecoin market that we previously saw with Bitcoin. With mass adoption coming to the cryptocurrency markets, it’s very possible we’ll see a parabolic run on Dogecoin similar to what we saw with Bitcoin in 2016 and 2017. This could lead us to a new all-time high.
Because markets are fractal in nature, we see similar patterns appearing over and over again. If you can learn to understand and identify these cycles and patterns, you can position yourself for maximum profit. I see Dogecoin running very bullish through the rest of 2025, and it could also continue into 2026 as mass adoption drives increasing demand for cryptocurrencies. In fact, we could see the entire crypto market run all the way into 2029, as the stock market is also primed for a large parabolic move in its own cycle.
Stocks and crypto are heavily correlated since both are tied to the global economy. Contrary to popular belief, the world economy may actually be set up for a massive run in value—almost like a “Roaring 20s 2.0.” This means buying Dogecoin today could be like buying Bitcoin in early 2016—the opportunity for profit is enormous.
As always, stay profitable.
- Dalin Anderson
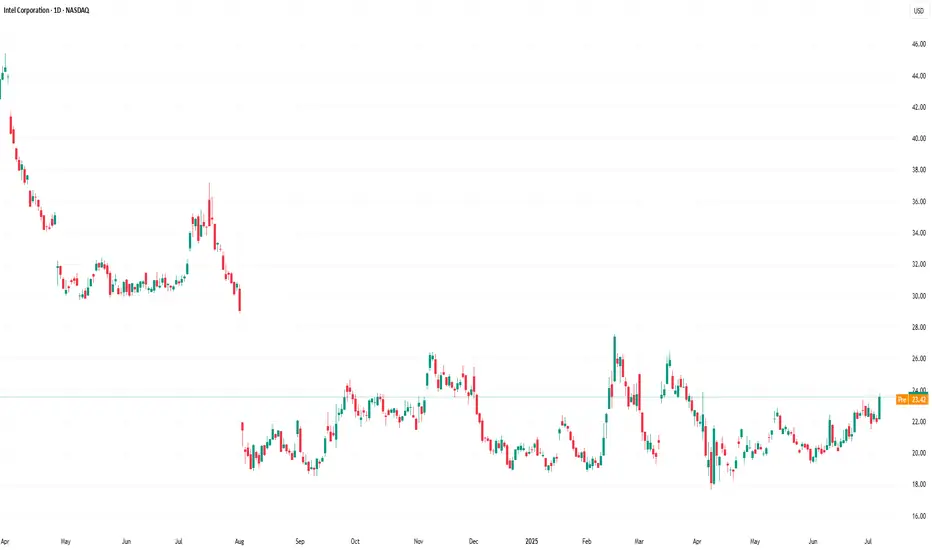
Intel Share Price Hits 3-Month High Without Clear CatalystIntel (INTC) Share Price Hits 3-Month High Without Clear Catalyst
Intel Corporation (INTC) stocks rose by over 7% yesterday, making them one of the top performers in the S&P 500 index (US SPX 500 mini on FXOpen). As a result, the stock price reached its highest level in three months.
What’s notable is the apparent lack of clear drivers behind the rally. According to Barron’s, the increase in INTC shares could have been triggered by a rating upgrade from Wall Street analysts or a corporate announcement – yet no such developments have occurred. "Nothing new or fundamental," says Mizuho managing director and technology specialist Jordan Klein.
At the same time, from a technical analysis perspective, the INTC price chart is showing significant developments. Examining these price movements may provide clues as to what’s fuelling the recent rise.
Technical analysis of INTC stocks
For many months, the share price had been confined within a downward channel. However, the psychological level of $20 acted as a strong support – repeated attempts by bears to push the price lower ultimately failed.
Bearish patterns in INTC’s chart may have led to a supply squeeze, as holders were given repeated reasons to sell (particularly against the backdrop of Nvidia’s success). Yet the bullish reversals near the $20 mark suggest that institutional interest was accumulating the stock at what was perceived to be a deeply discounted level – a characteristic sign of the Accumulation Phase in Wyckoff methodology.
It is this lack of available supply that could explain the sudden price rise in the absence of obvious news catalysts.
Since early summer, INTC shares have been making higher highs and higher lows, breaking upwards through the descending channel and beginning to form the early stages of a new bullish trend (highlighted in blue). Should fundamental catalysts emerge in the near term, they may serve as the spark to accelerate this nascent rally.
This article represents the opinion of the Companies operating under the FXOpen brand only. It is not to be construed as an offer, solicitation, or recommendation with respect to products and services provided by the Companies operating under the FXOpen brand, nor is it to be considered financial advice.
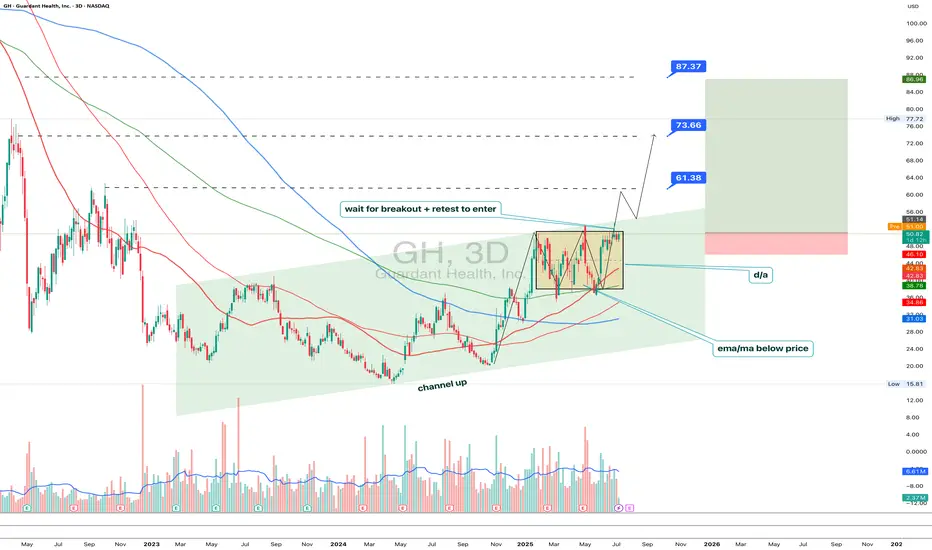
GH 3D: breakout forming inside ascending channelThe price of GH continues consolidating within the top of an ascending channel, confirming bullish structure. The rectangular accumulation has lasted for over three months, with price staying above all major EMAs and MAs - a strong trend confirmation. On the last impulse, volume increased, and now the price is compressing again. A breakout with a retest would serve as a valid entry. First target lies near 61.38, second at 73.66, and third at 87.37 - aligned with the upper range of the medium-term Fibonacci extension. Fundamentally, GH remains a promising biotech pick amid sector rotation and potential Fed easing. EMAs and MAs sit below price, and D/A supports the breakout scenario. Waiting for confirmation before entering.
Nightly $SPY / $SPX Scenarios for July 9, 2025🔮 Nightly AMEX:SPY / SP:SPX Scenarios for July 9, 2025 🔮
🌍 Market-Moving News 🌍
📦 Tariff Pause Extended to August 1
President Trump delayed the July 9 tariff deadline, pushing negotiations into early August. Markets reacted with muted volatility, suggesting growing comfort that deals will be struck—yet widespread uncertainty remains
💵 Junk Bonds Rally Amid Tariff Tangling
Despite ongoing tariff risks, investors are doubling down on U.S. high-yield (junk) bonds. They anticipate the Fed may refrain from tightening further—favoring spread-tightening to around 7–8% yields—reflecting confidence in credit quality
🏦 Fed Faces Tough Call on Rate Path
New business surveys show conflicting signals: mixed revenue outlooks, cautious spending, and ongoing tariff pressures. The Fed must weigh slower growth against inflationary risks—keeping the door open to rate cuts in the autumn but unlikely before September
📊 Equities Firm Amid Tariff Uncertainty
Stocks showed resilience—S&P 500 and futures held position—after Monday’s tariff-triggered dip. Dip-buying and expectations of extended trade talks kept markets steady despite policy noise
📊 Key Data Releases & Events 📊
📅 Wednesday, July 9:
All Day – Ongoing U.S.–tariff negotiations; markets focused on any progress toward formal deal-making or extension terms.
Midday – Watch for headlines on tariff letters to 14 countries and any movement in trade discussions.
⚠️ Disclaimer:
This information is for educational and informational purposes only and should not be construed as financial advice. Always consult a licensed financial advisor before making investment decisions.
📌 #trading #stockmarket #economy #tariffs #Fed #fixedincome #credit #technicalanalysis
Carvana Leading Auto Retail – Outpacing LAD & AN-Financial Performance & Momentum:
Carvana reported a record-breaking adjusted EBITDA of $488M in Q1 2025, up $253M YoY, with an EBITDA margin of 11.5% (+3.8pp YoY). The company's strong operational efficiency positions it as a leader in the auto retail industry, nearly doubling the margins of competitors like Lithia Motors (LAD) and AutoNation (AN).
- Competitive Positioning & Growth Outlook:
Carvana’s EBITDA quality is superior due to lower non-cash expenses, enhancing long-term sustainability. The company expects sequential EBITDA growth in Q2 and targets 13.5% EBITDA margins within 5-10 years.
-Peer Comparison:
- Lithia Motors (LAD): EBITDA margin at 4.4% (up from 4% YoY), facing tariff-related headwinds that could impact pricing and demand.
- AutoNation (AN): SG&A as a percentage of gross profit rose to 67.5% in Q1, expected to stay between 66-67% in FY 2025, pressuring margins further.
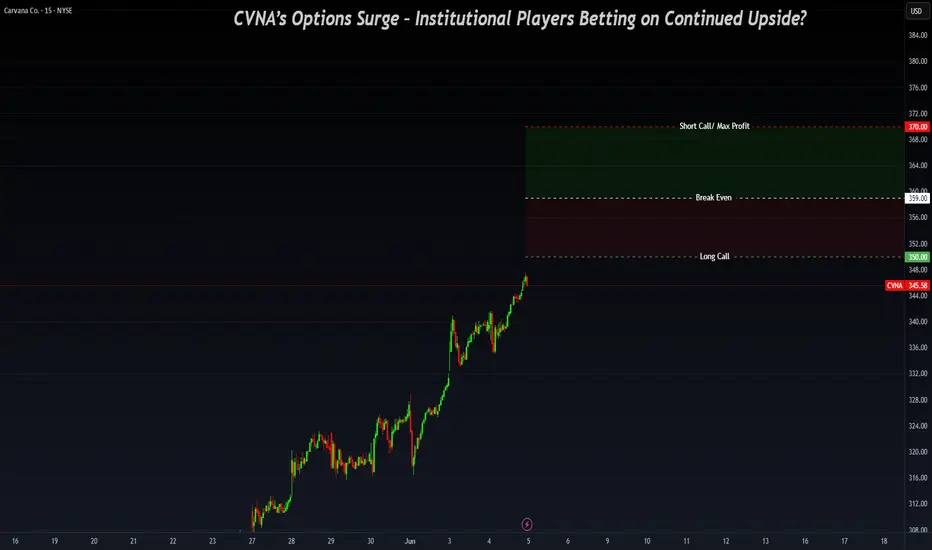
-Options Flow & Institutional Activity - Key Levels: $350/$370
Recent institutional flow activity indicates strong positioning around $350/$370 strikes, potentially signaling a vertical spread in play rather than outright selling:
1️⃣ Momentum Confirmation:
- CVNA has strong upside momentum following its Q1 results, reinforcing a bullish outlook for near-term price action.
- Institutional traders may be accumulating bullish vertical spreads rather than unwinding positions.
Vertical Spread Setup ($350/$370 Strikes)
- Long Call ($350 Strike) → Signals expectations for further upside.
- Short Call ($370 Strike) → Caps max profit while reducing cost.
- Breakeven Price: $359 → CVNA must close above $359 for profitability.
Profit & Risk Zones
- Above $370: Maximum profit achieved.
- Between $359-$370: Partial profit zone (spread remains in play).
- Below $359: Spread loses value, making recovery dependent on extended upside momentum.
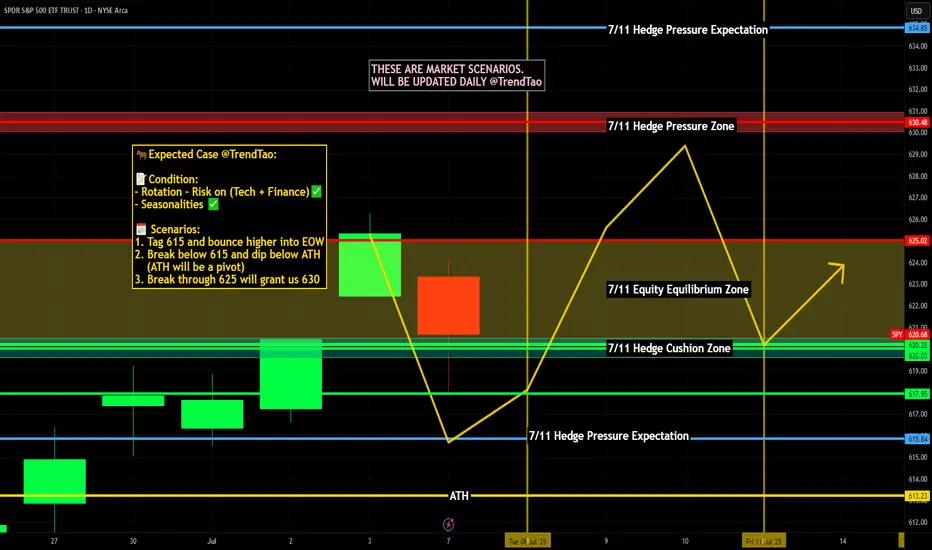
SPX - Are you catching the rotation trends? SPX is still holding very bullish price action. Technicals are pointing towards higher price and todays inside consolidation day certainly helps digest recent gains.
Along with the flat indices market session, we did observe some massive capital rotation trends.
Financials saw a pretty strong down move across the board. JPM / BAC / C all saw large outflows. We were positioned on the short side of financials and took profits on JPM puts.
Even with the big selloff in financials, SPX held up surprisingly well.
Capital simply rotated instead of outright leaving the market. Bullish Signal.
Technology, Energy, Materials, Health care, Transports all saw capital inflow trends.
Rotation into under preforming sectors is a sign that markets could be staging another healthy leg up.
We still have an upside target over 6300 on SPX.

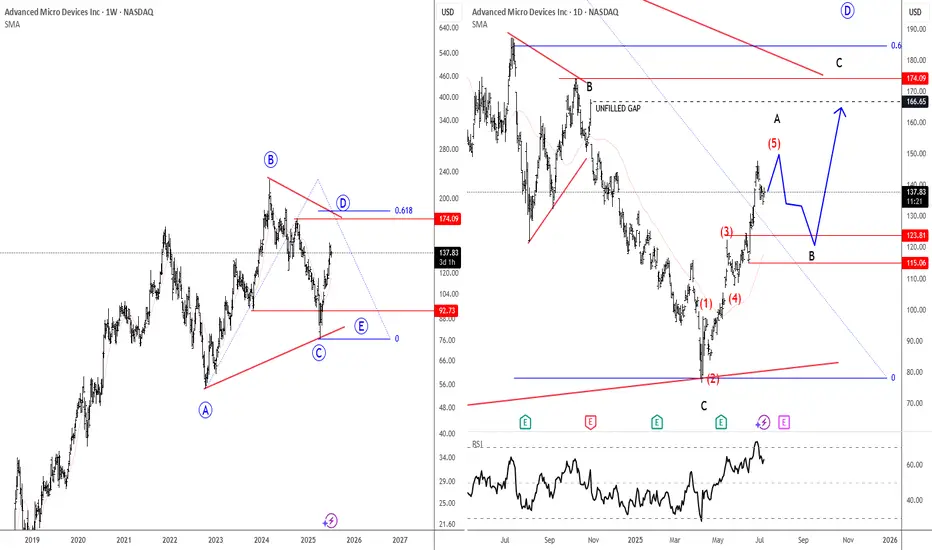
AMD: Elliott Wave Cycle Shows Impulsive RecoveryAMD has seen a deep retracement from its 2024 highs, but it now looks like the stock is trying to stabilize. However, a straight push to new highs may not be likely just yet, as we’re still tracking an ongoing running triangle—an A-B-C-D-E pattern.
Looking at the daily chart, things do look promising for more upside into wave D as we’re seeing a clean five-wave move up on the lower time frame, suggesting we may be in wave A of that D-leg. After a pullback, there could be some very interesting opportunities on the long side.
Support levels on dips to watch are around 115 and 123, while upward projections for this three-wave D-leg rally could be toward the 166 gap area and potentially 185.
Highlights:
Direction: Up after pullback
Support: 115–123
Upside projection: 166 (gap), 185
Grega
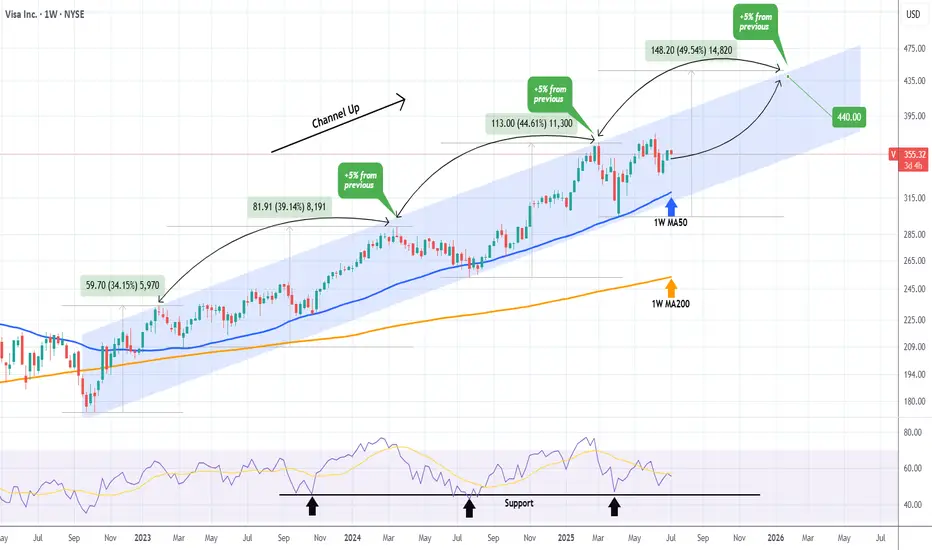
VISA on a strong Bullish Leg targeting $440.Visa Inc. (V) has been trading within a Channel Up pattern since the October 10 2022 market bottom. After December 2022, every test of the 1W MA50 (blue trend-line) has been the most optimal long-term buy opportunity, being also a Higher Low (bottom) of the pattern.
Every Bullish Leg has been +5% stronger than the previous, which leads us to believe that the current Bullish Leg will peak at around +49.50% (+5% from +44.60%). This translates to $440 Target towards the end of the year.
-------------------------------------------------------------------------------
** Please LIKE 👍, FOLLOW ✅, SHARE 🙌 and COMMENT ✍ if you enjoy this idea! Also share your ideas and charts in the comments section below! This is best way to keep it relevant, support us, keep the content here free and allow the idea to reach as many people as possible. **
-------------------------------------------------------------------------------
💸💸💸💸💸💸
👇 👇 👇 👇 👇 👇
BIG BEAUTIFUL BILL - Markets are Ready to PUMP Again! At the 4th of July, the Independence Day, the "One Big Beautiful Bill Act" was signed into law by President Trump. In this idea I want to take a closer look at some points of this law and explain why I consider it VERY bullish for most of financial markets, and especially for crypto.
Here are some key points of the law:
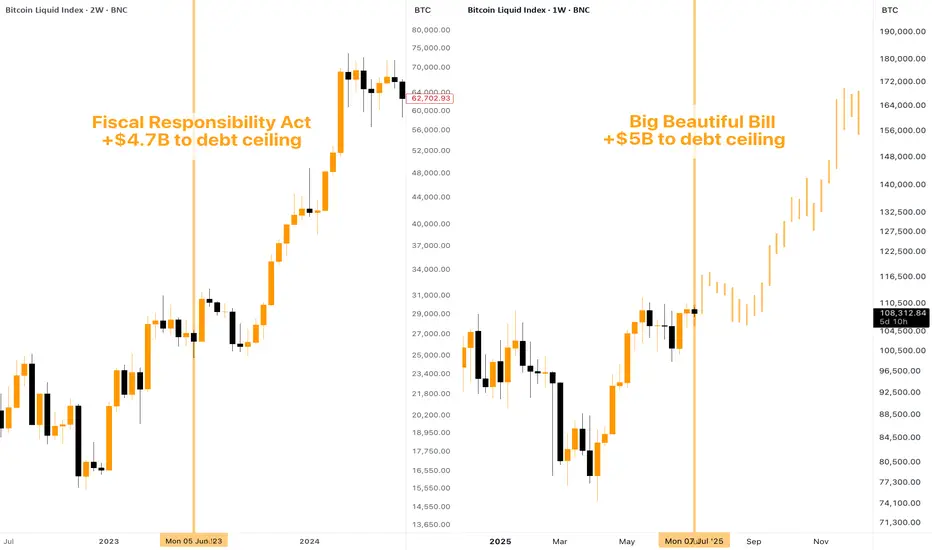
Raises the U.S. debt ceiling by $5 trillion, the largest single increase in U.S. history
Makes many Trump-era 2017 tax cuts permanent: keeps lower individual tax rates, preserves expanded standard deduction, retains corporate tax rate at 21%
Introduces new tax breaks: increases Child Tax Credit, exempts tips, overtime, and Social Security from federal income tax (with limitations)
Adds ~$150 billion to defense and another $150 billion toward border enforcement, including massive ICE budget increase
Trims SNAP food aid by ~$186–200 billion, tightening eligibility (e.g. raising work‑requirement age)
What changes can happen in the economy? Big tax breaks combined with increased expenses cause the growth of financial deficit, the projected by CBO deficit can reach $3 trillion. In this situation the only solution is increasing the national debt which makes Interest Rates climb higher (Yale’s Budget Lab forecasts a 1.2 pp increase in the 10‑year yield).
Why do I think this is bullish for most of stocks and mainly for crypto?
The increase of debt ceiling has always had a positive impact on the crypto and namely on $BTC. The best example is Fiscal Responsibility Act that was signed back in June 5, 2023. This act increased the debt ceiling for +$4.7 billion, after that Bitcoin surged upwards from $25,000 to $75,000 in ~half a year. Similar outcome can be expected now too.
Market perceives U.S. fiscal loosening as inflationary and dollar-weakening, making Bitcoin (as a decentralized and limited-supply asset) more attractive. TVC:DXY has already shown signs of weakness.
Large deficits often force future monetary easing or Fed bond buying to absorb debt. Lower interest rates and more liquidity are historically bullish for risk assets, including crypto.
Rising yields and bond sell-offs spook traditional markets. In this situation, Bitcoin becomes an attractive uncorrelated hedge for portfolios amid volatility in traditional assets.
To sum up , I believe the Big Beautiful Law is, to put it mildly, not good for US economy. However, local effects on stock & crypto markets can be considered positive for investors & traders. With this said, I believe we can expect CRYPTOCAP:BTC to reach $150,000 goal this year and mark this milestone as an ATH for the current bull cycle.
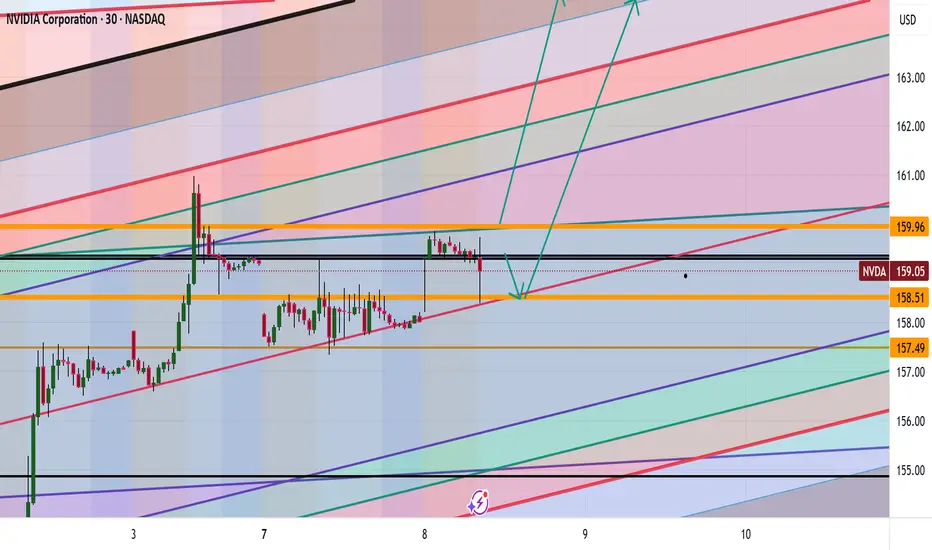
NVDA Analysis To 164?Quick breakdown of NVDA
Appears we hit our corrected level, we could go deeper possibly or hold at this level and drive up to 164
This is looking like a nice little setup long indeed
Trade Smarter Live Better
Kris/Mindbloome Exchange
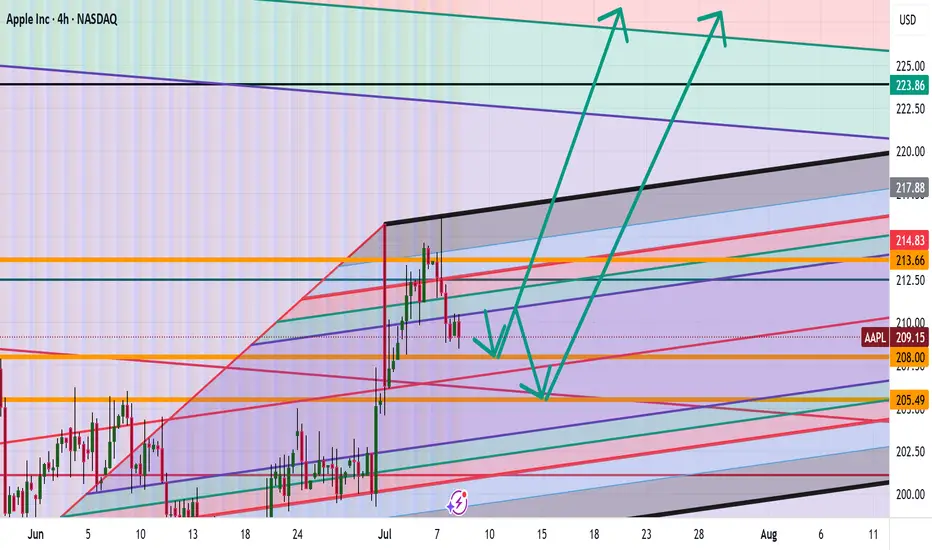
AAPL can we hit 260?
Appears we are making a correction down to the levels of 208 then if that does not hold 205 with a possible drive up to the 260.
Question is are we going drive deeper with the correction ?
Be Careful folks this is a wild one
Trade Smarter Live Better
Kris/Mindbloome Exchange
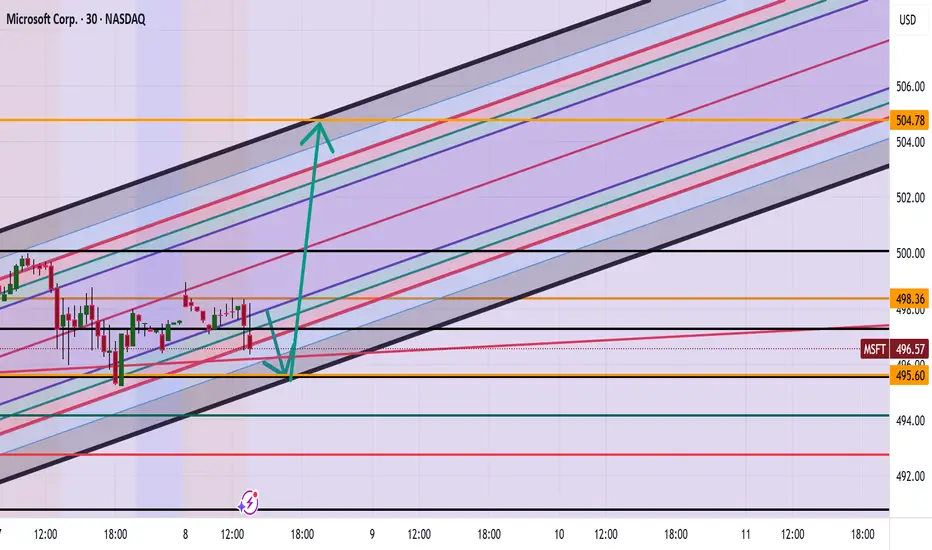
MSFT Correction then to 504?Morning everyone
Currently we are seeing a possible correction to the 495 zone with a possible break to the upside to 504 is what we are currently seeing.
Trade Smarter Live Better
Kris/Mindbloome Exchange
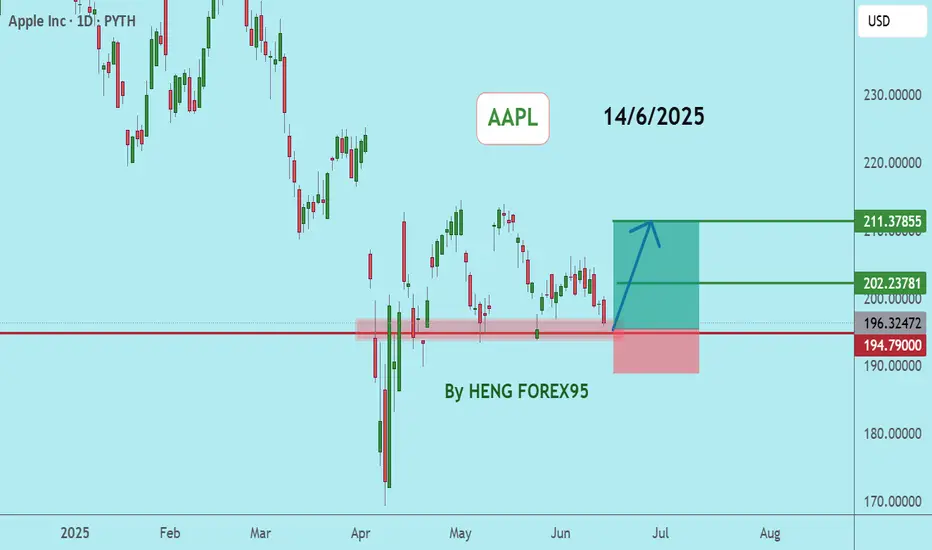
AAPLAAPL price is near the support zone 195-193. If the price can still stand above 193, it is expected that the price will rebound. Consider buying in the red zone.
🔥Trading futures, forex, CFDs and stocks carries a risk of loss.
Please consider carefully whether such trading is suitable for you.
>>GooD Luck 😊
❤️ Like and subscribe to never miss a new idea!
UNH How Far Down Are We Going $32 ? Based on the current class action lawsuit sentiment is negative and if it continues we can see levels of 258 being hit again. However if we break that level down then 163-150 level can possibly get hit followed by the 32-49 dollar range.
However despite all the negative news which does affect the market, if for whatever reasons we can break the high of 326 be prepared for a run up to 535 low probability but it is possible.
Trade Smarter Live Better
Kris/ Mindbloome Exchange

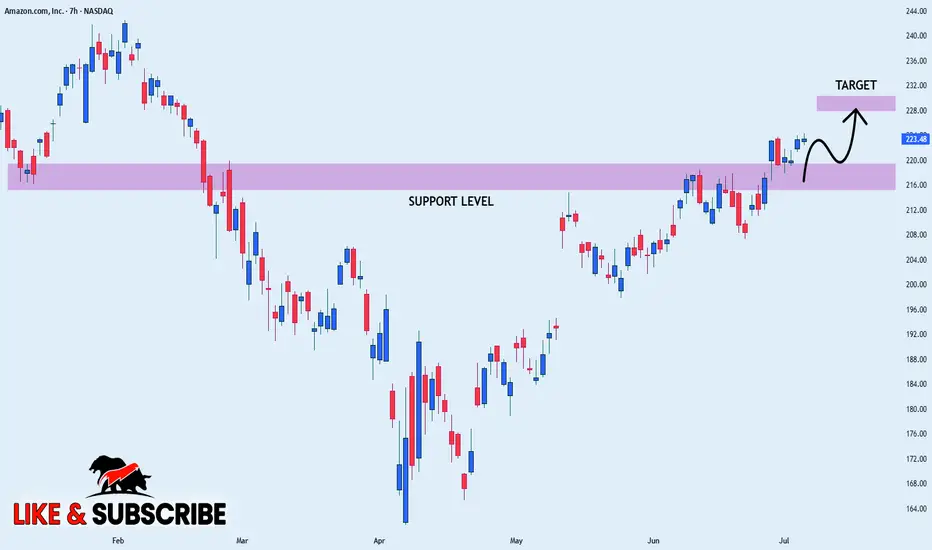
AMAZON STRONG UPTREND|LONG|
✅AMAZON is going up
Now and the stock made a bullish
Breakout of the key horizontal
Level of 220$ and the breakout
Is confirmed so we are bullish
Biased and we will be expecting
A further bullish move up
LONG🚀
✅Like and subscribe to never miss a new idea!✅
Disclosure: I am part of Trade Nation's Influencer program and receive a monthly fee for using their TradingView charts in my analysis.
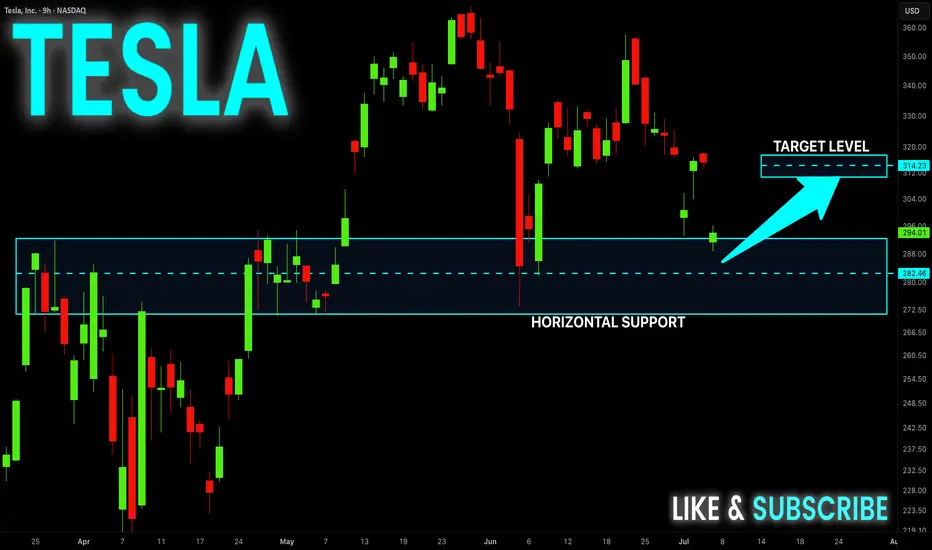
TESLA Reached The Support! Buy!
Hello,Traders!
TESLA gaped down on
Monday but the move was
Held up by a massive support
Area ending around 272$ and
As the support is strong we
Will be expecting a rebound and
A move up from the level
Buy!
Comment and subscribe to help us grow!
Check out other forecasts below too!
Disclosure: I am part of Trade Nation's Influencer program and receive a monthly fee for using their TradingView charts in my analysis.
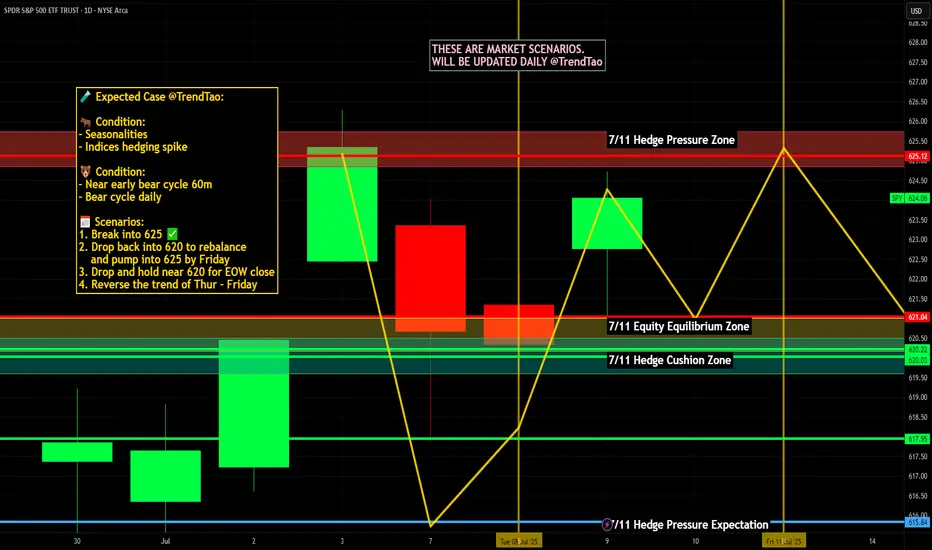
Nightly $SPY / $SPX Scenarios for July 8, 2025🔮 Nightly AMEX:SPY / SP:SPX Scenarios for July 8, 2025 🔮
🌍 Market-Moving News 🌍
📉 U.S. Stocks Slip on New Tariff Threats
President Trump announced plans to impose 25% tariffs on imports from Japan, South Korea, Malaysia, Kazakhstan, South Africa, Laos, and Myanmar starting August 1, reigniting trade jitters. The Dow fell ~0.9%, the S&P 500 dropped ~0.8%, and the Nasdaq slid ~0.9% on the news, while bond futures rallied and the dollar strengthened
⚖️ Tariff Pause Deadline Looms
Markets are focused on the July 9 deadline for the current tariff pause, which now hinges on imminent trade negotiations. Investors are balancing the risk of reimposition against progress with agreements involving the U.K., Vietnam, and Canada
💵 Consumer Credit Moderates
June’s consumer credit increase slowed to $10.60 billion vs. April’s $17.87 billion—still strong, but a cooling sign in household borrowing patterns. This tempered the dollar’s rise amid mixed signals on consumer resilience.
🛢️ Oil Drops on Rising OPEC+ Supply
Oil prices fell, with Brent dipping to ~$68.00/barrel and WTI to ~$65.30, after confirmation of OPEC+’s August supply hike—adding to bearish cues for energy stocks .
📊 Key Data Releases & Events 📊
📅 Tuesday, July 8:
3:00 PM ET – Consumer Credit (June)
Moderation in borrowing signals possible easing in consumer-driven growth.
4:30 PM ET – API Weekly Crude Inventories
A key indicator for energy markets; lower inventories lift oil prices, while builds push them down.
Throughout the Day – Tariff Pause Deadline
Market stability hinges on whether trade agreements materialize before the break expires.
⚠️ Disclaimer:
This information is for educational and informational purposes only and should not be construed as financial advice. Always consult a licensed financial advisor before making investment decisions.
📌 #trading #stockmarket #economy #tariffs #consumercredit #oil #technicalanalysis