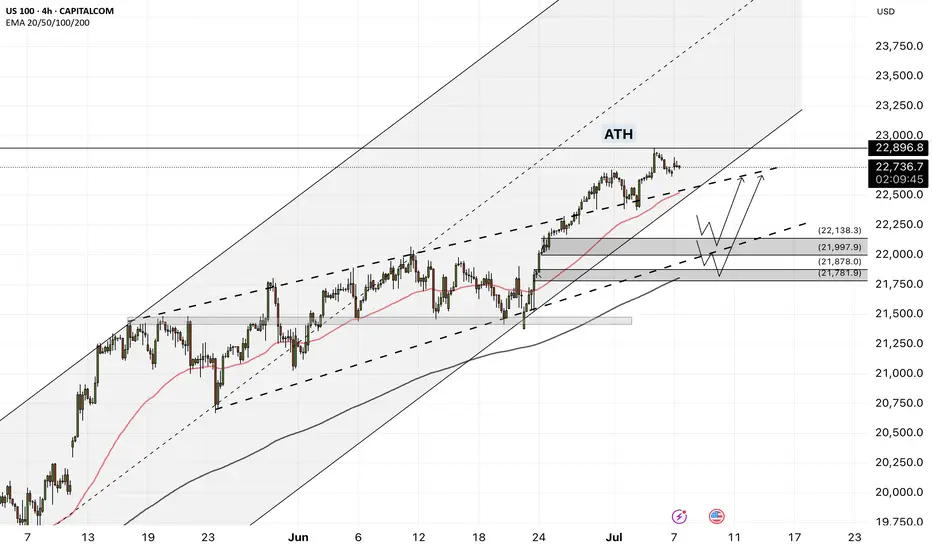
NAS100 - Stock market is waiting for tariffs!The index is above the EMA200 and EMA50 on the four-hour timeframe and is trading in its ascending channel. Maintaining the ascending channel will lead to the continuation of the Nasdaq's upward path to higher targets, but if it does not rise and corrects towards the demand limits, you can buy the Nasdaq index with appropriate reward and risk.
Three months ago, Donald Trump postponed the imposition of severe retaliatory tariffs, granting America’s major trading partners more time to reach new agreements that Washington views as “fairer.” Now, as the White House’s July 9 deadline approaches, only two official trade deals have been finalized—one with the United Kingdom and another with Vietnam. As for China, merely a fragile temporary truce has been reached, which has so far prevented any additional tariffs from being enforced.
Although reports suggest promising progress in negotiations with India, Japan, and South Korea, no final agreements have been secured with these countries yet. Interestingly, talks with the European Union—which had previously stalled—have suddenly taken a positive turn, and prospects for a deal with Canada in the coming days have also improved.
However, given the limited time left, it seems unlikely that trade agreements with all of America’s 18 key partners will be reached before the deadline. This situation has raised a critical question for the markets: Will Trump set a new deadline for the remaining countries, or will the suspended tariffs be reinstated?
The prevailing view is that the U.S. president will once again resort to threats before granting any extensions—this time not merely by reviving the “Liberation Day” tariffs, but also by promising even heavier tariffs to extract the last concessions from the remaining trade partners.
U.S. Treasury Secretary Scott Bassett stated that if no agreements are reached by August 1, tariffs will revert to the levels announced in April. He also emphasized that Washington’s core strategy in these trade talks is to apply maximum pressure. According to Bassett, letters will be sent to various countries, outlining the August 1 deadline for reaching deals. This news, which broke during the market’s closing hours, sparked a wave of risk appetite in the financial markets.
In a week when the U.S. economic calendar is notably devoid of major data releases, investors are focusing their attention on the minutes from the Federal Reserve’s June FOMC meeting—a document that could offer fresh insights into the trajectory of interest rates for the second half of the year.
June’s strong employment report, which exceeded market expectations, has effectively dashed hopes for an interest rate cut this month. Now, if the positive economic momentum persists, the likelihood of a rate cut in the September meeting may also gradually be priced out by the markets.
According to data from Challenger, Gray & Christmas, U.S. employers announced 47,999 job cuts in June, marking a sharp decline from 93,816 in the previous month. Compared to June of last year, layoffs have dropped by 2%. However, total job cuts in the second quarter of 2025 reached 247,256—a 39% increase from the same period last year (177,391) and the highest second-quarter layoff figure since 2020.
With no significant economic reports scheduled for the coming days, investors will be closely analyzing Wednesday night’s Fed minutes and the limited remarks from central bank officials—statements where every word has the potential to significantly move the markets.
Stocks!
Weekly $SPY / $SPX Scenarios for July 7–11, 2025🔮 Weekly AMEX:SPY / SP:SPX Scenarios for July 7–11, 2025 🔮
🌍 Market‑Moving News 🌍
📈 From Panic to "Goldilocks" Rally
The S&P 500 and Nasdaq hit fresh record highs, surging ~20% from April lows. Markets rallied on a combination of easing Middle East tensions, the 90‑day tariff pause, a new fiscal bill in Washington, and strong June jobs data. Still, strategists caution that optimism may be ahead of fundamentals, especially if trade volatility returns
💱 Dollar Weakness & Bond Market Watch
The U.S. dollar remains near 3.5‑year lows amid rate‑cut speculation and trade progress. Treasury yields are volatile this week, impacted by concerns over escalating debt issuance, upcoming tariff deadlines (July 9), and the Federal Reserve’s stance .
🏢 Tech Leadership Shifts
With the “Magnificent Seven” tech stocks near heights, growth is spreading: cyclical sectors, small‑caps, and industrials are gaining momentum. AI remains the primary engine, but resilience across a broader stock base is signaling a potentially sustainable rally
⚠️ Tariff Truce Deadline Looms (July 9)
The April tariff pause expires mid‑week. U.S. plans to extend exemptions via trade talks with partners like UK, Vietnam, and Canada—yet any delay or failure may shock markets. Watch for headlines that may trigger spillover effects .
📊 Key Data Releases & Events 📊
📅 Monday, July 7:
Independence Day markets resume. Light trading expected ahead of data and tariff deadline.
📅 Tuesday, July 8:
10:00 AM ET – Consumer Credit (June)
Gauges borrowing trends—an indicator of household health in a low‑rate environment.
📅 Wednesday, July 9:
EIA Crude Oil Inventories & MBA Mortgage Apps & Wholesale Inventories
Key mid‑week data points; oil builds may pressure energy stocks.
Tariff Pause Deadline – Expect market volatility on news of extension or reimposition.
📅 Thursday, July 10:
8:30 AM ET – Initial & Continuing Jobless Claims
10:00 AM ET – Natural Gas Inventories
Markets focus on labor health and energy trends.
📅 Friday, July 11:
10:00 AM ET – Treasury Budget Statement
Details on government borrowing and fiscal outlook—markets sensitive to deficit risks.
⚠️ Disclaimer:
These insights are for educational purposes only—not financial advice. Consult a licensed advisor before making investing decisions.
📌 #trading #stockmarket #economy #news #tariffs #Fed #AI #technicalanalysis

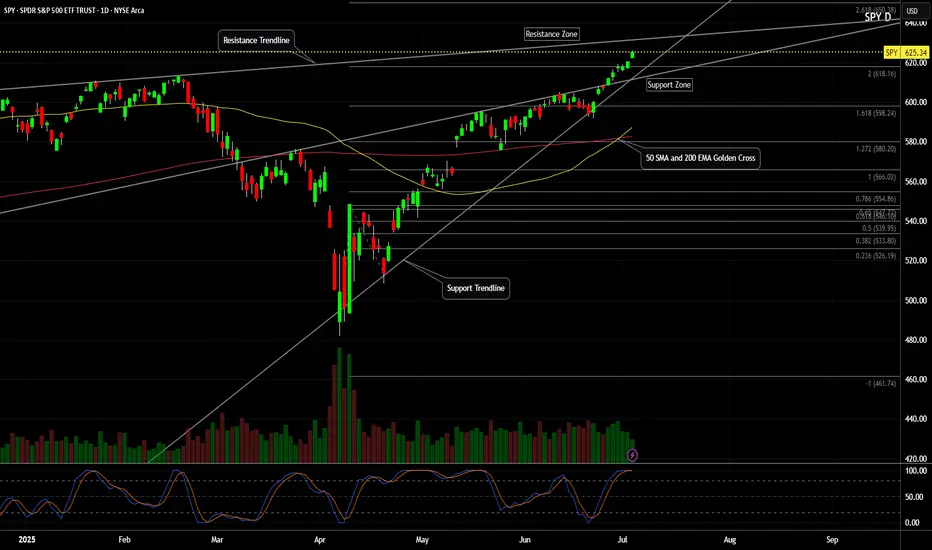
SPY (S&P500 ETF) - Daily Golden Cross and All-Time-High PriceSPY (S&P500 ETF) price has reached all-time-highs in July 2025, after a SMA Golden Cross printed on the daily chart.
SPY is still in a price uptrend since May 2025, however a higher-low pullback has not occurred for the past two weeks.
Resistance levels: $625, $630, $635, $640.
Support levels: $622, $617, $614, $611.
A significant reversal or bearish candle pattern has not occurred yet on either the daily or weekly charts.
The Stochastic RSI indicator has reached overbought levels, both on the Daily chart and Weekly chart.
Stock market earnings season begins in July 2025, trade deal negotiations and new tariffs are in progress this week. Volatility could increase this month due to these news catalysts.
NMLStarting to move high from key polarity zone. Just like other textile companies, this one also looks good.
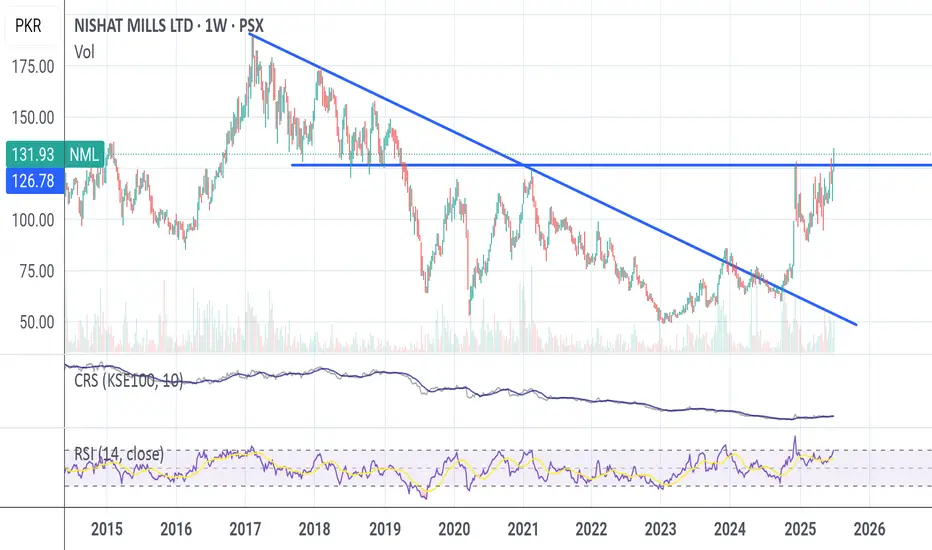
An entry for a long position incoming
It looks like a good entry point for a long position.
Close the position once the price hits the SR above or the Road level

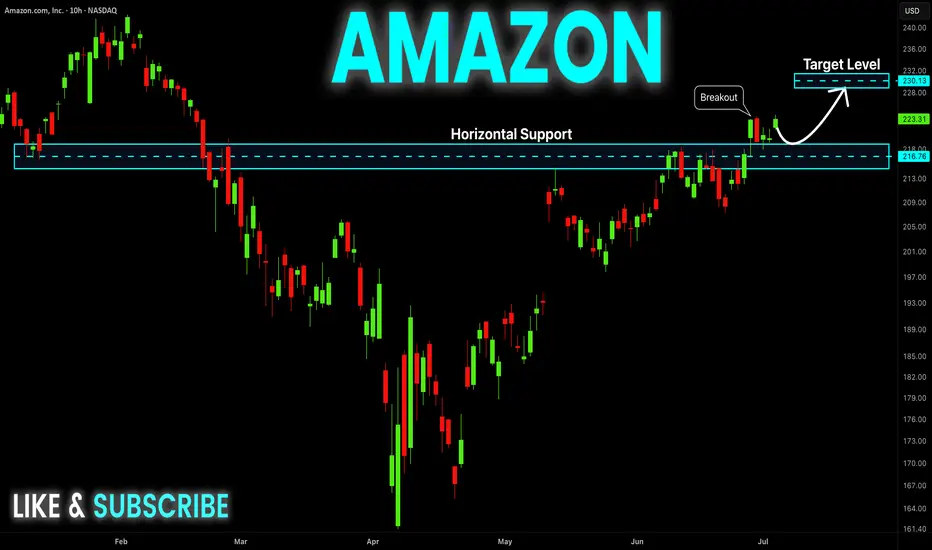
AMAZON Will Keep Growing! Buy!
Hello,Traders!
AMAZON is trading in an
Uptrend and the stock made
A breakout and retest of the
Key horizontal support
Of 218$ and is going up again
So we are bullish biased
And we will be expecting
A further bullish move up
Buy!
Comment and subscribe to help us grow!
Check out other forecasts below too!
Disclosure: I am part of Trade Nation's Influencer program and receive a monthly fee for using their TradingView charts in my analysis.
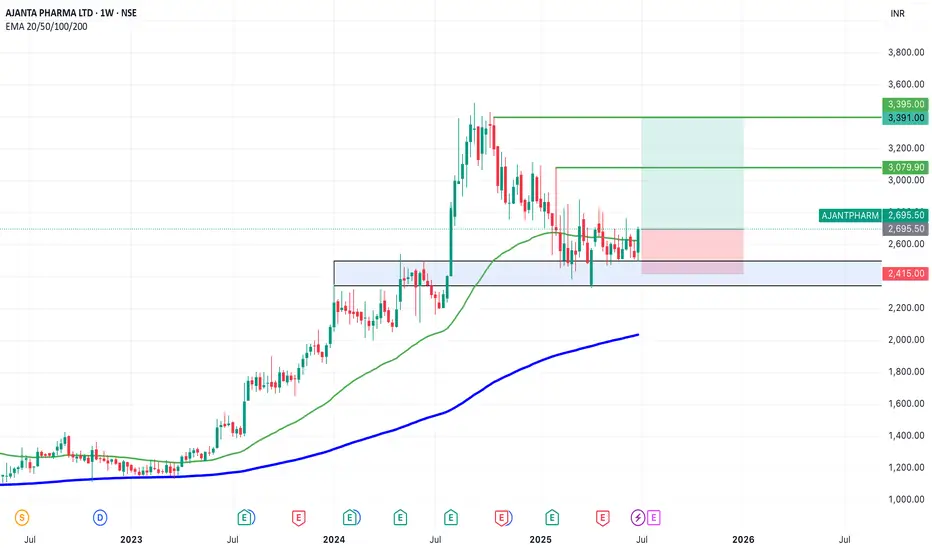
SWING IDEA - AJANTA PHARMAAjanta Pharma , a mid-cap pharma player with strong branded generics in ophthalmology, dermatology, and cardiology, is showing a compelling swing trade setup backed by a high-probability technical breakout.
Reasons are listed below :
Bullish engulfing candle on the weekly timeframe, indicating reversal strength
2,500 zone acting as a crucial support
Holding above 0.382 Fibonacci retracement level , suggesting healthy correction
Price trading above 50 & 200 EMA on the weekly chart – long-term strength intact
Breakout from narrow consolidation near the 50-week EMA
Target - 3080 // 3400
Stoploss - weekly close below 2415
DISCLAIMER -
Decisions to buy, sell, hold or trade in securities, commodities and other investments involve risk and are best made based on the advice of qualified financial professionals. Any trading in securities or other investments involves a risk of substantial losses. The practice of "Day Trading" involves particularly high risks and can cause you to lose substantial sums of money. Before undertaking any trading program, you should consult a qualified financial professional. Please consider carefully whether such trading is suitable for you in light of your financial condition and ability to bear financial risks. Under no circumstances shall we be liable for any loss or damage you or anyone else incurs as a result of any trading or investment activity that you or anyone else engages in based on any information or material you receive through TradingView or our services.
@visionary.growth.insights
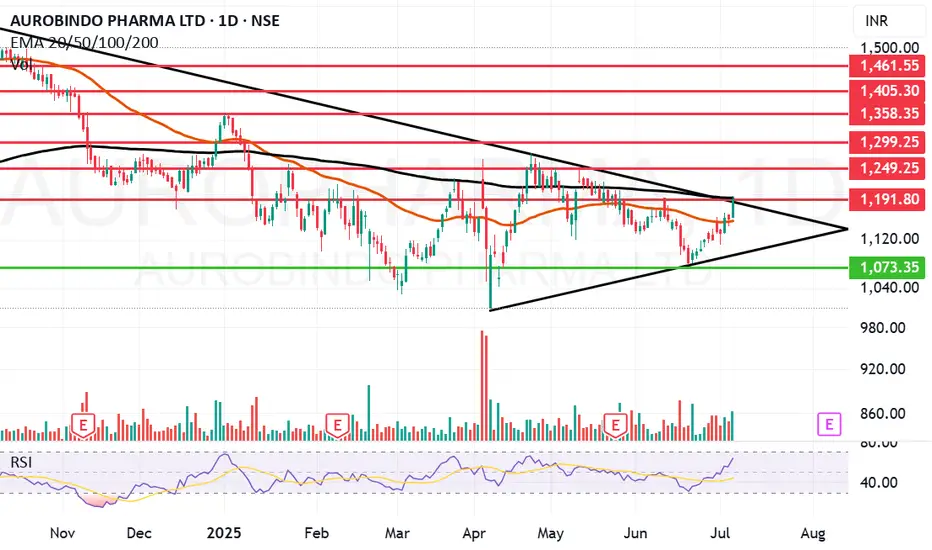
Aurobindo Pharma picking up momentum.Aurobindo Pharma Ltd. engages in the manufacturing of generic pharmaceuticals and active pharmaceutical ingredients. It operates under the following geographical segments: India, USA, Europe, and Rest of the World. Its portfolio includes antibiotics, anti-retroviral, cardiovascular, central nervous system, gastroenterological, anti-allergies, and anti-diabetics.
Aurobindo Pharma Ltd. Closing price is 1191.30. The positive aspects of the company are moderate Valuation (P.E. = 19.8), Strong cash generating ability from core business - Improving Cash Flow from operation, Companies with Low Debt, FII / FPI or Institutions increasing their shareholding, RSI indicating price strength and MFs increased their shareholding last quarter. The Negative aspects of the company are Stocks Underperforming their Industry Price Change in the Quarter and High promoter stock pledges.
Entry can be taken after closing above 1192 Historical Resistance in the stock will be 1249, 1299 and 1358. PEAK Historic Resistance in the stock will be 1403 and 1461. Stop loss in the stock should be maintained at Closing below 1073 or 986 depending upon your risk taking ability.
Disclaimer: The above information is provided for educational purpose, analysis and paper trading only. Please don't treat this as a buy or sell recommendation for the stock or index. The Techno-Funda analysis is based on data that is more than 3 months old. Supports and Resistances are determined by historic past peaks and Valley in the chart. Many other indicators and patterns like EMA, RSI, MACD, Volumes, Fibonacci, parallel channel etc. use historic data which is 3 months or older cyclical points. There is no guarantee they will work in future as markets are highly volatile and swings in prices are also due to macro and micro factors based on actions taken by the company as well as region and global events. Equity investment is subject to risks. I or my clients or family members might have positions in the stocks that we mention in our educational posts. We will not be responsible for any Profit or loss that may occur due to any financial decision taken based on any data provided in this message. Do consult your investment advisor before taking any financial decisions. Stop losses should be an important part of any investment in equity.
Niva Bupa gives a strong closing. Niva Bupa Health Insurance Co. Ltd. engages in the provision of health, travel, and corporate insurance services. It operates through the following segments: Health, Personal Accident, and Travel.
Niva Bupa Health Insurance Co. closing price is 85.05. The positive aspects of the company are Stocks Outperforming their Industry Price Change in the Quarter, Companies with Zero Promoter Pledge, Rising Net Cash Flow and Cash from Operating activity, RSI indicating price strength and FII / FPI or Institutions increasing their shareholding. The Negative aspects of the company are high Valuation (P.E. = 73.5), PE higher than Industry PE and MFs decreased their shareholding last quarter.
Entry can be taken after closing above 86 Historical Resistance in the stock will be 89.3, 94.8 and 99.2. PEAK Historic Resistance in the stock will be 102 and 106. Stop loss in the stock should be maintained at Closing below 79.58 or 75.2 depending upon your risk taking ability.
Disclaimer: The above information is provided for educational purpose, analysis and paper trading only. Please don't treat this as a buy or sell recommendation for the stock or index. The Techno-Funda analysis is based on data that is more than 3 months old. Supports and Resistances are determined by historic past peaks and Valley in the chart. Many other indicators and patterns like EMA, RSI, MACD, Volumes, Fibonacci, parallel channel etc. use historic data which is 3 months or older cyclical points. There is no guarantee they will work in future as markets are highly volatile and swings in prices are also due to macro and micro factors based on actions taken by the company as well as region and global events. Equity investment is subject to risks. I or my clients or family members might have positions in the stocks that we mention in our educational posts. We will not be responsible for any Profit or loss that may occur due to any financial decision taken based on any data provided in this message. Do consult your investment advisor before taking any financial decisions. Stop losses should be an important part of any investment in equity.

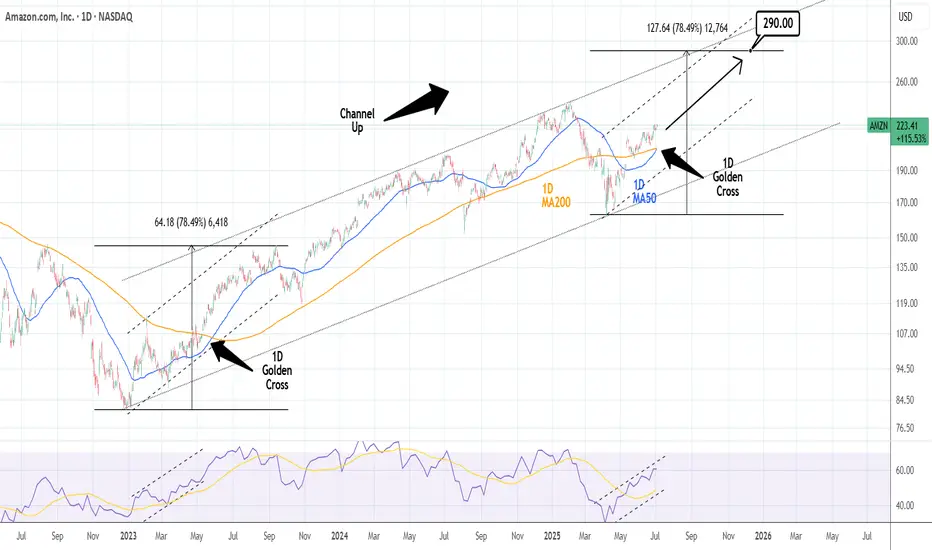
APPLE: 1st 1D Golden Cross in 2 years just formed.Apple is bullish on its 1D technical outlook (RSI = 67.490, MACD = 1.760, ADX = 17.850) and yesterday it started forming the first 1D Golden Cross in more than 2 years. This signals the extension of the 2nd major bullish wave of the 3 year Channel Up. The previous one made an incredible extensino to +78.49%. That gives us the target to work with for the rest of the year. The trade is long, TP = $290.
## If you like our free content follow our profile to get more daily ideas. ##
## Comments and likes are greatly appreciated. ##
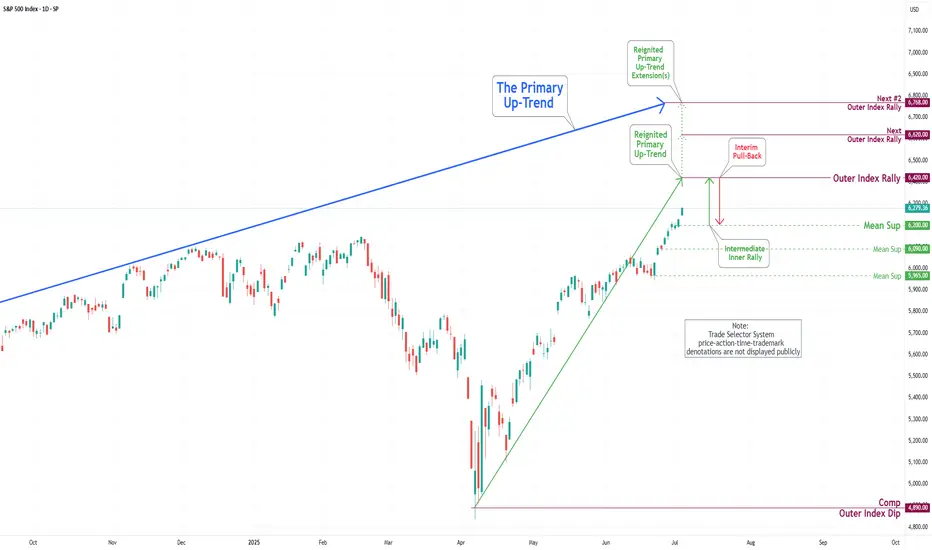
S&P 500 Daily Chart Analysis For Week of July 3, 2025Technical Analysis and Outlook:
During this abbreviated trading week, the S&P 500 Index has primarily shown an upward course, hitting and surpassing our target for the Outer Index Rally of 6235. Currently, the index demonstrates a consistent bullish trend, with the following objective for the Outer Index Rally set at 6420, followed by forthcoming targets of 6620 and 6768. Nevertheless, it is crucial to acknowledge the current price action may cause prices to retrace from their current fluctuation to test the Mean Support at 6200 before resuming their upward movement.
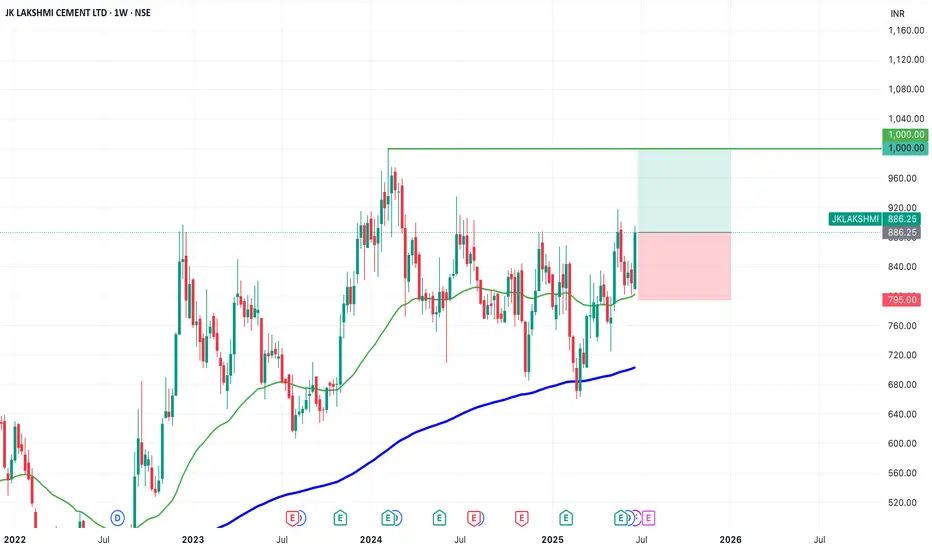
SWING IDEA - JK LAKSHMI CEMENT JK Lakshmi Cement , a key player in India’s cement sector under the JK Group showing strong technical confluence making this a swing-worthy setup.
Reasons are listed below :
Formation of a bullish engulfing candle on the weekly chart, indicating a potential trend reversal
Strong support from the 50-week EMA , reinforcing medium-term trend strength
Breakout from a consolidation range that lasted over a year, suggesting renewed momentum
Inverse Head & Shoulders breakout , a classic bullish pattern
Target - 1000
Stoploss - weekly close below 795
DISCLAIMER -
Decisions to buy, sell, hold or trade in securities, commodities and other investments involve risk and are best made based on the advice of qualified financial professionals. Any trading in securities or other investments involves a risk of substantial losses. The practice of "Day Trading" involves particularly high risks and can cause you to lose substantial sums of money. Before undertaking any trading program, you should consult a qualified financial professional. Please consider carefully whether such trading is suitable for you in light of your financial condition and ability to bear financial risks. Under no circumstances shall we be liable for any loss or damage you or anyone else incurs as a result of any trading or investment activity that you or anyone else engages in based on any information or material you receive through TradingView or our services.
@visionary.growth.insights
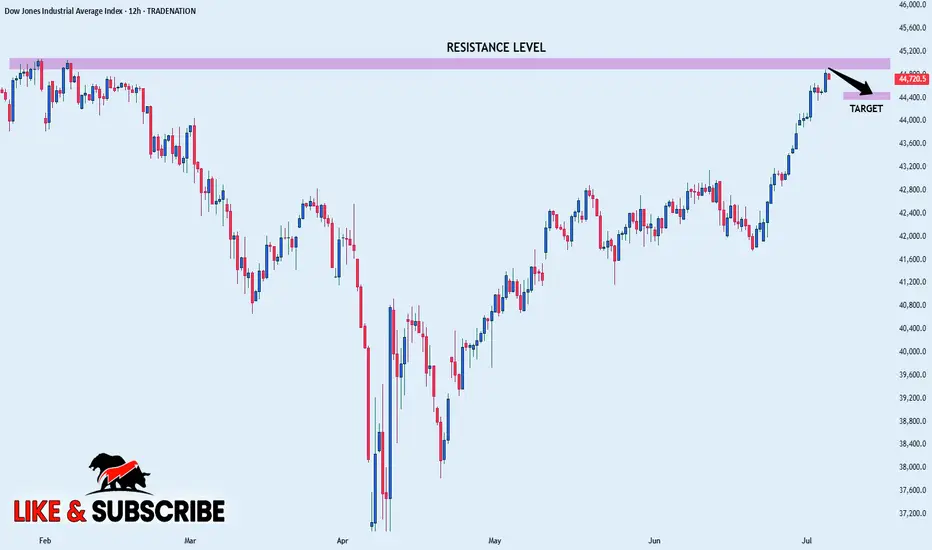
US30 SHORT FROM RESISTANCE|
✅DOW JONES is going up now
But a strong resistance level is ahead at 45,077
Thus I am expecting a pullback
And a move down towards the target of 44,500
SHORT🔥
✅Like and subscribe to never miss a new idea!✅
Disclosure: I am part of Trade Nation's Influencer program and receive a monthly fee for using their TradingView charts in my analysis.
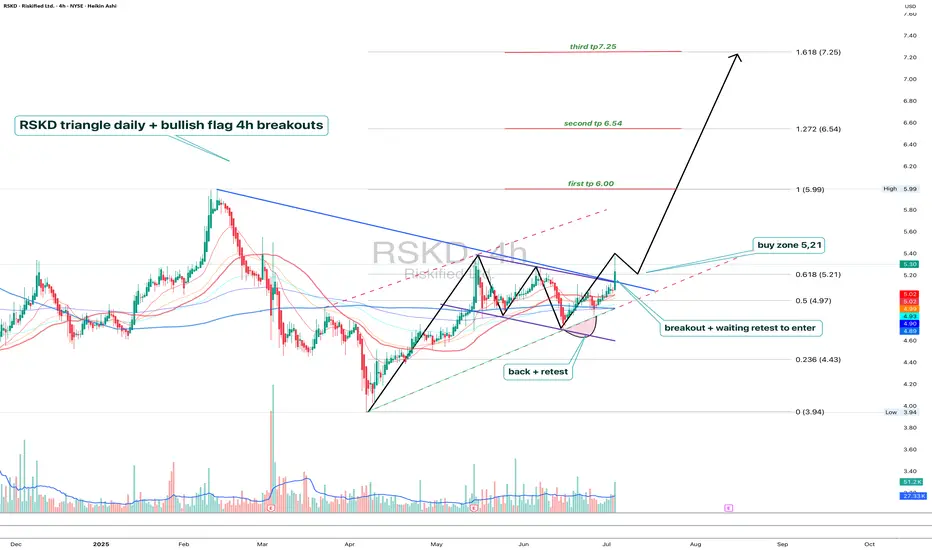
RSKD - breakout confirmed, now waiting for retestRiskified (RSKD) shows a textbook breakout setup: daily triangle plus 4H bullish flag. Price already broke out and is now retesting the 0.618 Fibonacci retracement at $5.21, which also matches the flag resistance flip and EMA cluster. This is a clean buy zone with strong technical alignment.
Volume spiked during the breakout, trend structure remains intact, and moving averages are converging — usually a precursor to strong moves. The current pullback is orderly, and if buyers show strength on this retest, the price could target $6.00, then $6.54, and potentially $7.25 (1.618 extension).
Fundamentally, Riskified offers fraud prevention tech for e-commerce. The business is benefiting from global growth in online transactions and improved margin control. While still unprofitable, recent quarters showed progress toward positive operating leverage and strong client acquisition.
Tactical plan:
— Entry on confirmation from $5.21 retest
— TP1: $6.00
— TP2: $6.54
— TP3: $7.25
— SL: below $4.90 or $4.43 support zone
You’ve been watching this one. The triangle broke. The pullback is clean. Maybe it’s time to stop watching and start participating.
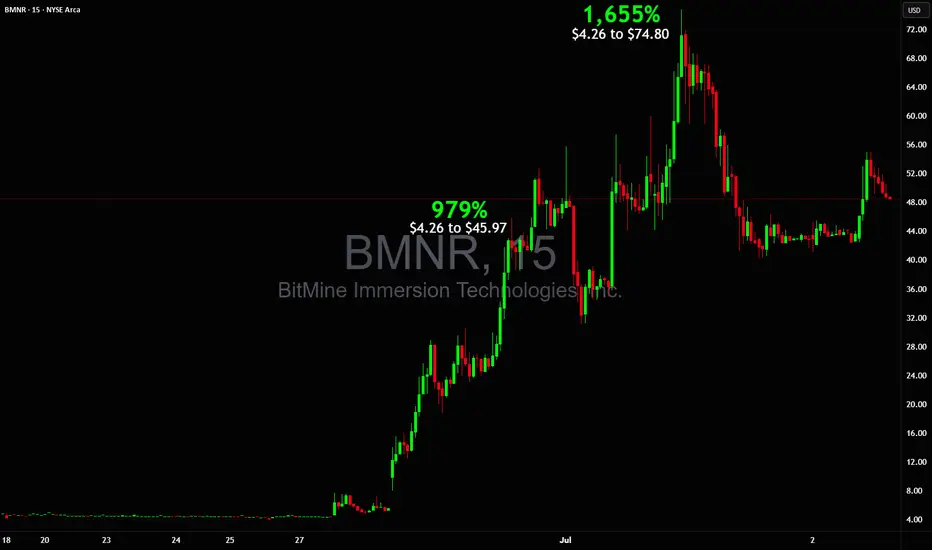
WOW $4 to $74 Big 1,655% in just 2 daysGet ready for new power runners to emerge from this AMEX:BMNR move
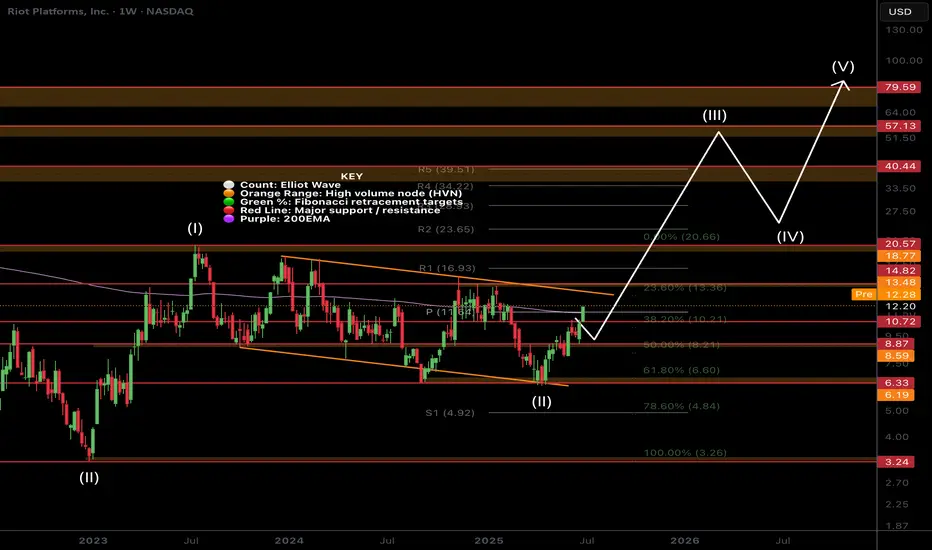
$RIOT Continues to Follow PathNASDAQ:RIOT Is sticking closely to the plan testing the bottom and top of the channel multiple times.
Price closing above the weekly 200EMA and weekly pivot Friday will be a very bullish signal. As we have over 4 tests of the upper boundary resistance there is a high probability we break through and continue higher in a high degree wave 3.
Initial targets are the weekly R5 pivot at $39 and all time high at range at $79.
Price tested the .618 Fibonnaci retracement in a complex correction for wave 2.
Analysis is invalidated below the channel support.
Safe trading
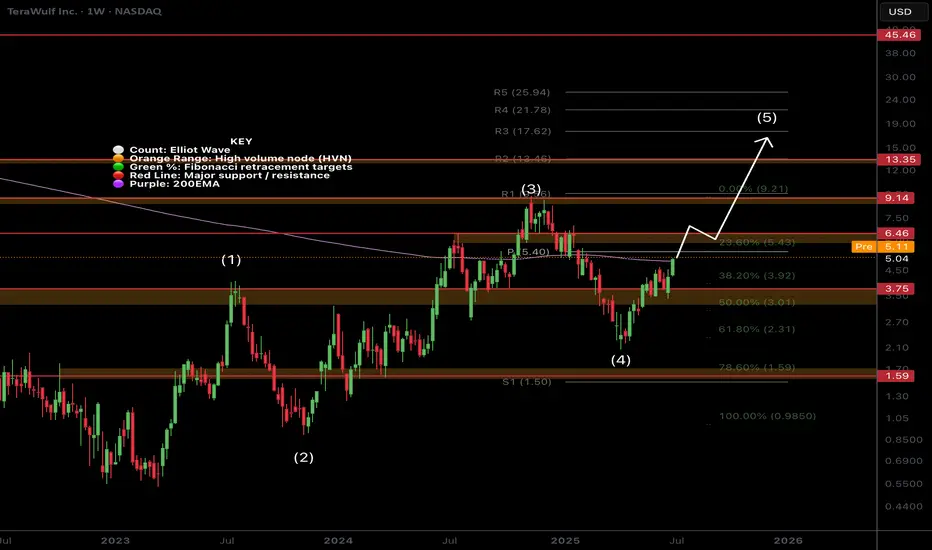
$WULF Critical Resistance!NASDAQ:WULF has had a great come back but has just hit a triple sword resistance: weekly 200EMA, weekly pivot and High Volume Node where I expect it to struggle for a while!
Are CRYPTOCAP:BTC miners the new altcoins?
Bullish continuation through these resistances will flip them to support and demonstrate fundamental resilience on an improving macro economic background overcoming technical analysis.
Long term tailwind potential can be as high a10x from here but more realistic targets are the R3 weekly pivot $17 and R5 weekly pivot at $25.
Analysis is invalidated below the high degree wave (4) of a leading (or ending) diagonal Elliot Wave pattern.
Safe trading
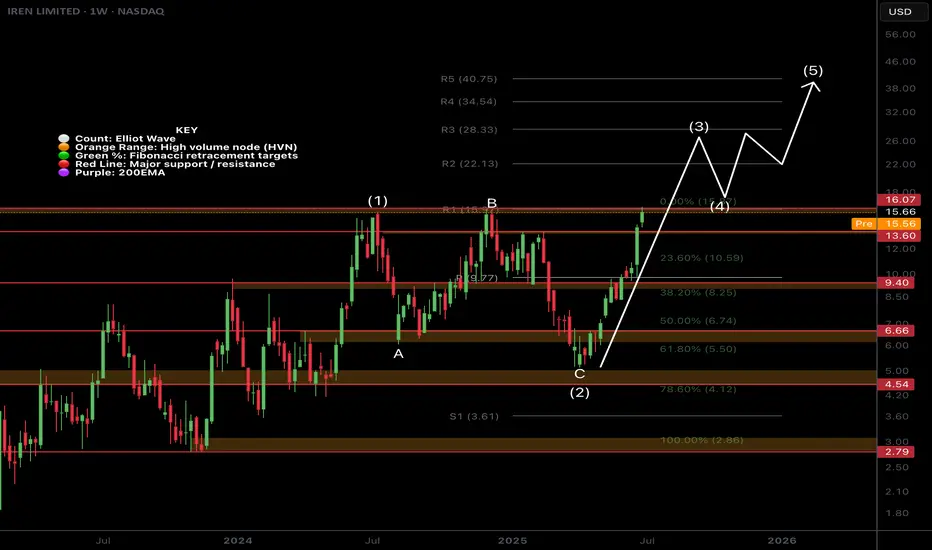
$IREN Killing It. More Upside?NASDAQ:IREN has poked above the true all time high range (Launch price dump excluded) in a high degree Elliot wave 3
Long term target remains the R5 weekly pivot at $40 but may over extend with a bullish Bitcoin and Macro economic tailwind, coupled with AI growth.
Many thought this was a greedy target at $5 but now that price is $16 it doesn't look so bad. You have to know when to let the runners run, that is were the big bucks are trading!
Any retracement of a decent degree should expect to find support at the weekly pivot $9.4 before continuing upwards and may present an excellent buying opportunity! I will be posting the signal levels on Substack.
As always ,all time high range will be the next support if price continues upwards from here.
Safe trading
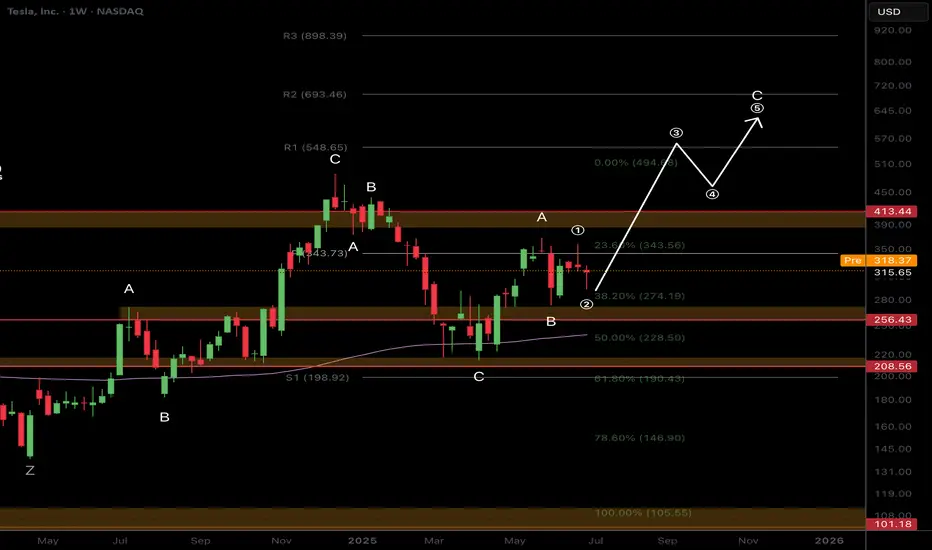
$TSLA Time to Fade or..?NASDAQ:TSLA (like NASDAQ:GOOG ) is standing out to me as bullish, yet, corrective Elliot Waves a higher degree series of ABCs appear to be underway.
A final wave C appears to be underway which would take price too all time highs in an expanded flat correction pattern. My count could be wrong and the interference could be from the increase it sentiment volatility connected to the US headlines lately and Trump posting on socials. Things may get back to normal after the summer and a clearer pattern may emerge.
Price is struggling to get past the weekly pivot point bullishly or the weekly 200EMS bearishly and is trapped within that range.
For now long term target is the R2 daily pivot at $693 as the higher probability is continued upside
Safe trading
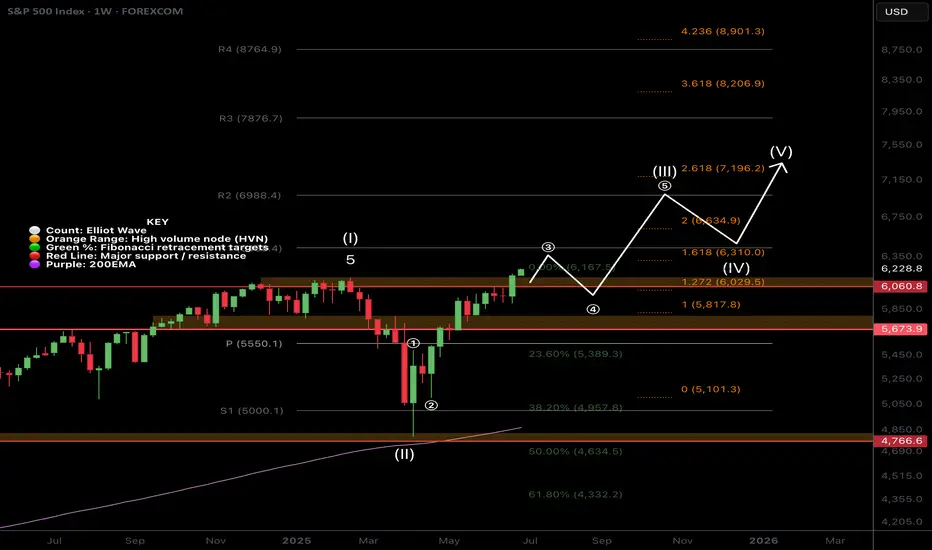
$SPX500 Most Hated Rally to Continue?FOREXCOM:SPX500 continues into price discovery suggesting a wave (3) is still underway but nearing a its minimum target of the 1.618 Fibonacci extension target $6310. Overextension of this target will demonstrate an even stronger bullish outlook.
Long term terminal targets remains above $7000 for me.
A short term pull back is a high probability but markets can stay irrational longer than participants can stay liquid.
Safe trading
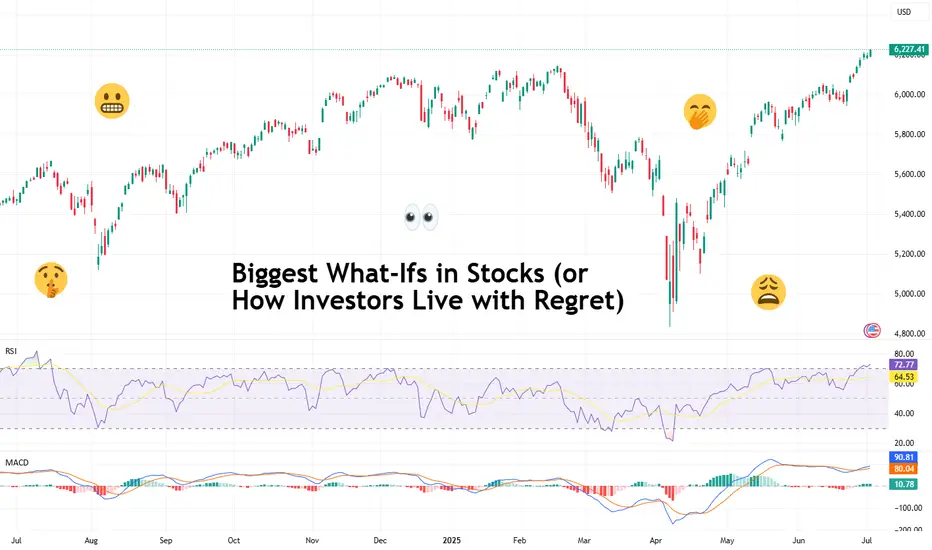
Biggest What-Ifs in Stocks (or How Investors Live with Regret)You think you’ve got regrets because you didn’t buy Nvidia NASDAQ:NVDA at $50 or sold Tesla NASDAQ:TSLA at $420? Join the club.
The stock market’s history is littered with “almost” trades, missed deals, and facepalm-worthy decisions that turned out to be trillion-dollar pivots.
This is the hall of fame for what didn’t happen — and what those stories teach us about how markets (and human nature) actually work. Call it a free masterclass in greed, fear, FOMO, and the priceless value of just sitting tight sometimes.
Take it easy today, grab your cold brew and read up on the biggest what-ifs in stock market history.
🍏 Ronald Wayne: The Patron Saint of “Oops”
Our first inductee needs no introduction. But let’s do it anyway. Ronald Wayne, the third Apple NASDAQ:AAPL co-founder, sold his 10% stake back in 1976 for the princely sum of $800. He wanted to avoid any debts if things went south. Sensible, right?
That $800 stake today would be worth more than $300 billion. That’s more than the GDP of Finland — and about 1.2 million new iPhones every single day for pretty much the rest of his life. Wayne has since said he doesn’t regret it. Which is probably the biggest lie he’s ever told.
🍿 Blockbuster’s Netflix “Pass”
In 2000, Netflix NASDAQ:NFLX was a DVD-by-mail startup with spotty profits. Reed Hastings, Netflix’s founder, knocked on Blockbuster’s door and offered to sell the whole thing for $50 million — about the price of a Hollywood production.
Blockbuster’s execs reportedly laughed him out of the room. “People will always want to drive to a store to rent a VHS,” they said, basically. Fast forward: Netflix is worth around $560 billion, and Blockbuster is down to one store that’s mostly a selfie museum for millennials who miss rewinding tapes.
💻 Microsoft’s Lifeline That Saved Apple
In 1997, Apple NASDAQ:AAPL was broke. Steve Jobs had returned but was days away from the company flat-lining for good. Enter Bill Gates.
Microsoft NASDAQ:MSFT wrote Apple a $150 million check, partly to keep antitrust regulators off its back. Jobs even appeared on stage with Gates beaming in on a giant screen like Big Brother — a moment that made every Apple fan cringe.
But that deal saved Apple’s hide. The iMac was born. The iPod followed. Then the iPhone. That $150 million is now a rounding error on Apple’s $3 trillion valuation. Sometimes your greatest rival is also your best frenemy.
🔍 Google: The $750K “Meh”
Before “Google it” became a verb, Larry Page and Sergey Brin tried to sell their little search engine to Excite — the Yahoo-lite portal that dominated the ‘90s web. The price? $750,000.
Excite’s CEO said search “wasn’t that important” — one of the worst calls in tech history. Today, Alphabet NASDAQ:GOOGL is worth over $2.1 trillion and always flashing bright on the Stock Heatmap , and Excite is a footnote in a forgotten Web 1.0 graveyard.
The lesson? Never dismiss a side project just because it doesn’t fit the spreadsheet.
💸 Masayoshi Son’s $200 Billion Slip
SoftBank’s Masayoshi Son is known for his giant, risky bets . And in 2017, he made a pretty good one: his Vision Fund scooped up a 5% chunk of Nvidia stock worth about $4 billion. He called GPUs the backbone of the AI revolution. He was right.
But by 2019, SoftBank was under pressure to tidy up its books. So Son sold the whole position for a tidy short-term profit. That stake today would be worth nearly $200 billion, given Nvidia’s rocket-fuel AI rally .
“We can cry together,” CEO Jensen Huang told Masa Son at an AI Summit in Tokyo last year. Early doesn’t always mean patient. And being “kind of right” can be the most painful lesson of all.
📊 Berkshire Hathaway: A Textile Mill’s Rebirth
Think of Berkshire Hathaway NYSE:BRK.A now — a $1 trillion behemoth. Insurance, utilities, railroads, huge piles of Apple shares . But back when Warren Buffett bought it, Berkshire was a dying textile business in New England.
Buffett only bought control because he was annoyed at the CEO’s lowball tender offer. It turned into his permanent holding company. The textile side eventually went extinct — but the insurance side became the cash-printing machine Buffett used to buy everything else.
Sometimes your best trade starts with pure pettiness.
🚀 Tesla: The Short Sellers’ Pain Cave
Here’s a more recent tale. Tesla was not long ago the most shorted stock on Earth. Everyone from hedge funds to your uncle at Thanksgiving was betting on Elon’s dream to fail.
Every now and then, the short-sellers get slapped with billions of dollars in losses, because the stock shoots up out of nowhere. The most recent example? November 12, when those naysayers nursed $7 billion in wiped out cash . Bears have been torched so many times, they might as well switch sides and sell Tesla hoodies instead.
🌌 Yahoo’s Double Miss: Google and Facebook
If you think blowing one chance is bad, try blowing two. Yahoo turned down the chance to buy Google for less than a million bucks. Then years later, they offered $1 billion for Facebook (now META NASDAQ:META ) — but bungled the negotiations and tried to lower the price. Zuck said “nope.”
But back to Google, because the story didn’t end there. In 2002, Yahoo said it wanted to buy Google for $3 billion. Brin and Page said $5 billion and Yahoo said no. Then Microsoft was ready to pay $40 billion to acquire Yahoo in 2008. But Yahoo said no.
Today, Google, Microsoft, and Meta are trillion-dollar titans. Yahoo? Sold itself for $4.5 billion, mostly for its patents, in 2016 to Verizon. Talk about slipping on the same banana peel more than once.
🧃 Apple: The Splits that Keep Giving
Want a reason to love boring old “buy and hold”? Apple NASDAQ:AAPL has split its stock five times since its 1980 IPO. If you’d bought 100 shares back then, you’d now have over 56,000 shares, plus mountains of dividends.
Next time you want to swing trade every squiggle, remember: sometimes the slowest route is the sweetest.
📝 Regret: The Only Universal Asset Class
Every trader has a “coulda, shoulda, woulda.” It’s the cost of doing business in a market that only makes sense in hindsight. Even the pros — billionaires, boards, hedge funds — have stories that make yours look tame.
Ronald Wayne reminds you that selling too soon can cost you your own island. Masayoshi Son proves being right but impatient is still being wrong. Yahoo shows that “almost” is worth exactly zero on a balance sheet.
What these stories prove is that the market’s biggest edge isn’t necessarily timing, genius, or inside scoops — it’s discipline, resilience, and sometimes a stubborn refusal to touch the sell button.
🤗 Bonus Story: Ballmer Regrets Nothing
But not every story has to be a regret story. Just look at Steve Ballmer, Microsoft ‘s former CEO. Since the early 2000s, he’s been holding his 4% stake in the software maker and that’s now worth more than $130 billion. No regrets found.
👉 What’s Your “One That Got Away”?
Now your turn : What’s your personal what-if story? Which ticker haunts you in your sleep? Drop your best missed trade or worst sell in the comments — we promise to laugh with you, not at you. Probably. Stay sharp. Stay patient!
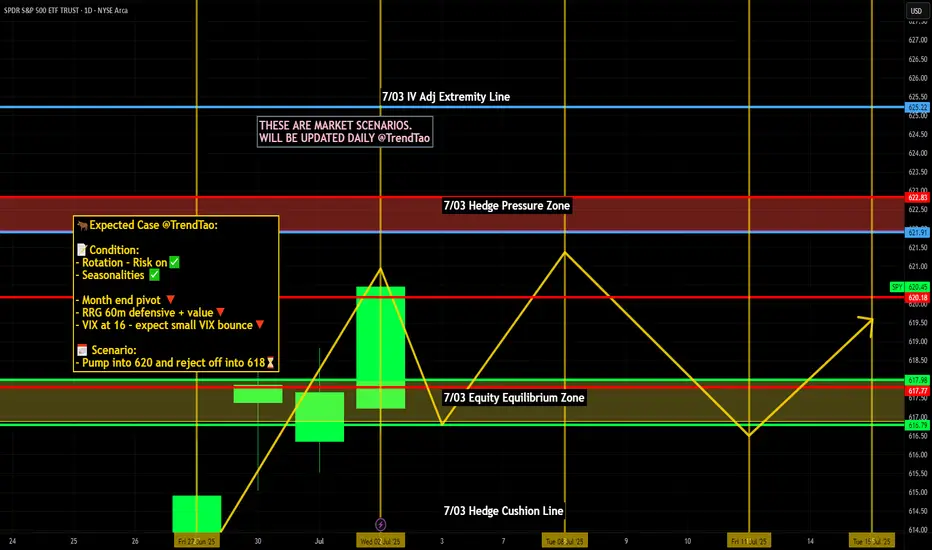
Nightly $SPY / $SPX Scenarios for July 3, 2025🔮 Nightly AMEX:SPY / SP:SPX Scenarios for July 3, 2025 🔮
🌍 Market-Moving News 🌍
📉 U.S. Private Payrolls Surround Weakness
The ADP report showed a drop of 33,000 private-sector jobs in June, the first decline in over two years, reflecting businesses holding back hiring amid trade uncertainty. However, layoffs remain low, signaling no acute stress yet
📊 Markets Braced for NFP Caution
Markets are wary ahead of this morning’s Non‑Farm Payroll (NFP) release—currently projected at +115,000 jobs and 4.3% unemployment—based on indications of labor-market cooling from weak ADP numbers
💵 Canadian Dollar Strengthens
The loonie jumped 0.4% as investors adjust expectations for broader central-bank dovishness, driven by the weak U.S. jobs signals and optimism over a revived U.S.–Canada trade dialogue
📊 Key Data Releases 📊
📅 Thursday, July 3:
8:30 AM ET – Non‑Farm Payrolls (June):
Forecast: +115,000; Previous: +139,000 (May). Watching for signs of sustained job-growth slowdown.
8:30 AM ET – Unemployment Rate:
Forecast: 4.3%, up from 4.2% in May. A rise may increase odds of rate cuts.
8:30 AM ET – Average Hourly Earnings (MoM):
Forecast: +0.3%; prior: +0.4%. Cooling wages would ease inflation pressures.
8:30 AM ET – Initial & Continuing Jobless Claims:
Track week-to-week stability or worsening of labor-market conditions.
9:45 AM ET – Services PMI (June, flash):
Monitor for signs of slowing in U.S. service-sector activity.
10:00 AM ET – ISM Non-Manufacturing PMI (June, flash):
Forecast: 50.8. A reading below 50 suggests contraction in services.
⚠️ Disclaimer:
For informational and educational purposes only. It does not constitute financial advice. Consult a licensed financial advisor before making investment decisions.
📌 #trading #stockmarket #economy #jobs #Fed #labor #technicalanalysis