ABCL: When biotechnology not only curesABCL: When biotechnology not only cures, but also makes your wallet happy!
Hello, fellow investors and those who just like to tickle your nerves on the stock exchange!
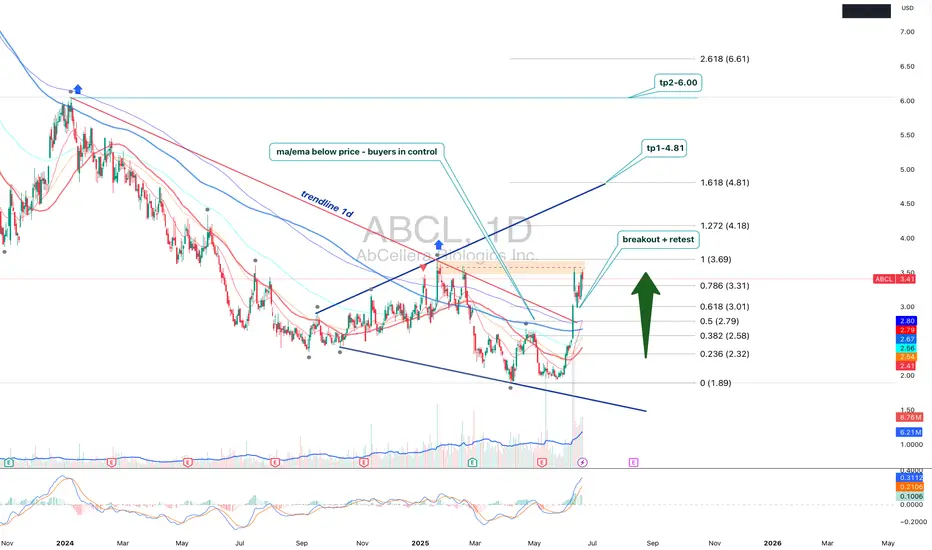
Today we have on our agenda (and on the chart) - the stock AbCellera Biologics Inc. (ABCL), which seems to have decided to prove that even at the bottom there is life, and then even throw a party with a breakthrough!
As you can see, our hero ABCL has been playing ‘hide and seek with the trend line’ for a long time, showing an enviable resilience in the fall, just like your sofa after a day at work. However, if you look closely, the ‘ma/ema below price’ signalled that buyers, like secret agents, had already taken control of the situation, preparing for the decisive throw.
And here it is, it's happening! The recent ‘breakout + retest’ is not just a technical term, but a real escape from the ‘bearish’ prison with a subsequent test of strength. Not only did price break through resistance, but it came back to see if it was indeed broken. It's like going out of the house, forgetting your keys, coming back in, getting them, and then going out again - only in the stock market it's a sign of strength and determination!
Now that the dust has settled and the ‘1d’ trendline is behind us, our sights are set on the upside. Targets? Of course! ‘tp1-4.81’ and ‘tp2-6.00’ are not just numbers, they are potential points where we can pat ourselves on the shoulder and say, ‘I told you so!’. А ‘2,618 (6,61)’ - is for the very brave and patient who are willing to wait for the true bull dance.
All in all, ABCL seems to have turned a page in its history, swapping sad ballads for upbeat dance hits. But remember, friends: the market is a capricious thing, and even the most beautiful charts can bring surprises. So, act wisely, don't forget about risks and, of course, enjoy the process! Have a good trading!
Stocks!
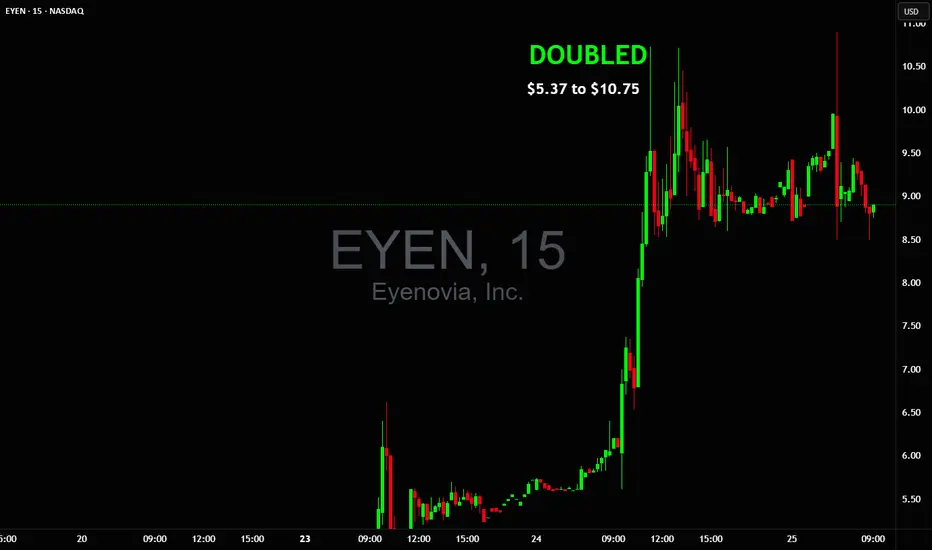
Ready for a new day, please bring another doubler like $EYENReady for a new day, please bring another doubler like NASDAQ:EYEN $5 to $10 or NYSE:SRFM yesterday which were the only 2 trades made and 2 nice wins🙏🏻
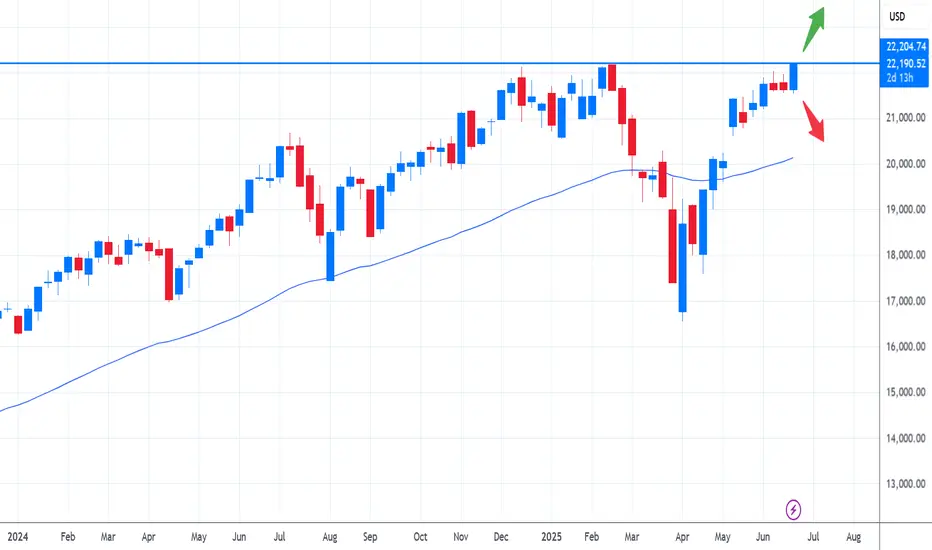
Nasdaq 100 Near Breakout – Eyes on 22,200 ResistanceThe Nasdaq 100 is approaching a critical technical level at 22,200. This resistance marks the upper boundary of recent consolidation and aligns with prior rejection zones. A clean break above this threshold could trigger a sharp upside move, possibly propelling the index into uncharted territory.
Geopolitical tensions have eased, and the dollar’s renewed weakness is supporting risk appetite, particularly in the tech-heavy Nasdaq. Strong earnings from key sectors are reinforcing bullish sentiment, with investors increasingly pricing in a favorable macro backdrop.
Technically, momentum is building. Price action has formed a series of higher lows, and buying pressure is intensifying near resistance. A breakout above 22,200 could ignite a strong rally, driven by stop orders and fresh bullish entries.
That said, traders should remain cautious. While the breakout setup is promising, a retracement toward support zones—such as 21,500 or the 20-day moving average—remains possible, especially if upcoming inflation or macro data disappoints.
For now, the 22,200 level remains the key to watch. A daily close above this level would shift the bias clearly higher, confirming breakout strength and potentially accelerating gains toward 22,800 or beyond.
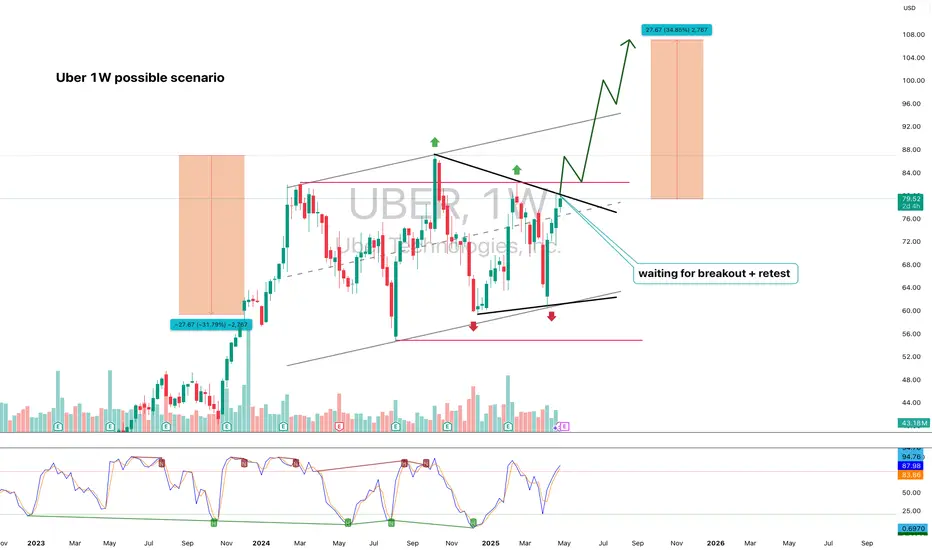
Uber (UBER, 1W) Tightening Structure Ready for BreakoutOn the weekly chart, UBER has formed a strong ascending wedge / tightening channel, showing clear higher lows and repeated rejections near upper resistance. The price is now approaching the apex of the pattern, with a possible breakout setup above $82.42.
If confirmed, the projected measured move (H = $27.67) aligns with Fibonacci extension targets at:
– $89.86 (1.272)
– $93.74 (1.414)
– $99.32 (1.618)
Technical structure:
– Price held support twice, confirming bullish intent
– Structure tightening — breakout likely on sustained volume
– Bullish divergence forming on the weekly stochastic oscillator
– A breakout above $82.42 activates the next impulse wave
– Volume is stable, with no signs of heavy distribution
Fundamentals:
Uber has reached a major financial milestone: consistent profitability and positive EBITDA growth. The company continues to expand across mobility and delivery, with a focus on cost efficiency, platform monetization, and retention. Increased user activity and growing institutional interest support a bullish mid-term thesis. Uber is increasingly seen as a core holding in next-gen tech and services portfolios.
The technical structure is approaching resolution. A confirmed breakout above $82.42 opens the door for a move to $89.86 → $93.74 → $99.32. With bullish structure and improving fundamentals, Uber is positioned for the next leg higher. This is a setup worth watching.
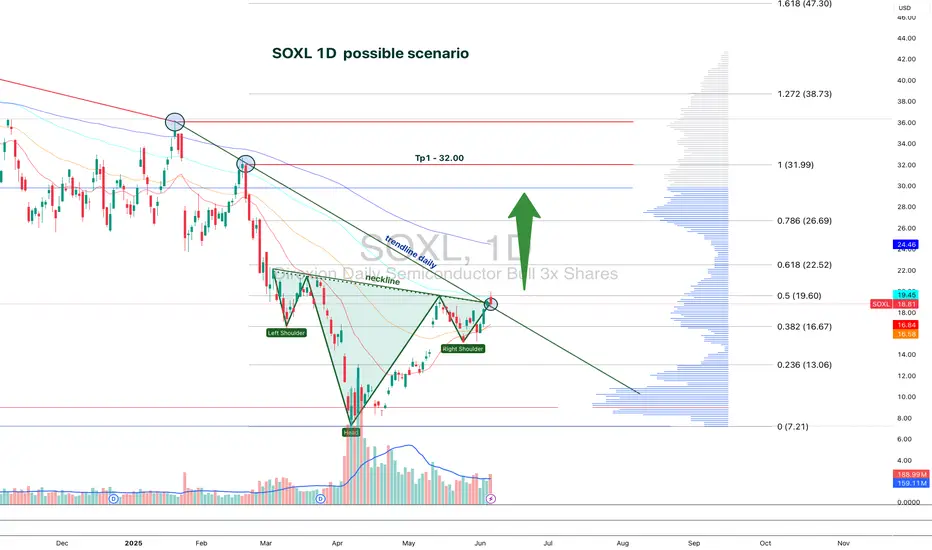
SOXL 1D — With a base like this, the ride’s worth itOn the daily chart of SOXL, since early March, a textbook inverse head and shoulders pattern has formed and is now in its activation phase. The left shoulder sits at $16.67, the head at $7.21, and the right shoulder at $15.11. The symmetry is classic, with volume stabilization and a narrowing range — all the elements are in place.
The key moment was the breakout through the descending daily trendline around $19.00. Price didn’t just pierce the level — it held above it, signaling a phase shift. There was an attempt to break through the 0.5 Fibonacci level at $19.60, which led to a pullback — not on heavy selling, but on decreasing volume. This wasn’t a rejection, it was a pause.
This pullback serves as a retest of the breakout zone and the 20-day moving average. The overall structure remains bullish: price stays above all key EMAs and MAs, RSI climbs past 60, and the candlestick structure is stable. Volume rises during up moves and fades during pullbacks — classic signs of reaccumulation.
The measured target from the pattern is $32.00, calculated from the head-to-neckline height projected from the breakout point. As long as price holds above $18.40, the setup remains intact. A break above $19.60 with confirmation would open the door to acceleration.
This isn’t a momentum play — it’s a setup months in the making. The structure is there, the confirmation is there, and most importantly — the price behavior makes sense. With a base like this, the ride ahead looks worth taking.
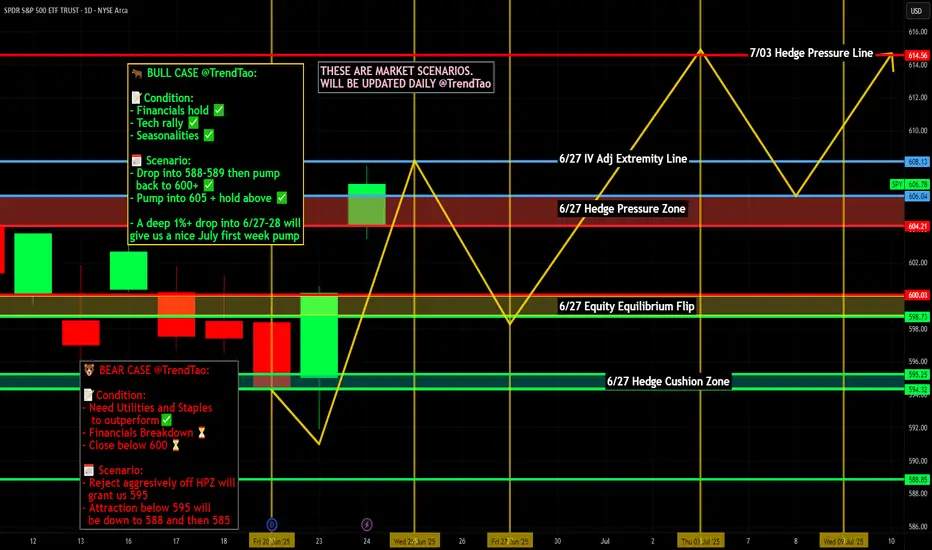
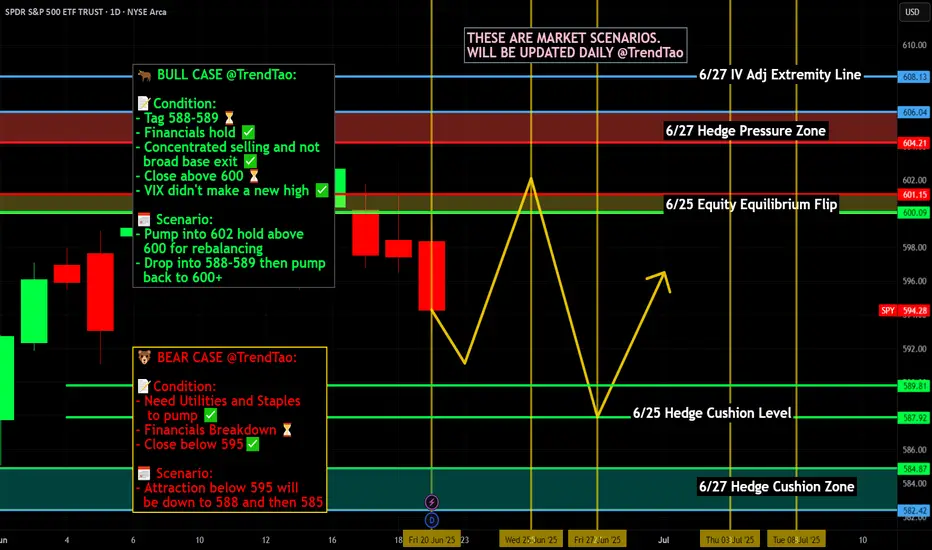
Nightly $SPY / $SPX Scenarios for June 25, 2025🔮 Nightly AMEX:SPY / SP:SPX Scenarios for June 25, 2025 🔮
🌍 Market-Moving News 🌍
💱 Dollar Slides on Middle East Ceasefire Optimism
A fragile ceasefire between Israel and Iran lifted risk sentiment across global markets. The U.S. dollar weakened, while the euro and British pound hovered near multi‑year highs
📈 Equities Near Record Highs
The S&P 500 and Nasdaq pushed toward all-time highs on June 25, supported by the Middle East truce and retreating energy prices. The S&P 500 rallied ~1.1%, with tech and discretionary sectors leading the charge
🛢 Oil & Treasuries Dip, Yield Cuts Anticipated
Oil plunged ~6% to ~$65/bbl as conflict fears eased. Softer prices plus weak consumer confidence spurred expectations of up to 60 bps in Fed rate cuts by December; Treasury yields pulled back accordingly
📉 Consumer Confidence Falls Again
The Conference Board’s index dropped to 93—the lowest level since May 2020—as concerns over tariffs and job availability weighed on households
📊 Key Data Releases 📊
📅 Wednesday, June 25:
(No major U.S. economic data scheduled)
Markets remain focused on geopolitical dynamics, Fed commentary, and next week’s PCE inflation release.
⚠️ Disclaimer:
This information is for educational and informational purposes only and should not be construed as financial advice. Always consult a licensed financial advisor before making investment decisions.
📌 #trading #stockmarket #economy #geopolitics #Fed #inflation #technicalanalysis
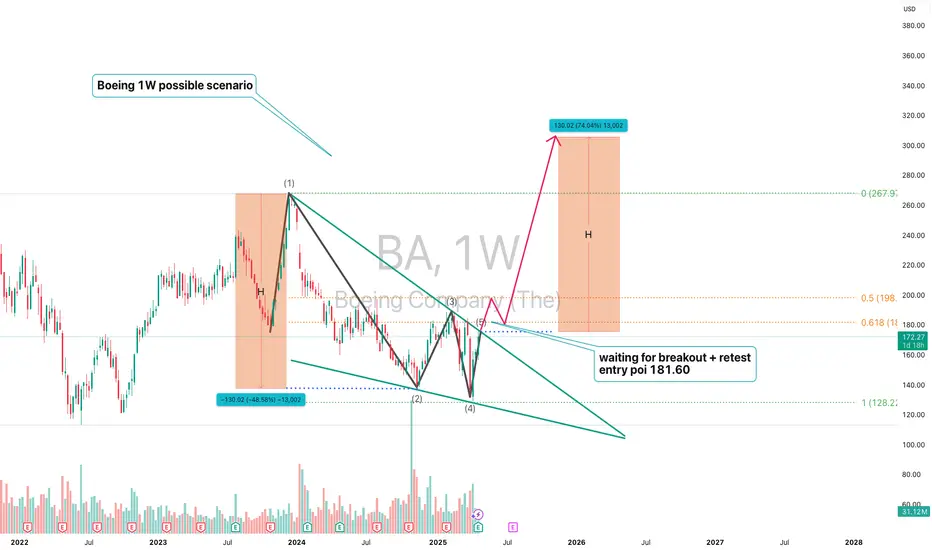
Boeing (BA, 1W) Falling Wedge + H-Projection TargetOn the weekly chart, Boeing has formed a classic falling wedge — a bullish reversal pattern that typically signals the end of a correction phase. After a sharp decline from $267.97 to $138, price action began to compress within a wedge, forming lower highs and higher lows on declining volume — a textbook setup for a breakout.
The structure remains active: a confirmed breakout above the upper wedge boundary, with a retest near $181.60 (0.618 Fibonacci retracement), would validate the pattern and trigger the next upward phase.
The projected move (H) equals the height of the previous impulse — $130.02. Adding this to the base of the wedge (~$138) yields a technical target of $268.00, aligning with the previous high and completing the structural recovery.
Technical summary:
– Multiple confirmations of wedge support
– Volume declining into the apex (bullish)
– Entry zone: breakout + retest at $181.60
– Mid-level resistance: $198.09 (0.5 Fibo)
– Final target: $267.97–$268.00 (H-projection complete)
Fundamentals:
Despite operational setbacks, Boeing remains structurally positioned for recovery as demand for commercial aircraft rebounds. Additional support could come from improving supply chains, increased defense contracts, and a more dovish outlook from the Federal Reserve heading into 2025.
A breakout above $181.60 and sustained momentum would confirm the falling wedge pattern and activate the H-measured move toward $268. This is a structurally and fundamentally supported mid-term recovery setup
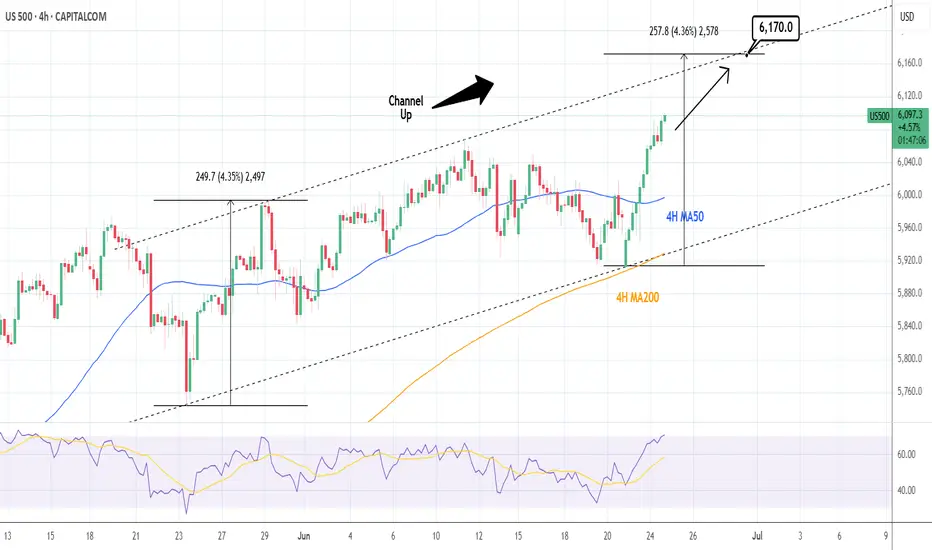
S&P500: Channel Up targeting 6,170.S&P500 is bullish on its 1D technical outlook (RSI = 65.737, MACD = 75.400, ADX = 16.727), unfolding the new bullish wave of the 1 month Channel Up, after a bottom near the 4H MA200. The first bullish wave one reached +4.35%, we expect to repeat that so for a few more candles we will remain bullish, TP = 6,170.
## If you like our free content follow our profile to get more daily ideas. ##
## Comments and likes are greatly appreciated. ##
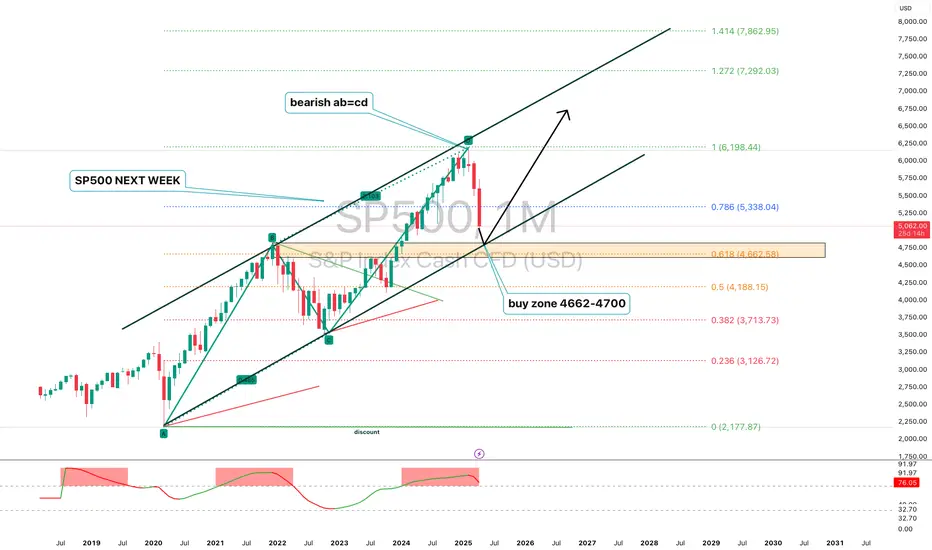
S&P 500 (SPX) 1M next week?The S&P 500 is pulling back from a key resistance after completing a bearish AB=CD pattern on the monthly chart. Price action suggests a potential correction toward the 4662–4700 zone, aligning with the 0.618 Fibonacci retracement level, which may serve as a key area for bullish reaccumulation. Momentum indicators show bearish divergence, hinting at a cooling rally.
Fundamentally, the index remains supported by strong earnings in tech and AI sectors, but risks persist from elevated interest rates, sticky inflation, and potential Fed policy shifts. A pullback into the 4662–4700 zone may offer a medium-term setup for continuation toward 5198 and potentially 5338. A breakdown below 4662 would invalidate the bullish structure and shift focus to lower Fibonacci levels.
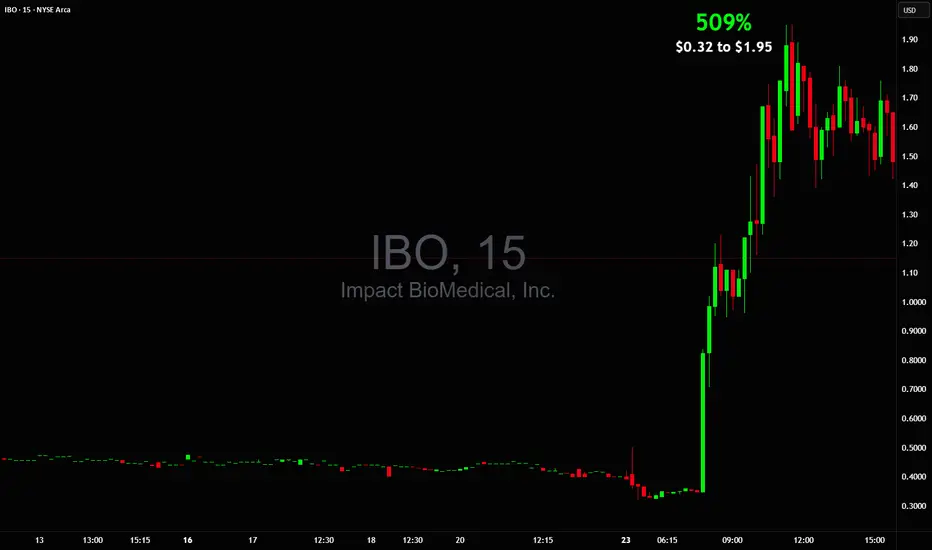
500% in a day banger from $0.32 to $1.95 $IBO500% in a day banger 🚀Please bring another stock like this today $0.32 to $1.95 AMEX:IBO
In and out at safest levels, no holding and hoping, then we move on to the next stock and keep repeating until too much money is made 🤑
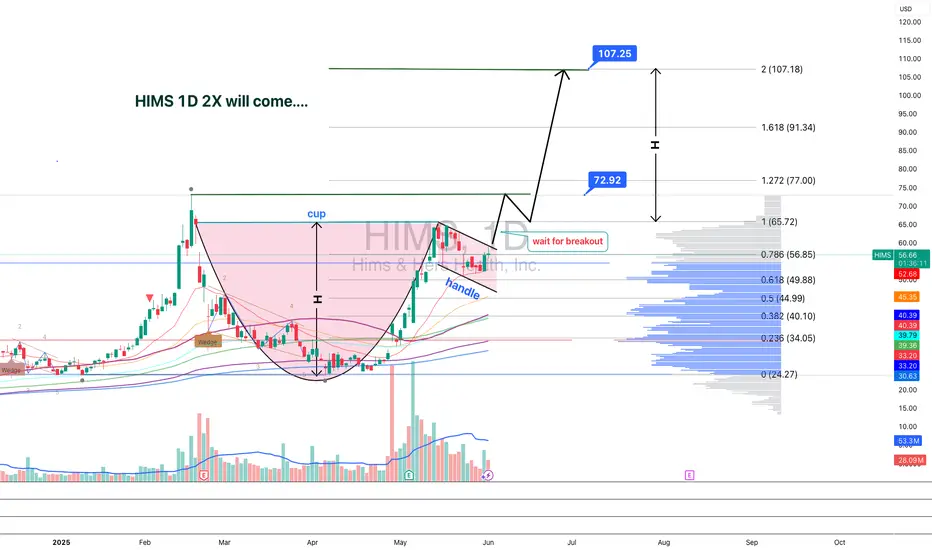
HIMS 1D — This pattern didn’t cook for nothingOn the daily chart of Hims & Hers Health, we’re looking at a textbook cup with handle formation — not just a pattern, but a structure backed by time, volume, and classic price behavior. The base of the cup formed steadily from February to May 2025, and as soon as the curve was complete, price transitioned into a tight consolidation — the "handle" that often masks real accumulation.
Right now, price is testing the resistance area. And it’s not just floating up there — it’s coming in hot: price has already broken through EMA 20/50/100/200 and SMA 50/200. That’s a full stack flip. This isn’t sideways noise — it’s a structural shift in control.
Volume is starting to build as price rises, confirming that demand is real and institutional positioning likely active. We’re watching a breakout zone above the handle — and when that breaks, the structure unlocks with a clear target: $107.25, roughly a 2x move from current levels.
This setup isn’t noise. It’s a long-cooked formation that’s now about to boil over. If the handle holds and price breaks through — the rest is just follow-through.
Nightly $SPY / $SPX Scenarios for June 24, 2025🔮 Nightly AMEX:SPY / SP:SPX Scenarios for June 24, 2025 🔮
🌍 Market-Moving News 🌍
🇺🇸 Markets Eye Powell Testimony & Consumer Confidence
Today brings a double dose of market-moving data: the June Consumer Confidence Index and Fed Chair Jerome Powell’s testimony before Congress. These will be key indicators of household sentiment and potential shifts in Fed rate guidance
🛢️ Oil Volatility Persists on Middle East Strain
Oil prices briefly spiked after U.S. strikes on Iran’s nuclear facilities, prompting fears of supply disruptions. However, prices have since dipped as ceasefire hopes emerge. Investors remain cautious on energy headwinds
💱 Dollar Retraces on Safe-Haven Rotation
The dollar softened after peaking as geopolitical tensions eased slightly. Still, it remains sensitive to Powell’s tone and confidence data, which could reintroduce volatility
📊 Key Data Releases & Events 📊
📅 Tuesday, June 24:
10:00 AM ET – Conference Board Consumer Confidence (June)
Monitors household optimism; a rebound could support consumer spending and equities.
10:00 AM ET – Fed Chair Powell Testimony Begins
Powell appears before the House Financial Services Committee. Market focus: inflation outlook, tariffs, and potential timing for rate cuts.
⚠️ Disclaimer:
This information is for educational and informational purposes only and should not be construed as financial advice. Always consult a licensed financial advisor before making investment decisions.
📌 #trading #stockmarket #economy #Fed #trade #energy #technicalanalysis
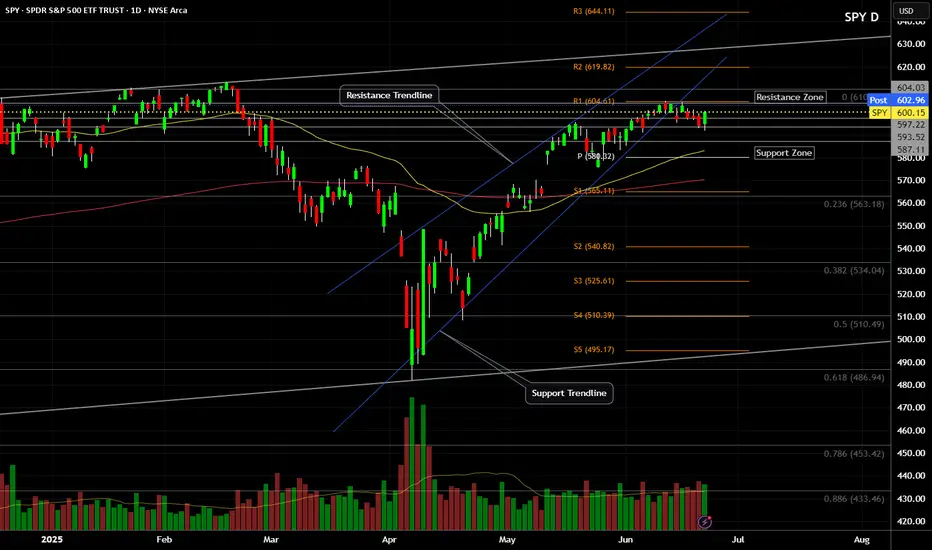
SPY (S&P500 ETF) - Price Bouncing Up from Support after NewsSPY (S&P500 ETF) price has bounced up from the $593 support level after recent global news (de-escalation news).
Price action has slowed and consolidated in June 2025, and the S&P500 is still maintaining a price uptrend.
The 50EMA and 20EMA Golden Cross is still active and in progress (since May 2025).
The next stock market earnings season is not for another 3 months. Inflation, interest rate news, global events, government news, corporate news will continue to affect price volatility this summer.
Resistance Levels: $604, $610, $612, $619.
Support Levels: $600, $593, $586, $579.
Futures Watchlist for week ending 6/27/2025Come join as i go through the future tickers that im watching this week and where i see them going. With war talks filling up on social media this will add to our volatility and we will look at key levels to capitalize off of it! Let me know your thoughts on these tickers. Also let me know if there is another symbol futures or stocks that you want me to breakdown for you!

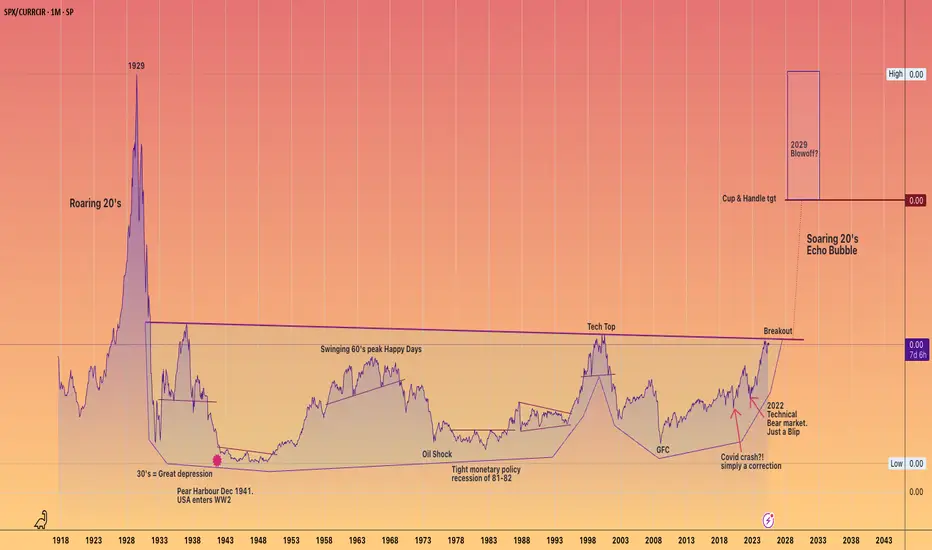
SOARING 20's are you ready for the Blowoff of the century#SPX v Currency in circulation
#Cup&Handle
1929 Echo bubble
AI will increase earnings and GDP
as ASI enters the workplace and Robotics grow us out of Debt
GDP = Number of people * Productivity
Now add an autonomous workforce to this.
TRUK - VCP (118W 66/27 3T)IDX:TRUK - VCP
(+):
1. Low risk entry point on pivot level
2. Volume dries up
3. Price above MA 50 > 150 > 200 over 10 weeks
4. Price is within 25% of 52 weeks high
6. Price is over 30% of 52 weeks low
7. 200 day MA trending up over 1 month
8. RS Rating is over 70 (84)
9. Breakout with huge volume
(-)
1. There is nothing good with the fundamental

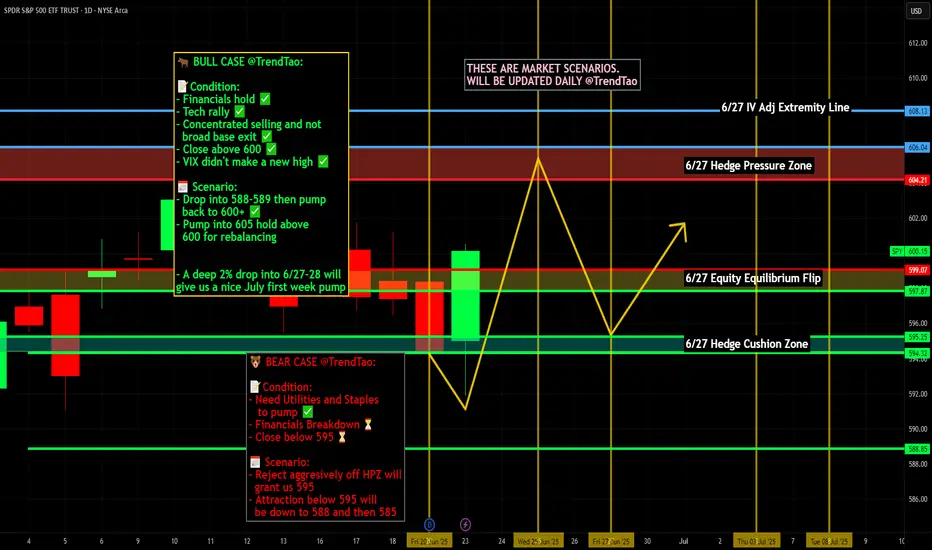
Weekly $SPY / $SPX Scenarios for June 23–27, 2025🔮 Weekly AMEX:SPY / SP:SPX Scenarios for June 23–27, 2025 🔮
🌍 Market-Moving News 🌍
🌐 Geopolitics Add to Risk Aversion
The S&P 500 is up about 0.9% so far in June, but analysts warn it’s facing a “precarious” phase amid renewed Middle East conflict and looming U.S. tariff deadlines in July–August. Elevated oil prices could fuel inflation, while fiscal and debt ceiling pressures weigh on sentiment
🎙️ Powell Heads to Capitol Hill
Fed Chair Powell will testify before Congress this week. His remarks on inflation and rate outlook—particularly regarding the Fed’s recent dot-plot revisions and monetary policy uncertainty—will be central to market direction
📈 Nike, FedEx & Micron Earnings Under Focus
Key corporate earnings (Nike, FedEx, Micron) could provide fresh insight into how tariffs and supply-chain disruptions are impacting major U.S. businesses
🛢️ Oil Prices Elevated
Oil remains range-bound at multi-week highs near $75–80/bbl following U.S.–Israel military action in Iran, which briefly spiked prices ~7–11%. Continued dependence on Middle Eastern supply may keep energy complex volatile
⚖️ NATO Summit Tightens Security Focus
NATO leaders meet in The Hague, marking an elevated global defense posture amid geopolitical uncertainty. Defense and aerospace stocks may remain pressured or volatile depending on summit outcomes
📊 Key Data Releases & Events 📊
📅 Monday, June 23
9:45 AM ET: S&P Global Flash U.S. Services & Manufacturing PMI (June)
10:00 AM ET: Existing Home Sales (May)
📅 Tuesday, June 24
10:00 AM ET: Consumer Confidence Index (June)
Testimony: Fed Chair Jerome Powell appears before Congress
📅 Wednesday, June 25
10:00 AM ET: New Home Sales (May)
📅 Thursday, June 26
8:30 AM ET: Advance Q1 GDP (Final Estimate)
📅 Friday, June 27
8:30 AM ET: Core PCE Price Index (May) — Fed’s preferred inflation gauge
⚠️ Disclaimer:
This is for educational and informational purposes only. It does not constitute financial advice. Always consult a licensed financial advisor before investing.
📌 #trading #stockmarket #economy #geopolitics #Fed #oil #charting #technicalanalysis
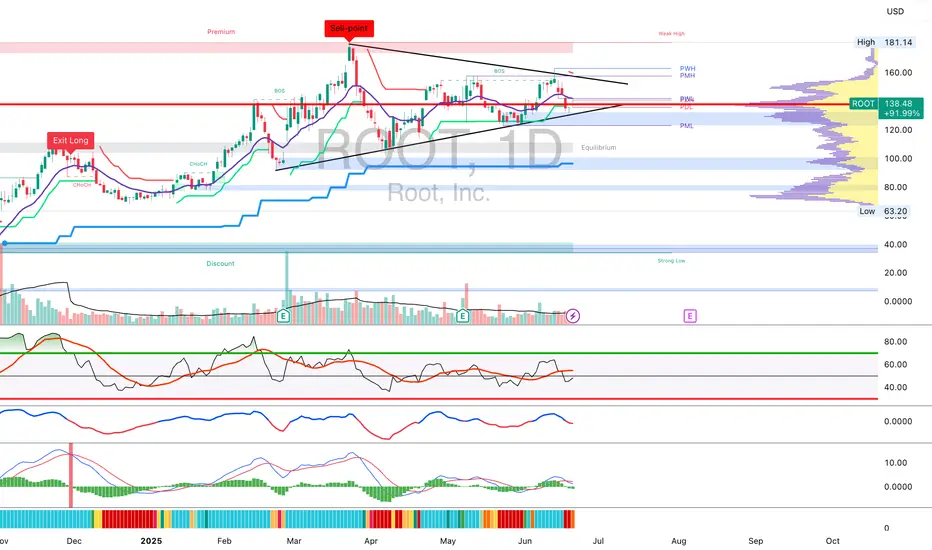
$ROOT IS IN A LONG TERM WEDGE WHICH SHOULD BREAK OUT SOONNASDAQ:ROOT that is in that bullish wedge is constricting and consolidating, it's like a rocket ship getting ready to launch NASDAQ:ROOT to $200 and higher like $230 or so.
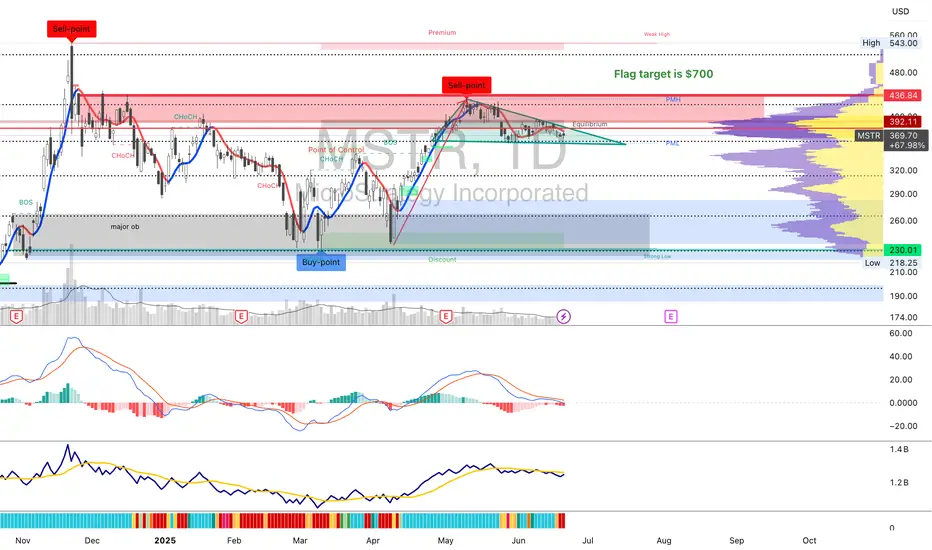
Bullish flag on $mstr, consolidating under supply tooNASDAQ:MSTR is in a flagpole position, a bullish one. The measured move target would be $700
Do you agree that MSTR is in a bullish stance?
I guess this really come down to how bitcoin does.
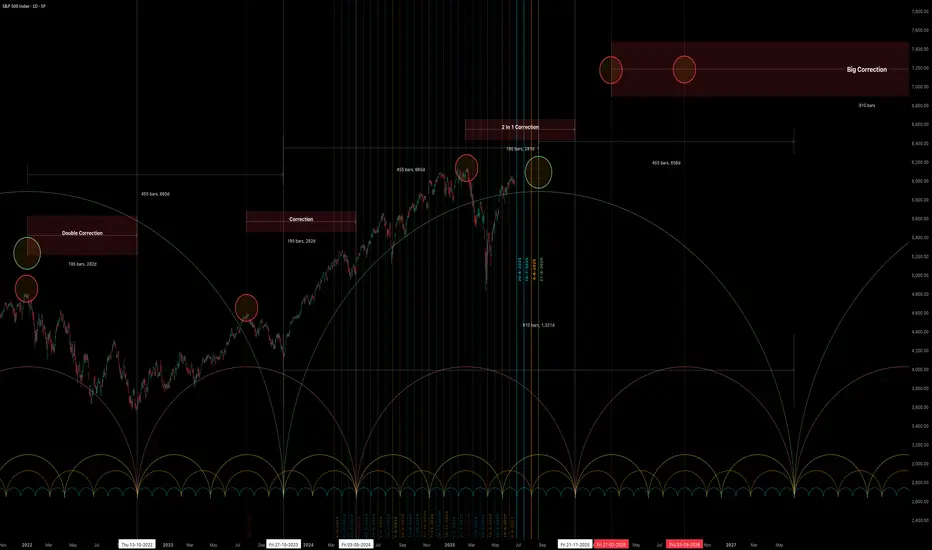
Big CorrectionThe S&P index.
The chart shows the potential end of the final rally from the 2009 low.
Currently, with this rally from the recent 4,800 low, we are still in a correction period that will end in late October (highs and lows are irrelevant), & We have a date coming up in August so let's see what happens there.
After this period, we will have a rally combined with uncertainty and unjustified speculative movements (bubble) that could take us to the final peak, which I expect in 2026.
This remains a possibility, but don't base your trades on it. However, caution is often good.
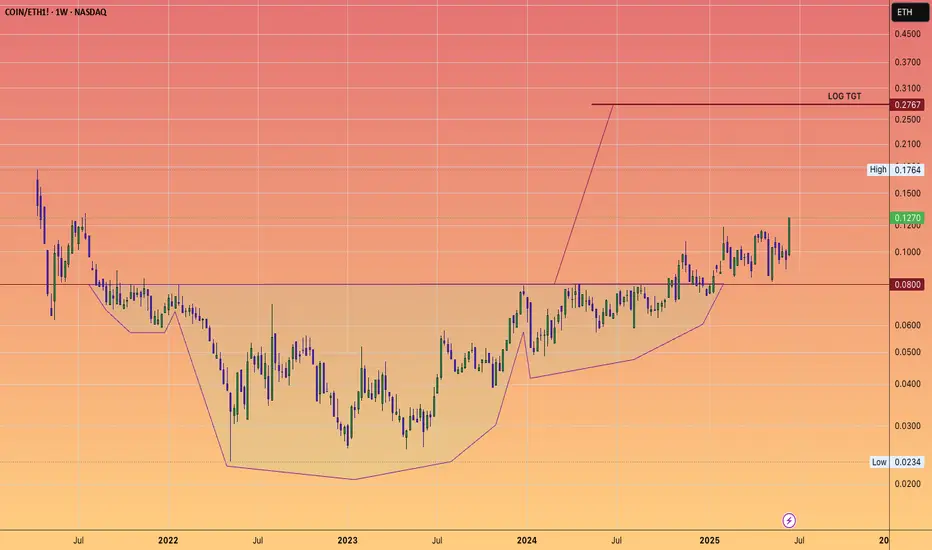
The Chart you don't want to see: Coinbase Vampire attacked ETHBrian Armstrong is a significant influencer in both Silicon Valley and now Washington, D.C., where he is instrumental in shaping legislation and attracting investments that benefit Coinbase and its shareholders.
Vitalik writes blogs and appoints EF directors who appear to have ambiguous gender identities and are quite out there on the spectrum.
Jesse Pollak is yet another astute player who has leveraged ETH's technology to transform BASE into a powerhouse integrating neatly into Coinbase platform for payments and now DEX trading within app.
ETH will thrive.
However, as we've observed, Joe Lubin's return as a public figure to advocate for and steer the future of Ethereum has never been more crucial.
But will it be sufficient to compete with Brian and Jesse? They seem to be operating on a significantly higher plane.
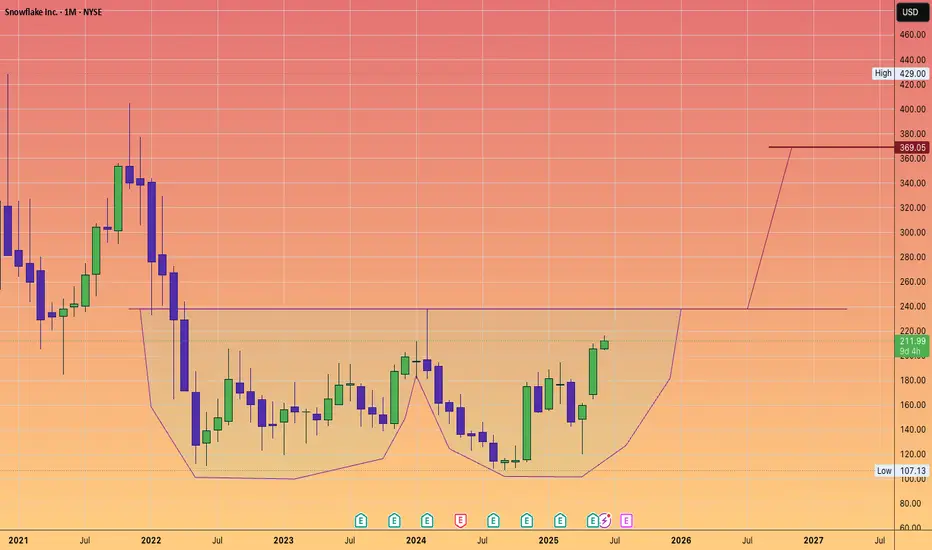
SNOWFLAKE to $369Snowflake Inc. is an American cloud-based data storage company.
Headquartered in Bozeman, Montana, it operates a platform that allows for data analysis and simultaneous access of data sets with minimal latency. It operates on Amazon Web Services, Microsoft Azure, and Google Cloud Platform.
As of November 2024, the company had 10,618 customers, including more than 800 members of the Forbes Global 2000, and processed 4.2 billion daily queries across its platform
#DoubleBottom
#Wformation
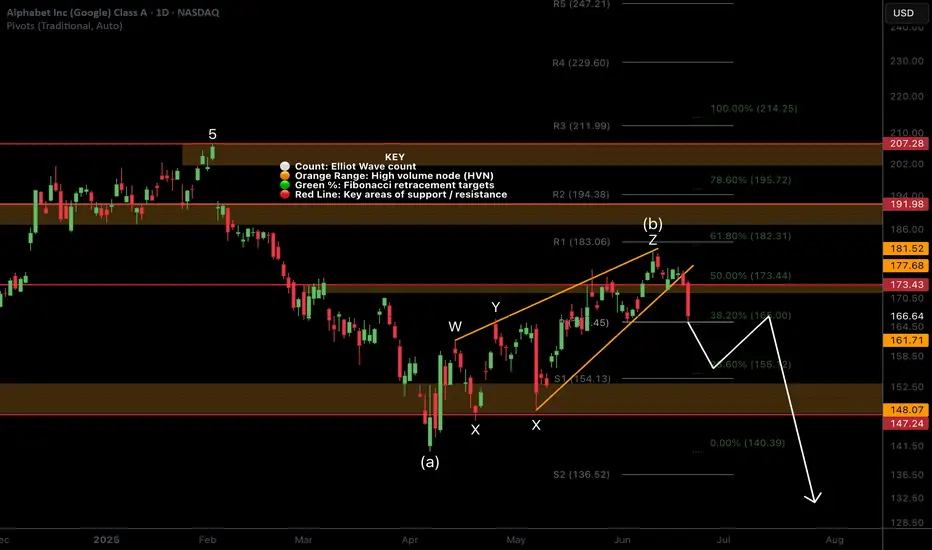
Google MUST hold this critical level!NASDAQ:GOOG local analysis update
📈 𝙇𝙤𝙣𝙜 𝙩𝙚𝙧𝙢 Further decline below the daily 200EMA, High Volume Node (HVN) and pivot point which it closed below on Friday could see google price fall back below $140.
📉 𝙎𝙝𝙤𝙧𝙩 𝙩𝙚𝙧𝙢 the bullish run has ended with Fridays bearish engulfing, first support below the support it is currently sat at is $156.
Irans conflict has investors shaken and not willing to hold assets over the weekend on the fear of worse news. However, if the conflict is resolved investors could have a great buying opportunity.
𝙏𝙚𝙘𝙝𝙣𝙞𝙘𝙖𝙡 𝘼𝙣𝙖𝙡𝙮𝙨𝙞𝙨
Price is challenging a triple shield: major support HVN, daily pivot and the daily 200EMA. Holding this level is critical and locks in a corrective Elliot Wave pattern from the $140 level completing between the 0.5-0.618 Fib retracement.
Daily DEMA Is about to produce a death cross while RSI is neutral with plenty of room to fall.
Safe trading