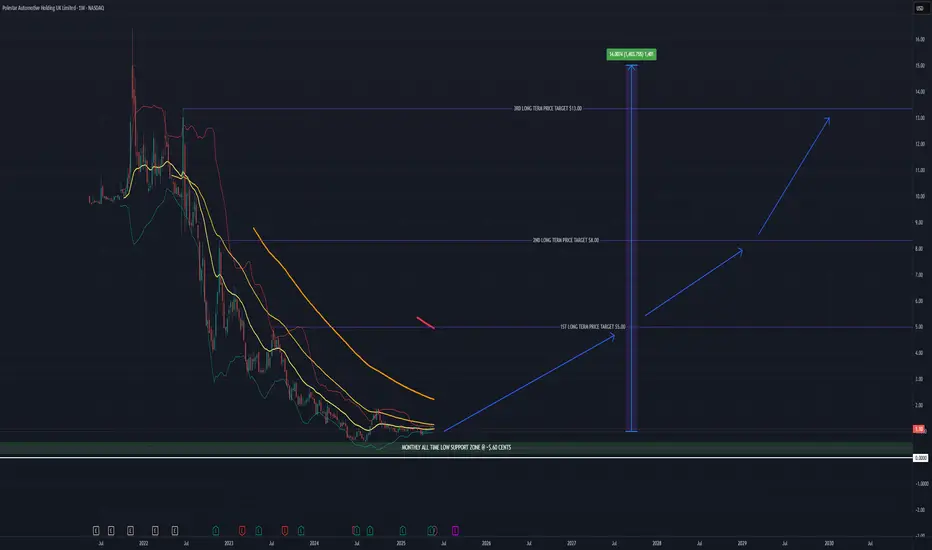
POLESTAR (PSNY) - LONGTERM BUYING OPPORTUNITY, RISK:REWARD 1:10Polestar (PSNY) has been in a long term downtrend since its launch on the NASDAQ, the EV sector has seen some excitement however adoption to EV vehicles has been a slow trend worldwide compared to the hype when first introduced. At current, EV sector participants are in the beginning phases of mass adoption and battery and charger technology is seeing some much needed advancement before mass adoption can take place, many barriers exist in real world infrastructure and this technology will take many years to advance. The promise of autonomous self driving will ultimately catapult these EV companies to new heights financially, however the timing is not right just yet. Once AI advances enough to power ASD, rob taxis and self driving will be a common sight around the world starting in smaller cities and eventually becoming advanced enough to power more of the vehicles worldwide. Polestar's all time low trading price is at $.60 cents and currently sits right above $1.00 per share. Any price between $.60 cents and its current price would be a good 1:10 risk reward investment with downside very limited to potential upside gains to $10 and potentially higher in the long term future. If the EV and AI fulfill its promise, the investment should pay off in the long term.
Disclaimer: With any investment advice especially those where you plan to invest your hard earned money, do your own research before taking any financial advice to understand your exposure and risk tolerance, analyze the utilization of any broker(s) or investment vehicle(s) to understand how your funds are stored or utilized within the platform and always have a plan and strategy prior to entering any market.
Stocks!
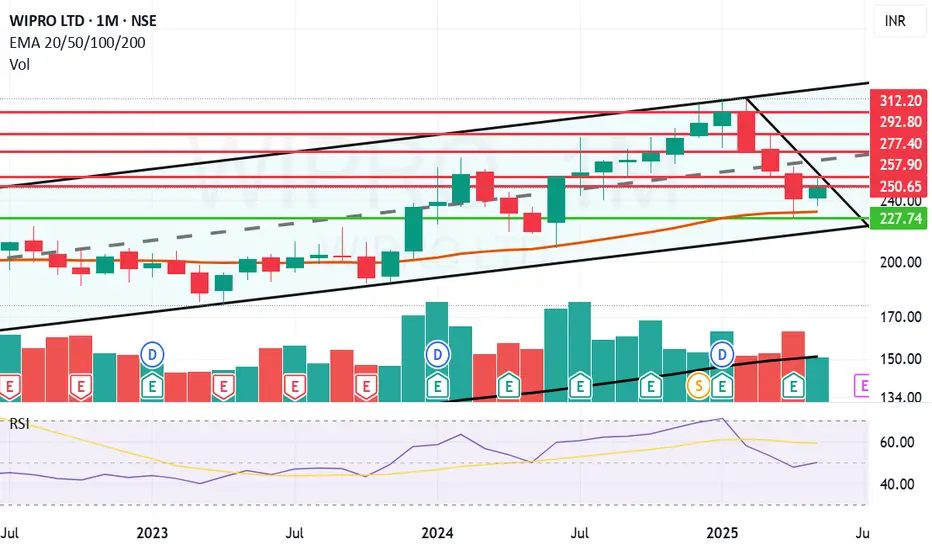
Wipro in recovery mode on monthly chart.Wipro Ltd. is a global information technology, consulting and outsourcing company, which engages in the development and integration of solutions.
Wipro Closing price is 249.67. The positive aspects of the company are Attractive Valuation (P.E. = 19.9), Companies with Zero Promoter Pledge, Companies with Low Debt, Annual Profit Growth higher than Sector Profit Growth, Company able to generate Net Cash - Improving Net Cash Flow for last 2 years and FII / FPI or Institutions increasing their shareholding. The Negative aspects of the company are Stocks Underperforming their Industry Price Change in the Quarter, Promoter decreasing their shareholding, Increasing Trend in Non-Core Income and MFs decreased their shareholding last quarter.
Entry can be taken after closing above 251 Historical Resistance in the stock will be 257 and 277. PEAK Historic Resistance in the stock will be 292 and 312. Stop loss in the stock should be maintained at Closing below 227.
Disclaimer: The above information is provided for educational purpose, analysis and paper trading only. Please don't treat this as a buy or sell recommendation for the stock or index. The Techno-Funda analysis is based on data that is more than 3 months old. Supports and Resistances are determined by historic past peaks and Valley in the chart. Many other indicators and patterns like EMA, RSI, MACD, Volumes, Fibonacci, parallel channel etc. use historic data which is 3 months or older cyclical points. There is no guarantee they will work in future as markets are highly volatile and swings in prices are also due to macro and micro factors based on actions taken by the company as well as region and global events. Equity investment is subject to risks. I or my clients or family members might have positions in the stocks that we mention in our educational posts. We will not be responsible for any Profit or loss that may occur due to any financial decision taken based on any data provided in this message. Do consult your investment advisor before taking any financial decisions. Stop losses should be an important part of any investment in equity.
Munjal Auto giving a Breakout on Monthly chart. Munjal Auto Industries Ltd. engages in the production of automobile components. It operates through the Auto Components and Composite Products and Molds segments. It manufactures exhaust systems for two wheelers and four wheelers, spoke rims for two wheelers, steel wheel rims for two wheelers and four wheelers, fuel tanks for four wheelers, sheet metal components, seat frames for four wheelers, and other automotive assemblies.
Munjal Auto Closing price is 82.98. The positive aspects of the company are Companies with Zero Promoter Pledge, Companies with Low Debt and FII / FPI or Institutions increasing their shareholding. The Negative aspects of the company is Stocks Underperforming their Industry Price Change in the Quarter.
Entry can be taken after closing above 83 Historical Resistance in the stock will be 88.5 and 96. PEAK Historic Resistance in the stock will be 109 and 119. Stop loss in the stock should be maintained at Closing below 72.3 or 60.7 depending upon your risk taking ability.
Disclaimer: The above information is provided for educational purpose, analysis and paper trading only. Please don't treat this as a buy or sell recommendation for the stock or index. The Techno-Funda analysis is based on data that is more than 3 months old. Supports and Resistances are determined by historic past peaks and Valley in the chart. Many other indicators and patterns like EMA, RSI, MACD, Volumes, Fibonacci, parallel channel etc. use historic data which is 3 months or older cyclical points. There is no guarantee they will work in future as markets are highly volatile and swings in prices are also due to macro and micro factors based on actions taken by the company as well as region and global events. Equity investment is subject to risks. I or my clients or family members might have positions in the stocks that we mention in our educational posts. We will not be responsible for any Profit or loss that may occur due to any financial decision taken based on any data provided in this message. Do consult your investment advisor before taking any financial decisions. Stop losses should be an important part of any investment in equity.

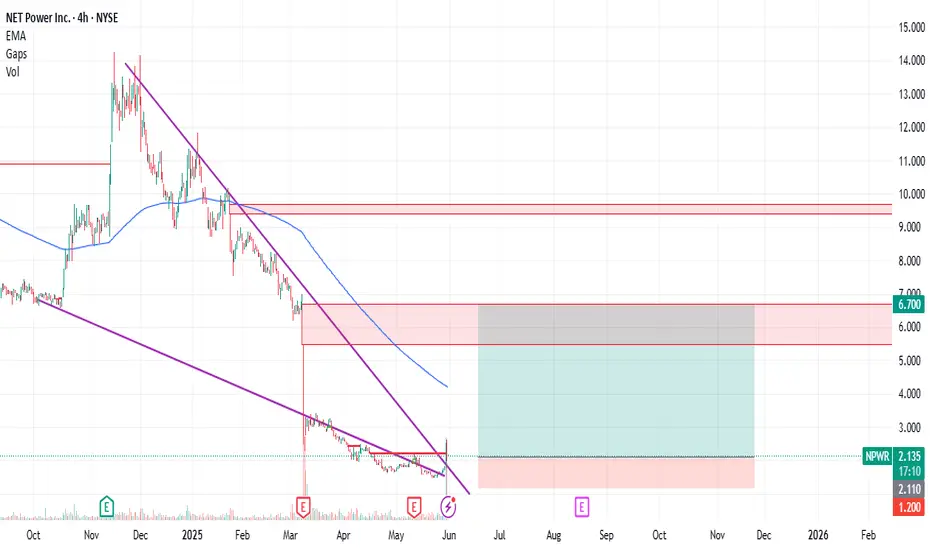
NPWR : Small Position Size Play with 5.00 Risk-Reward RatioNet Power Inc. NPWR stock has seen high volume and a tendency to break the falling wedge. Can this initiative close the gap that ended at 6.7 ?
This traded can be tried with very small position size.
Because Stop-Loss and Target are very wide.
Risk-Reward Ratio : 5.00
Stop-Loss : 1.20
Target: 6.70
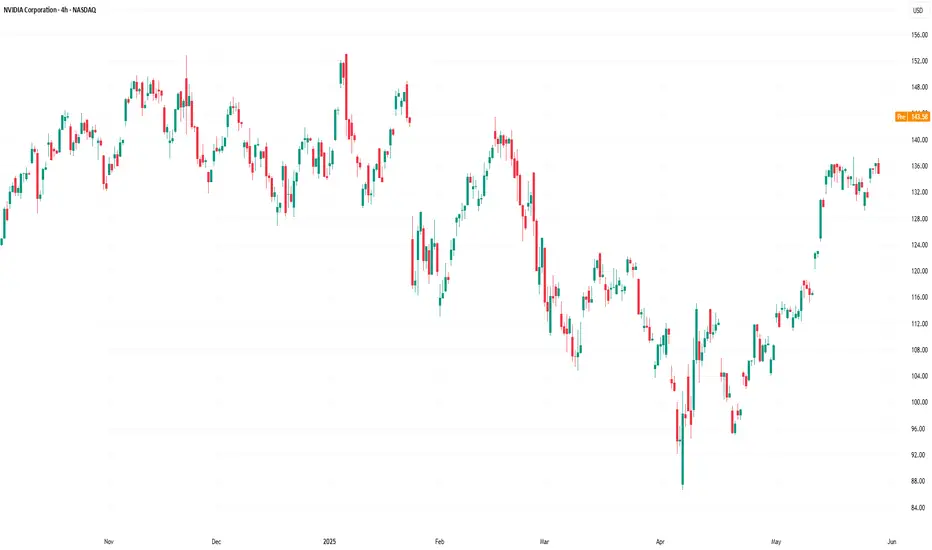
NVIDIA Massive Cup and Handle targets $200.NVIDIA Corporation (NVDA) is pulling back aggressively following yet another positive Earnings report, where they beat the estimates again but the market is reacting with selling. That has been a 'norm' in the past 12 months but even from a technical standpoint, the price reached the 143.60 Resistance level (made of the February 18 High), so profit taking is technically normal market behavior here.
On the longer term however, this Resistance test potentially forms the top f a very powerful pattern, the Cup and Handle (C&H). At the moment, the market has the support of both the 1D MA200 (orange trend-line) and 1D MA50 (blue trend-line) and the Handle, which has just started, has some room to safely consolidate for a while before the pattern break-out upwards.
Technically, C&H patterns reach their 2.0 Fibonacci extensions after the break-out, so our medium-term Target is set at $200.
Notice also the Bearish Divergence on the 1D RSI, which is similar to that of late October 2024. A break below the 1D MA50 risks the bullish structure on this pattern.
-------------------------------------------------------------------------------
** Please LIKE 👍, FOLLOW ✅, SHARE 🙌 and COMMENT ✍ if you enjoy this idea! Also share your ideas and charts in the comments section below! This is best way to keep it relevant, support us, keep the content here free and allow the idea to reach as many people as possible. **
-------------------------------------------------------------------------------
💸💸💸💸💸💸
👇 👇 👇 👇 👇 👇

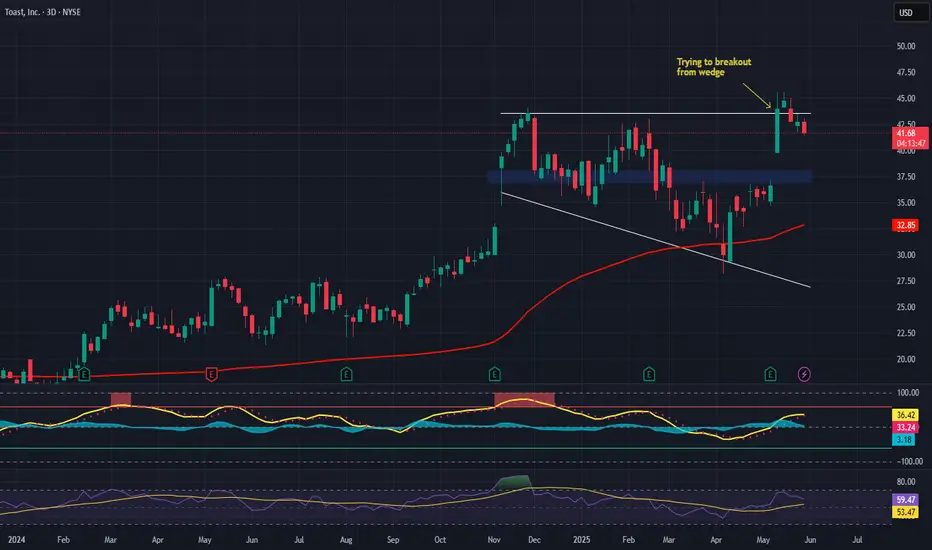
Toast, Inc. (TOST) – Powering the Future of RestaurantsCompany Snapshot:
Toast NYSE:TOST is cementing its position as the go-to restaurant operating system, offering integrated solutions for payments, POS, inventory, and guest engagement—all tailored for food service businesses.
Key Catalysts:
Recurring Revenue Powerhouse 💸
ARR hit $1.7B in Q1 2025 — up 31% YoY
SaaS-driven model provides high visibility and stickiness
Expanding Client Base & Network Effects 📈
Serving ~140,000 locations, up 25% YoY
More locations = richer data + stronger product improvement + increased client lock-in
Enterprise-Grade Momentum 🏢🍔
Wins with Applebee’s (~1,500 locations) and Topgolf demonstrate Toast's scalability
Validates ability to support complex, high-volume operators
Operating Leverage in Motion ⚙️
As ARR scales, margins improve—positioning Toast for profitable growth over time
Investment Outlook:
✅ Bullish Above: $37.00–$38.00
🚀 Target: $60.00–$62.00
📈 Growth Drivers: Enterprise adoption, recurring revenue, SaaS scale, network effects
💡 Toast is becoming the digital backbone of modern restaurants—serving up growth with every seat. #TOST #SaaS #RestaurantTech
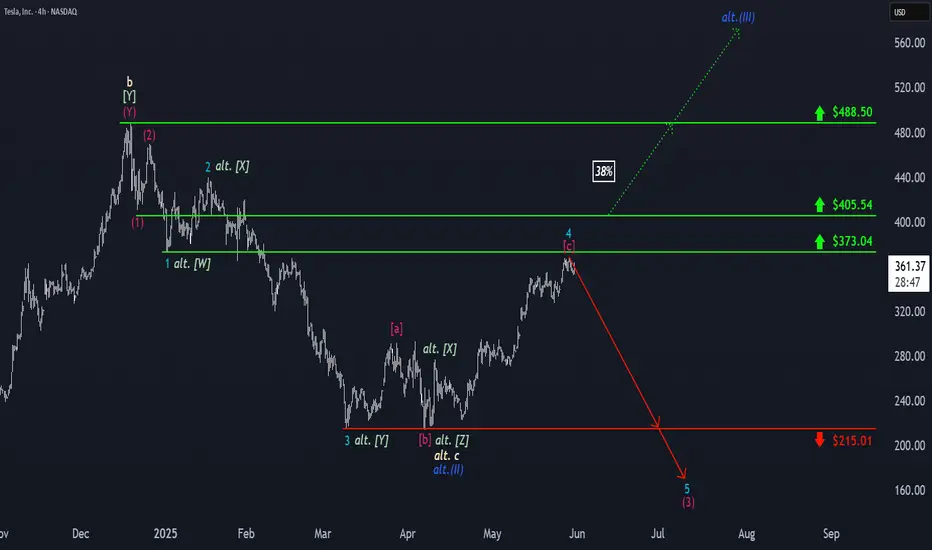
Tesla: Completed!TSLA has moved somewhat closer to the resistance at $373.04 since our last update, but these gains have now been tempered. We now consider the turquoise wave 4 as finished and anticipate imminent sell-offs during wave 5. These should eventually complete the magenta wave (3) of a larger downward impulse below the support at $215.01. However, due to recent upward momentum, we have increased the relevance of our alternative scenario. We now consider it 38% likely that the stock has already completed the large correction of the blue wave alt.(II) with the last significant low and will continue to rise directly during wave alt.(III). In this case, the price would next not only rise above the nearby resistance at $373.04 but also overcome the higher levels at $405.54 and $488.50.
📈 Over 190 precise analyses, clear entry points, and defined Target Zones - that's what we do.
Musk Steps Away from Politics: What Does It Mean for Tesla?Musk Steps Away from Politics: What Does It Mean for Tesla (TSLA) Stock?
Yesterday, it was announced that Elon Musk will be stepping down from the Trump administration as his term as head of DOGE—where he focused on reducing government spending—has come to an end.
This decision follows his statement at the economic forum in Qatar, where Musk said he plans to focus less on politics, as he feels he has already done enough in that realm.
What Does This Mean for Tesla (TSLA) Stock?
Musk’s move away from politics is likely a positive signal for investors. Here's why:
→ The company’s CEO can now devote more time to addressing issues such as declining vehicle sales in Europe;
→ Musk’s role at DOGE will no longer pose reputational risks for Tesla..
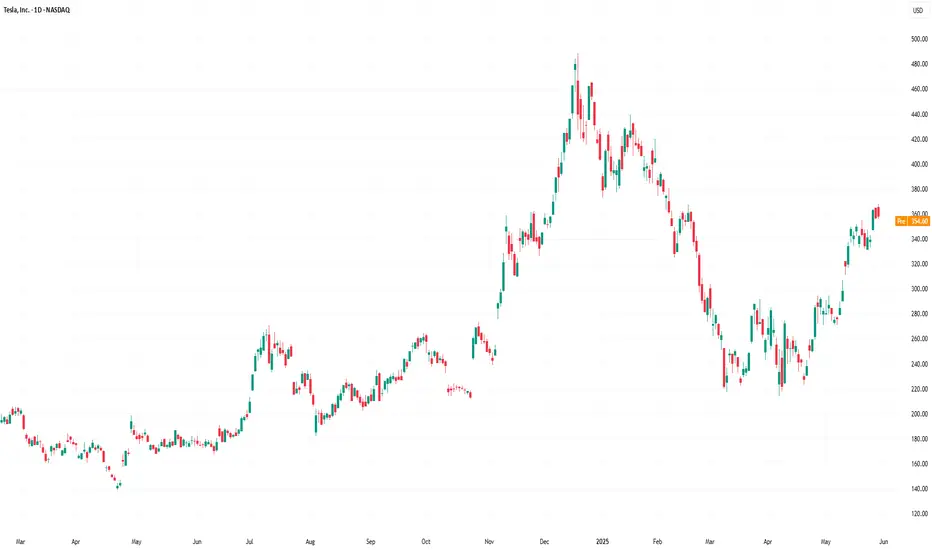
During yesterday’s main trading session, TSLA stock surged to $367—its highest level since mid-February.
Technical Analysis of TSLA Stock Chart
The price continues to hover near the upper boundary of an ascending channel (marked in blue), which could pose a challenge for further upward movement.
Additionally, the price has entered the $355–$375 range—a zone that previously triggered significant reversals (as indicated by arrows). Notably, there was a sharp decline from this zone between February 21–26. From a bearish standpoint, this area could act as resistance, and the candle’s close near its low yesterday supports this view.
From a bullish perspective, the fundamental outlook may still provide upward momentum:
→ A joint press conference with Trump and Musk is scheduled for today;
→ In early June, Tesla is expected to begin testing its autonomous taxis.
So, while a continued uptrend is possible, a short-term correction would seem reasonable after TSLA’s nearly 27% surge throughout May.
This article represents the opinion of the Companies operating under the FXOpen brand only. It is not to be construed as an offer, solicitation, or recommendation with respect to products and services provided by the Companies operating under the FXOpen brand, nor is it to be considered financial advice.
NVIDIA 1D — When “Head & Shoulders” Aren’t Just for the GymOn the daily chart, NVDA has broken out of the descending channel and reclaimed the 50-day moving average (MA50), triggering a classic inverted head and shoulders formation. Price is now holding above the key $113–$114.50 zone, confirming a structural shift. As volume picks up, buyers are eyeing the next levels of resistance.
Near-term upside targets: – $119.80 (0.5 Fibonacci) – $127.62 (0.382) – $137.28 (0.236) — primary resistance zone – Extended target — $152.91 (1.0 Fibonacci projection)
Technical setup: — Breakout from channel + above MA50
— Inverted head and shoulders pattern completed
— $114.50–$118.00 now acts as buyer support
— EMA and MA convergence supports trend reversal
— Increasing volume on rallies supports bullish momentum
Fundamentals: NVIDIA remains the AI and semiconductor sector leader. Growing demand for high-performance GPUs in AI and data centers positions NVDA as a core tech play. Expectations of strong earnings and continued institutional accumulation support the bullish narrative.
The confirmed breakout and inverted H&S setup mark a clear structural reversal. As long as price stays above $114.50, the path toward $127–$137 remains the primary target zone, with $152.91 in sight if momentum continues.

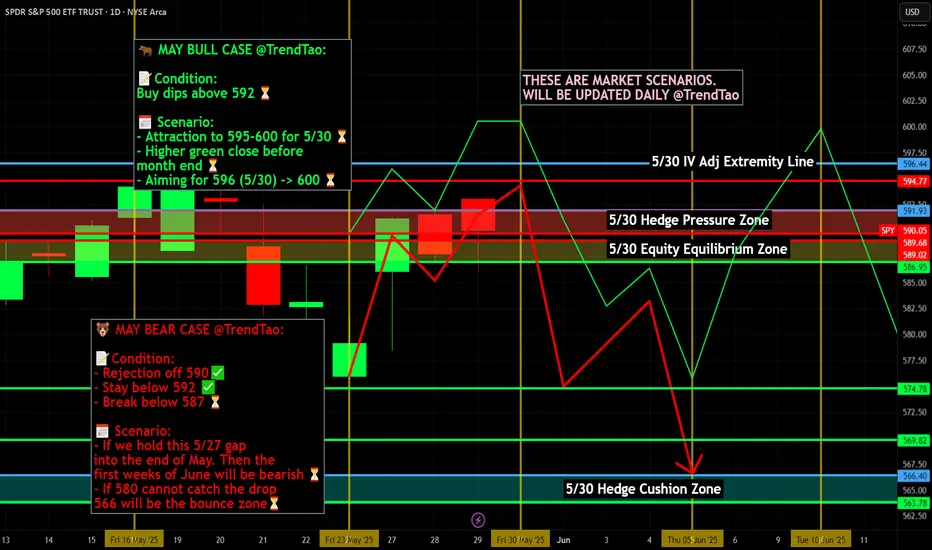
Nightly $SPY / $SPX Scenarios for May 30, 2025🔮 Nightly AMEX:SPY / SP:SPX Scenarios for May 30, 2025 🔮
🌍 Market-Moving News 🌍
🤝 Debt-Ceiling Deal Advances
The U.S. House passed a bipartisan framework extending the federal borrowing limit through September, easing immediate default fears and lifting risk assets.
📉 Bond Yields Retreat
After surging above 4.6% earlier this week, the 10-year Treasury yield dipped back toward 4.5%, helping equities recover from recent rate-driven pullbacks.
⛽ Oil Inventories Jump
API data showed a 5.2 million-barrel build in U.S. crude stocks last week, sending oil prices lower and weighing on energy sector names.
🚗 Tesla Price Cut Spurs EV Rally
Tesla ( NASDAQ:TSLA ) cut Model 3 prices by 3% in the U.S., igniting a broader EV stock rally as investors priced in renewed demand ahead of summer driving season.
📊 Key Data Releases 📊
📅 Friday, May 30:
8:30 AM ET: Personal Consumption Expenditures (PCE) Price Index for April
Measures core inflation trends—Fed’s preferred gauge of consumer-price pressures.
10:00 AM ET: Pending Home Sales for April
Tracks signed contracts on existing homes; a leading indicator for the housing market.
⚠️ Disclaimer:
This information is for educational and informational purposes only and should not be construed as financial advice. Always consult a licensed financial advisor before making investment decisions.
📌 #trading #stockmarket #economy #news #trendtao #charting #technicalanalysis
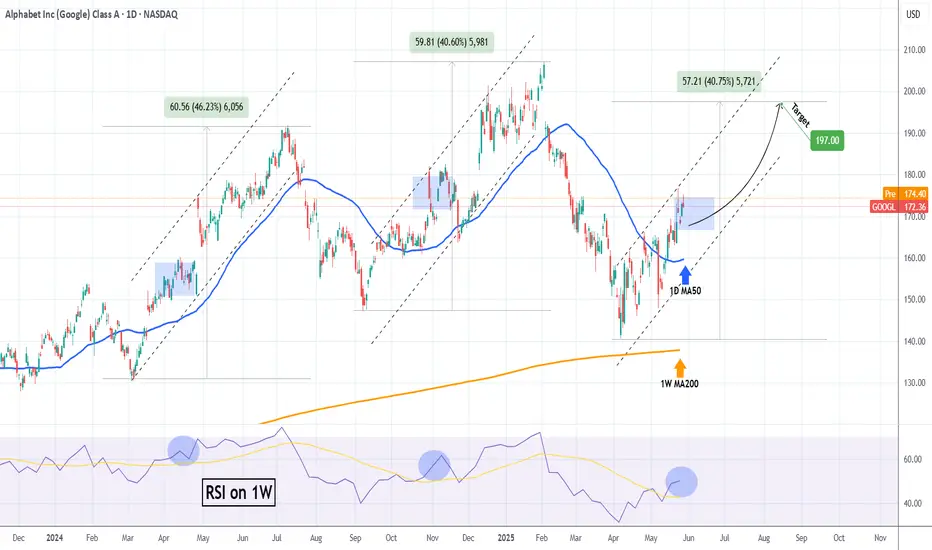
GOOGLE Repeating 2024 pattern and eyes $197.00Alphabet Inc. (GOOG) has established a Channel Up pattern since the (near) 1W MA200 (orange trend-line) rebound. With the 1D MA50 (blue trend-line) now acting as a Support, this pattern resembles the Channel Up formations that emerged in 2024.
Both in terms of 1W RSI and pure price action alike, we are in a similar consolidation level as November and April 2024. Both patterns peaked after similar rallies (+40.60% and +46.23% respectively), so the minimum Target we are expecting on the medium-term is $197.00.
-------------------------------------------------------------------------------
** Please LIKE 👍, FOLLOW ✅, SHARE 🙌 and COMMENT ✍ if you enjoy this idea! Also share your ideas and charts in the comments section below! This is best way to keep it relevant, support us, keep the content here free and allow the idea to reach as many people as possible. **
-------------------------------------------------------------------------------
💸💸💸💸💸💸
👇 👇 👇 👇 👇 👇
Nvidia Stock Price Rises Over 4% Following Earnings ReportNvidia (NVDA) Stock Price Rises Over 4% Following Earnings Report
Yesterday, after the main trading session, Nvidia released its quarterly earnings report, which exceeded analysts' expectations:
→ Earnings per share: actual = $0.81, forecast = $0.73
→ Revenue: actual = $44 billion, forecast = $43.3 billion
Additionally, according to media reports, Nvidia issued a strong forecast for the next period, although CEO Jensen Huang noted difficulties in accessing the Chinese market, which he estimates to be worth $50 billion.
Nevertheless, market participants reacted positively. According to Google, in after-hours trading the NVDA stock price rose by more than 4%, surpassing the $140 level.
It is reasonable to assume that this initial positive reaction could continue during today’s main trading session.
Technical Analysis of NVDA Chart
As we mentioned earlier this week, NVDA stock in 2025 has formed a broad descending channel (shown in red), and just before the earnings release, the price was consolidating near the upper boundary of this channel.
We also suggested a scenario in which the bulls might attempt to break through the upper boundary of the channel. Given the positive earnings report and the stock market rally following the Federal Court’s decision declaring Trump tariffs invalid, the likelihood of this scenario increases.
This, in turn, means that:
→ the upper boundary of the channel, once broken, may act as support;
→ we may once again see the key psychological resistance level of $150 come into play — a level we have highlighted multiple times before.
This article represents the opinion of the Companies operating under the FXOpen brand only. It is not to be construed as an offer, solicitation, or recommendation with respect to products and services provided by the Companies operating under the FXOpen brand, nor is it to be considered financial advice.
SP500 // Stock Market Still a Buy? Here’s My ETF ApproachUnlike the Forex market, in the stock market—even when we’re hitting new highs and running out of chart space—it still makes sense to continue accumulating positions in U.S. indices. For a more profitable and diversified approach, ETFs offer a wide range of options: SPY, TQQQ, QQQ, and international ones like VEA.
Where do you trade stocks? I'm curious to hear what platforms and strategies others are using.
If you have any questions about building a portfolio or selecting ETFs, feel free to reach out. Happy to share insights and help where I can.
Wishing you consistency and strong returns.
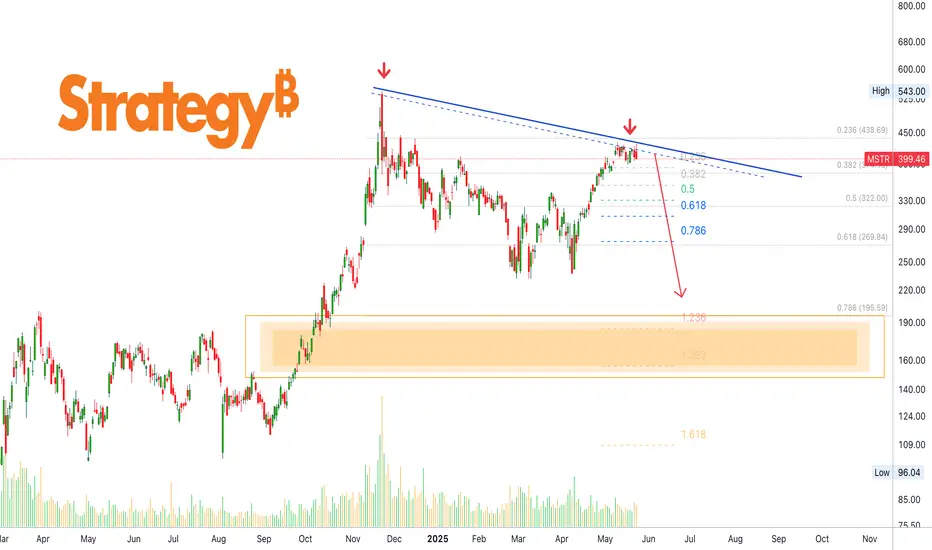
Strategy Set To Drop —Selling Bitcoin?If you knew a stock was going to crash but this stock is related to Bitcoin and always moves with Bitcoin but now is about to detach, would you tell others?
Bitcoin is already trading at a new All-Time High and six weeks green. Ok, let's forget about Bitcoin because this is about MicroStrategy (now Strategy).
The MSTR stock is bearish now. Very bearish.
The top happened in November 2024.
9-May 2025 we have a long-term lower high. Days at resistance and this lower high is confirmed.
A scandal is about to be uncovered?
A change of "strategy"? Hah, nice play on words.
Is strategy going to have a change of strategy?
This change of strategy obviously will end up screwing everybody who holds this stock?
I don't know... I mean, who knows.
Here is what I know. The chart signals are pointing down. Bearish confirmed so, down we go.
Namaste.
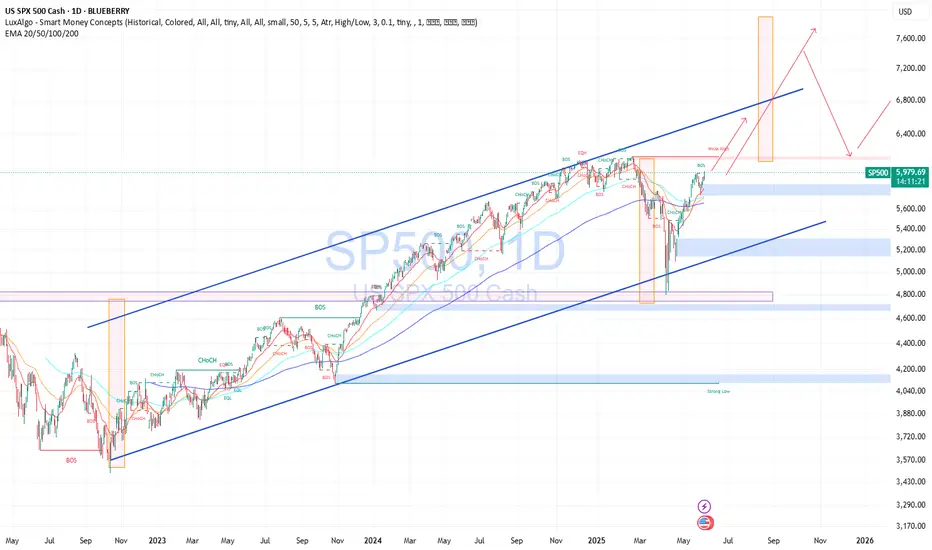
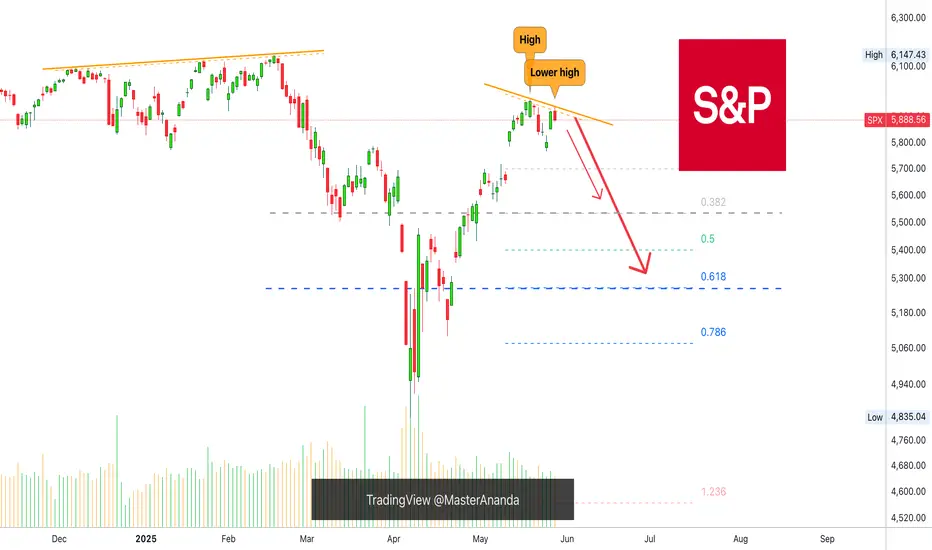
SHORT The S&P 500 Index: Not A Bear Market, Just A CorrectionWe are about to witness an inception of bearish action. A correction within a correction.
After 7-April, the Cryptocurrency market started to recover, but the main Altcoins that were growing were all memecoins, and I wondered, "Why are mainly memecoins growing?" I know that when memecoins grow the market is actually bearish on the bigger picture. I shrugged it off and went LONG.
It seems I have an explanation now, this recovery was only a partial recovery or, we are just in front of a classic retrace, a small correction. This means that regardless of how fast and strong it goes the end will result in a higher low, compared to 7-April. This means that the bullish structure will remain intact, but you can't change the fact that strength is not present on this chart.
The SPX is going down next. There two main support levels to consider, you decide which one is the one that you should take. My job is to alert you of the event before it happens, great timing and entry prices, you can take care of the rest.
Thank you for reading.
This is a friendly reminder.
Market conditions can always change.
Namaste.
Nightly $SPY / $SPX Scenarios for May 29, 2025 🔮 Nightly AMEX:SPY / SP:SPX Scenarios for May 29, 2025 🔮
🌍 Market-Moving News 🌍
🚫 U.S. Trade Court Blocks Tariffs
A federal trade court struck down key sections of President Trump’s steel and aluminum tariffs, sending U.S. stock futures sharply higher as investors anticipate reduced input costs for industrials and manufacturers
🌐 Markets Drift on Lack of Fresh Catalysts
Global equity markets showed muted moves today—stocks dipped and bond yields rose—as traders awaited new drivers of direction, with Nvidia’s ( NASDAQ:NVDA ) mixed earnings doing little to spark a decisive trend
📈 Bond Yields Climb, Pressuring Equities
The U.S. 10-year Treasury yield pushed above 4.6%, its highest in a month, on concerns over federal borrowing and fading rate-cut expectations, dragging the S&P 500 down more than 1% by midday
📊 Key Data Releases 📊
📅 Thursday, May 29:
8:30 AM ET: Advance Q1 GDP
Provides the first estimate of U.S. economic growth in Q1, a critical gauge of recession risk and Fed policy direction.
8:30 AM ET: Personal Income & Spending (April)
Tracks household earnings and outlays, offering insight into consumer resilience amid rising living costs.
⚠️ Disclaimer:
This information is for educational and informational purposes only and should not be construed as financial advice. Always consult a licensed financial advisor before making investment decisions.
📌 #trading #stockmarket #economy #news #trendtao #charting #technicalanalysis

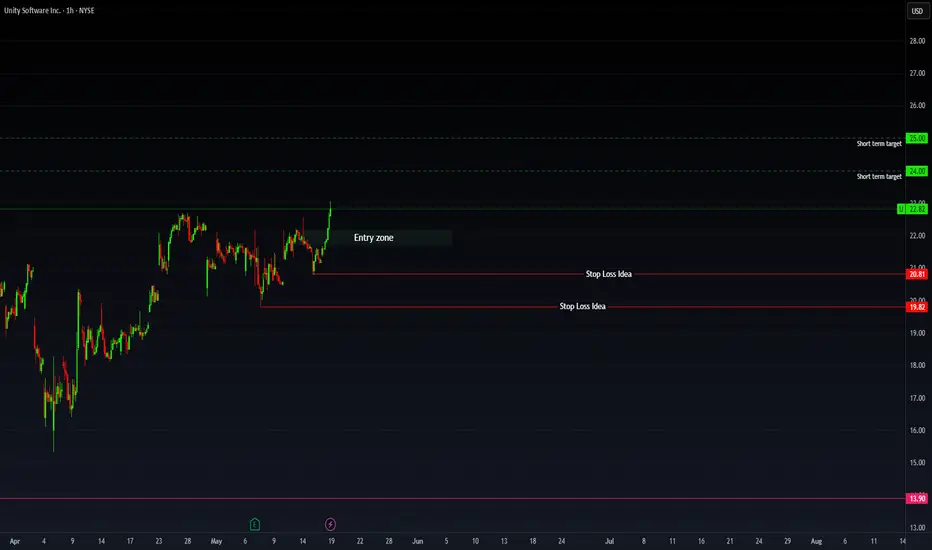
Unity Software (U) – Strong Earnings and Bullish FlowsFundamental Overview
Unity Software has been consolidating within a defined range for approximately a year following a significant decline in its stock price. Despite previous challenges, the company has consistently surprised investors with its earnings over the past year, maintaining strong performance. Historically, Unity tends to perform well during the May–June period. Looking ahead, projections suggest a decline in net margin, though net income is expected to increase, reinforcing the company's strong execution.
Additionally, Unity has exceeded expectations for four consecutive earnings reports, underscoring its resilience and growth trajectory.
Technical Outlook
- Momentum & Price Action: The stock exhibits solid momentum and is currently situated in a buy zone.
- Options Flow: Bullish sentiment is evident in options activity, signaling strong institutional interest.
- Analyst Ratings:
- Needham analyst Bernie McTernan maintains a Buy rating but lowers the price target from $33 to $30.
- Barclays analyst Ross Sandler maintains an Equal-Weight rating and lowers the price target from $26 to $25.
Given the current trends, bullish options flows, and favorable seasonality, Unity Software appears poised to test $25 in the upcoming weeks, particularly if momentum continues to drive price action.
WGMI - Livermore Accumulation Cylinder From what I can see, in such an underloved sector of the market (Bitcoin reaching new highs whilst mining stocks suffer), it appears to me that WGMI is in an accumulation pattern, and could have explosive moves in later quarters this year.

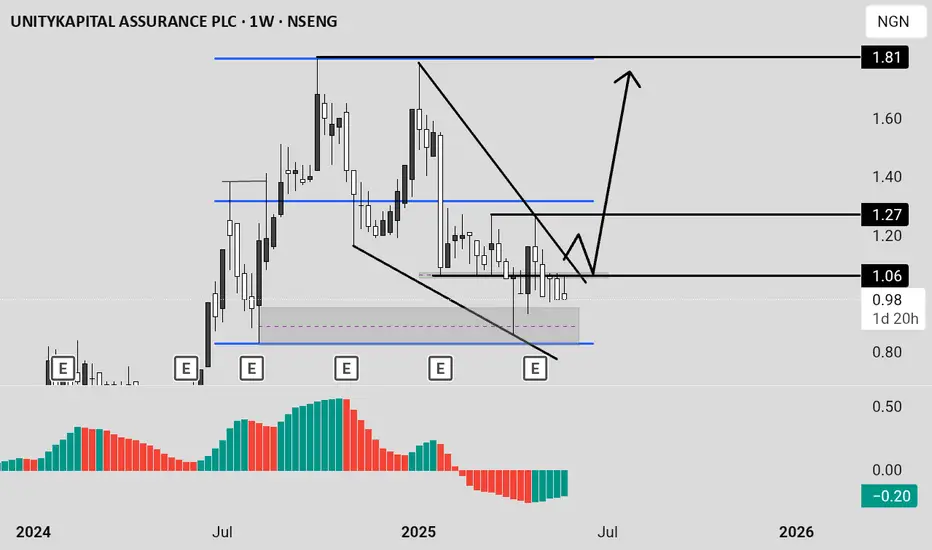
WATCH OUT FOR VERITASKAPFrom around 0.83, VERITASKAP created an all-time high of around 1.81. This happened between August 2024 and September 2024. Then, price dropped into the discount level where is currently. The current price action shows that price is in a discount level, at a demand zone and within a falling wedge.
From a chart pattern perspective, falling wedge can be seen on the chart and a break out of the downtrend and resistance level around 1.06 with a bullish candle closing above these levels will serve as a strong indication that the stock is ready to rally up as much as the all-time high.
From a technical indicator perspective, awesome oscillator is below 0, showing that the stock is oversold. In addition, there is a bullish indication on the awesome oscillator as shown by its colour and upward movement. This is pointing to the fact that the value of the awesome oscillator is moving towards 0 and can cross over it which can be a good indication for a rise in price as well.
From a smart money concept perspective, a break of the last high (around 1.27) that led to the last bearish internal break of structure will as serve as indication of a bullish trend. Hence, the target will the all-time high.
Either way, the stock has a good potential. An aggressive trader or investor may buy at the current market price. While a conservative trader or investor may wait for a breakout.
Watch out for the confluences indicating potential rise in price so as to not miss out on the benefit.
AMAZON eyes $255 on the 3rd such buy signal in 18 months!AMAZON Inc. (AMZN) has been trading within a 18-month Bullish Megaphone pattern whose latest bottom was on the April 07 2025 Low. Since then, the pattern has started its new Bullish Leg, which has been confirmed by the break-out above its 1D MA50 (blue trend-line) and the 1W RSI's above its MA.
The previous two Bullish Legs hit at least their 3.5 Fibonacci extension levels and the 2nd Bullish was +30% more than the 1st. If the stock achieves a +60% gain from its April bottom again, it will be almost exactly on its 3.5 Fib ext.
As a result, we believe that a $255 Target (on the 3.5 Fib), is more than realistic to be achieved by September.
-------------------------------------------------------------------------------
** Please LIKE 👍, FOLLOW ✅, SHARE 🙌 and COMMENT ✍ if you enjoy this idea! Also share your ideas and charts in the comments section below! This is best way to keep it relevant, support us, keep the content here free and allow the idea to reach as many people as possible. **
-------------------------------------------------------------------------------
💸💸💸💸💸💸
👇 👇 👇 👇 👇 👇

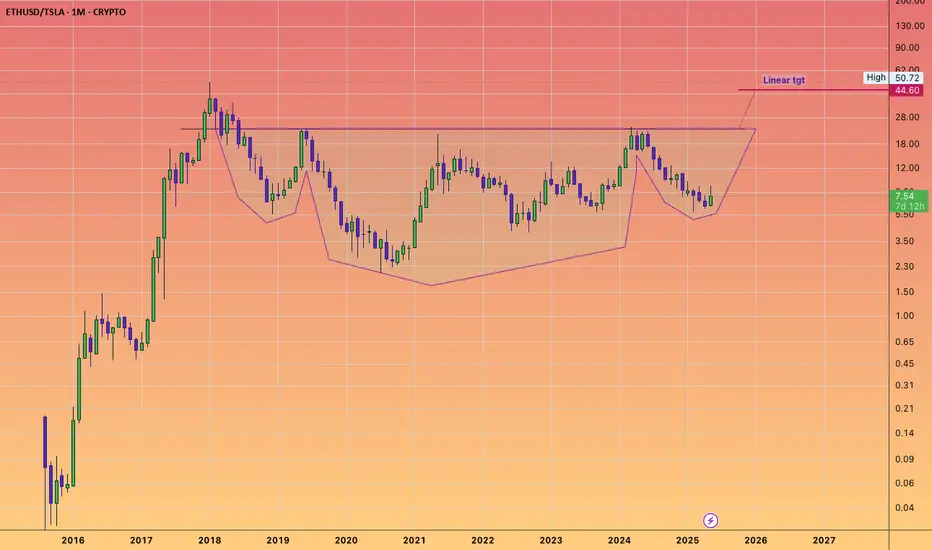
Your are not Bullish enough on ETHExperts foresee Ethereum’s future mirroring that of early Amazon and Microsoft, predicting significant growth.
Analysts draw parallels between Ethereum (ETH) and major tech companies such as Amazon and Tesla, indicating that it could be a high-growth asset moving forward.
Even though ETH has experienced a recent decline, several analysts point out the increasing interest from institutional investors, with substantial holders actively accumulating.
The long-term prospects of Ethereum are linked to its innovative capabilities and established reputation, with its security-oriented strategy echoing Amazon’s approach to growth.
The analyst pointed out that this is a pivotal moment to "front-run" Ethereum's potential supremacy in the blockchain arena. He emphasized that Ethereum is set apart by its ongoing innovation; however, instead of focusing on immediate user expansion, the network has prioritized security. This dedication to dependability has established Ethereum as the most reliable settlement layer in the sector.
Please refrain from analyzing ETH as if it were Procter & Gamble. Acquiring ETH is more akin to investing in a high-growth stock like AMZN, MSFT, or TSLA from decades past.
Ethereum's approach to enhancing the dominance of the EVM could be compared to Amazon.
This chart comparing ETH prices to Tesla's stock price indicates a parallel trend of growth and dominance.
Make no mistake, I am quite optimistic about Tesla's prospects through 2030.
But this ongoing head and shoulders pattern implies that as we move into the Crypto Banana zone, ETH will accelerate and potentially surpass Tesla's market cap.
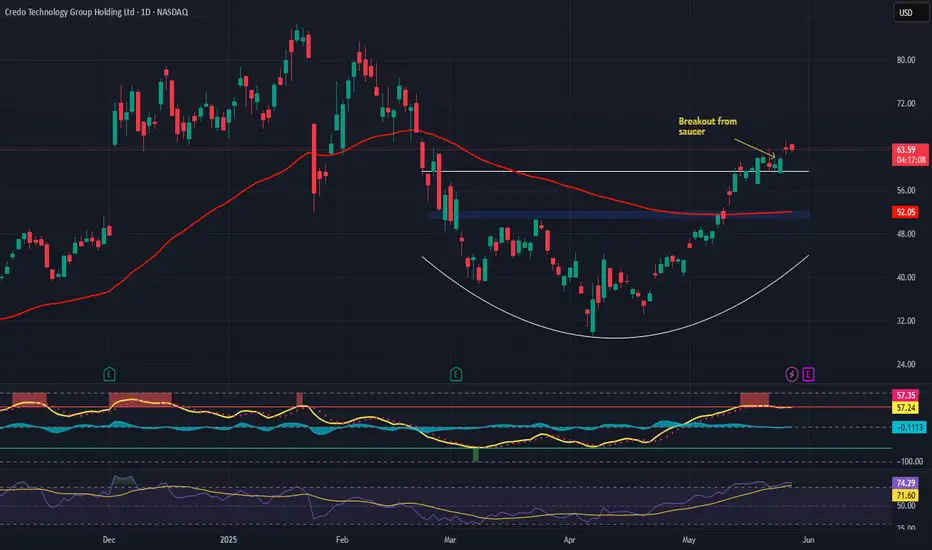
Credo Technology Group (CRDO) – Powering the AI Data Center BoomCompany Snapshot:
Credo Technology NASDAQ:CRDO is a rising star in AI infrastructure, delivering high-speed, low-power connectivity solutions that are mission-critical to modern data centers.
Key Catalysts:
AI Infrastructure Tailwinds 🧠🏢
Direct exposure to Active Electrical Cables (AEC) and PCIe retimers
Positioned for rapid demand acceleration from AI, cloud, and hyperscale data centers
AEC chip market expected to grow 15x from $68M (2023) to $1B+ by 2028
Sticky Software + Hardware Model 🧩
PILOT software platform offers real-time diagnostics and performance tuning
Enables a recurring revenue model and strengthens customer retention
Scalable, Energy-Efficient Portfolio ⚡🌐
High-bandwidth, low-power design aligns with sustainability goals of large data centers
Integrated solutions are already seeing early adoption momentum
Investment Outlook:
✅ Bullish Above: $51.00–$52.00
🚀 Upside Target: $90.00–$92.00
📈 Growth Drivers: AI infrastructure demand, software expansion, chip market scale
💡 Credo isn’t just riding the AI wave—it’s building the rails for it. #CRDO #AIInfrastructure #Semiconductors
Apple Stock Heist Blueprint – Precision Buy Setup Unlocked!🏴☠️ Apple Stock Heist: The Stealthy Long Setup
🎯 Entry Zone – Loot the Dip!
Current Price: $200.21
Action: Initiate long positions now or target pullbacks near the $193–$190 support zone.
Pro Tip: Place buy limits near swing lows/highs. Utilize chart alerts as your secret weapon.
🛡️ Stop Loss – Guard the Treasure!
Swing Traders: Position stop loss below the $190 support level.
Day Traders: Adjust stop loss according to your risk tolerance and order count.
TECHi
💰 Profit Target – Escape with the Loot!
Primary Target: $210 resistance zone.
Secondary Target: $227–$230 range.
⚔️ Scalpers vs. Swing Traders – Choose Your Weapon!
Scalpers: Focus on quick strikes. Enter long positions and exit swiftly.
Swing Traders: Trail stops and lock in gains as the price moves in your favor.
🌪️ Market Pulse – Bullish Winds Blowing!
Technical Indicators: Price is supported near $201, with potential to bounce back toward local resistance at $213.
RSI: Approximately 35 on the 1-hour timeframe, indicating oversold conditions and potential for a rebound.
TradingView
⚠️ News Trap Warning!
Upcoming Events: Monitor for any high-impact news that may affect Apple's stock price.
Strategy: Freeze trades or tighten stops ahead of major announcements.
🚨 Join the Trading Crew!
Engage: Like 👍 or Boost 🚀 this idea to fuel our next raid.
Support: Your engagement keeps the strategies alive!
🤑 Stay Locked In – The Next Big Score is Coming…
Timing: Watch the charts closely.
Action: Strike hard. Exit smarter.
