SP500: Bearish Forecast for Major Indices Starting May 15, 2025Bearish Forecast for Major Indices Starting May 15, 2025
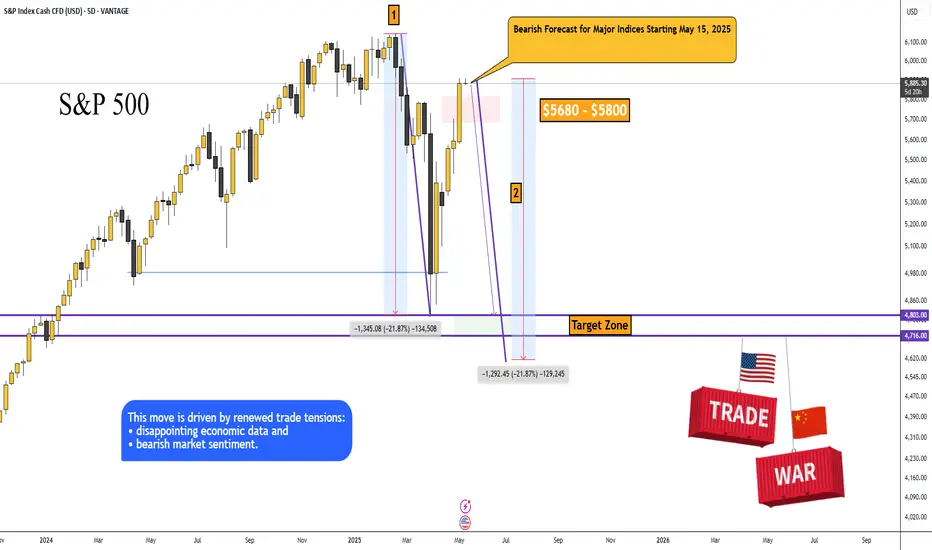
The S&P 500, Dow Jones, Nikkei 225, and other major indices are poised to begin a significant decline, potentially as early as today, May 15, 2025, targeting a retest of the price lows from April 7, 2025, and possibly lower (S&P 500: ~4,802.20, Dow Jones: ~36,611.78, Nikkei: ~30,340.50).
This movement is driven by renewed trade tensions, disappointing economic data, and pervasive bearish market sentiment.
1. Fundamental Factors Driving Potential Decline
1.1. Renewed Uncertainty in Trade Policy
· The rally in indices on May 12–13, 2025, was fueled by optimism surrounding a temporary U.S.-China tariff reduction agreement (a 90-day truce) announced after talks in Switzerland on May 11, 2025. However, as of May 15, 2025, investor confidence may be waning due to a lack of tangible progress in ongoing U.S.-China trade negotiations.
Trigger for May 15: Recent reports highlight conflicting statements from the Trump administration, with earlier promises of new trade deals (e.g., a U.K. deal on May 8) followed by uncertainty. A Reuters report from May 14, 2025, notes that U.S. Trade Representative Jamieson Greer and Treasury Secretary Scott Bessent are meeting with Chinese officials, but no new agreements have been confirmed. If today’s talks yield no positive outcomes or if President Trump escalates rhetoric (e.g., reinstating higher tariffs), markets could plummet, as seen in early April when tariffs triggered a 15% drop in the S&P 500.
· Trade war fears disproportionately impact export-heavy indices like the Nikkei, which is sensitive to yen appreciation and U.S.-China tensions, and the Dow Jones, with its significant exposure to multinational corporations. A breakdown in negotiations could drive indices toward the April 7 lows as investors price in higher costs and slower global growth.
1.2. Disappointments in Economic Data
· CPI Reaction: The April 2025 Consumer Price Index (CPI), released on May 14, 2025, reported inflation at 2.3% annually, below the expected 2.4%. While initially viewed as positive, markets may have anticipated an even lower figure to justify Federal Reserve rate cuts. The modest S&P 500 gain (+0.7%) and Dow’s decline (-0.6%) on May 14 suggest investor skepticism about further inflation cooling.
· Producer Price Index (PPI) Release on May 15: The PPI for April 2025, scheduled for release at 8:30 AM ET (2:30 PM CEST) on May 15, 2025, is a pivotal event. If the PPI indicates persistent wholesale inflation—potentially driven by tariff-related cost pressures—it could signal rising consumer prices ahead, diminishing hopes for Fed policy easing and triggering a sell-off. A higher-than-expected PPI could echo the market’s reaction to mixed economic data in early April, when GDP contraction fears pushed indices lower.
· Consumer Sentiment: The University of Michigan Consumer Sentiment Index for May 2025, released on May 14, 2025, likely showed continued weakness (April’s reading was 52.2, a multi-year low). If the May figure, reported yesterday, declined further, it could amplify concerns about reduced consumer spending, negatively impacting corporate earnings and pushing indices downward.
1.3. Concerns Over Federal Reserve Policy
· On May 7, 2025, Fed Chair Jerome Powell highlighted heightened economic risks, citing “elevated uncertainty” due to trade policies. Markets are pricing in 75 basis points of rate cuts for 2025, with the first cut expected in July.
· Trigger for May 15: If today’s PPI data or other economic indicators (e.g., Initial Jobless Claims, also due at 8:30 AM ET) point to persistent inflation or economic weakness, expectations for rate cuts could fade, increasing borrowing costs for companies and pressuring equity valuations. This scenario would mirror April 7, when recession fears and tariff impacts drove the S&P 500 below 5,000.
2. Technical Analysis
· The initial impulse move saw a decline of approximately -21.87%, with a second impulse of similar magnitude (marked on the chart). Currently, markets are aligned for a simultaneous decline across asset classes: oil, cryptocurrencies, and major indices like the S&P 500, Dow Jones, Nikkei, and others.
· Previous analysis concluded that this is a correction preceding a broader decline in indices, driven by trade wars, geopolitical conflicts, and U.S. economic indicators. I believe a recession is already underway.
Price Targets for S&P 500 Decline:
➖ Retest of the April 7, 2025, low: $4,803.00
➖ Secondary target: $4,716.00
3. Market Sentiment and Behavioral Factors
3.1. Fragile Optimism Post-Rally
· The S&P 500’s 22% rally from April lows and the Dow’s 15% recovery were driven by trade truce optimism and strength in technology stocks (e.g., Nvidia, Palantir). However, Bloomberg reported on May 14, 2025, that Wall Street’s rebound is “showing signs of exhaustion” due to trade war risks and fears of an economic slowdown. This fragility could lead to profit-taking today if negative news emerges.
· The Dow’s weakness on May 14 (down 0.6% compared to the S&P 500’s 0.7% gain) highlights vulnerabilities in specific sectors (e.g., healthcare following UnitedHealth’s 18% drop), which could spread to broader markets.
3.2. Global Market Correlation
· Asian markets, including the Nikkei, exhibited mixed performance on May 14, with China’s CSI 300 up slightly (+0.15%) and India’s Nifty 50 down 1.27%. If Asian markets open lower on May 15 due to overnight U.S. declines or trade-related news, it could create a feedback loop, intensifying global selling pressure.
4. Mini Evidence-Based Framework for the Forecast
4.1. Catalysts for Today’s Decline (May 15, 2025)
PPI Data (8:30 AM ET): A higher-than-expected PPI could signal persistent inflation, reducing the likelihood of Fed rate cuts and triggering a sell-off. Consensus anticipates a 0.2% monthly increase; a reading above 0.3% could be bearish.
Trade Talk Updates: Negative commentary from U.S. or Chinese officials (e.g., no deal reached in Geneva) could reignite trade war fears, mirroring the April 7 sell-off.
Initial Jobless Claims (8:30 AM ET): An unexpected rise in claims (e.g., above 220,000 compared to the prior fmadd211,000) could signal labor market weakness, amplifying recession fears.
4.2. Global Scenario for S&P 500
· I anticipate a wave-like decline with intermittent corrections. I wouldn’t be surprised if the S&P 500 falls below 4,700, potentially reaching 4,200. Extreme caution is warranted this year.
· There’s even a theory that, starting in 2025, the U.S. dollar could lose 50% of its purchasing power.
Idea:
4.3. Oil and Geopolitical Outlook
I expect oil (Brent) to decline to the $50+/- range, from which an upward trend may begin, potentially tied to future military conflicts:
· Europe vs. Russia
· India vs. Pakistan
· Iran vs. Israel
Stocks!
Nightly $SPY / $SPX Scenarios for May 15, 2025 🔮 Nightly AMEX:SPY / SP:SPX Scenarios for May 15, 2025 🔮
🌍 Market-Moving News 🌍
📊 Producer Price Index (PPI) Release Today
The Bureau of Labor Statistics will release the April PPI data at 8:30 AM ET. This report will provide insights into wholesale inflation trends, following the recent Consumer Price Index data that showed inflation easing to a four-year low.
🛍️ Walmart ( NYSE:WMT ) Earnings Report
Walmart is set to release its earnings today, offering a glimpse into consumer spending patterns amid ongoing economic uncertainties. Investors will be watching closely for any indications of how inflation and trade policies are impacting retail performance.
👟 Foot Locker Acquired by JD Sports ( NASDAQ:JD )
JD Sports has officially acquired Foot Locker ( NYSE:FL ) for $1.6 billion ($24 per share). The deal aims to consolidate market share in the sportswear and athletic retail sector, with JD expanding its U.S. footprint. Foot Locker shares surged 67% premarket following the news.
💻 Nvidia ( NASDAQ:NVDA ) Faces AI Export Rule Implementation
The U.S. government's AI Diffusion Rule comes into effect today, potentially restricting Nvidia's chip sales to certain foreign markets. This regulatory change could influence Nvidia's stock performance and has broader implications for the tech sector.
📊 Key Data Releases 📊
📅 Thursday, May 15:
8:30 AM ET: Producer Price Index (PPI) for April
10:00 AM ET: Manufacturing and Trade Inventories and Sales for March
⚠️ Disclaimer:
This information is for educational and informational purposes only and should not be construed as financial advice. Always consult a licensed financial advisor before making investment decisions.
📌 #trading #stockmarket #economy #news #trendtao #charting #technicalanalysis

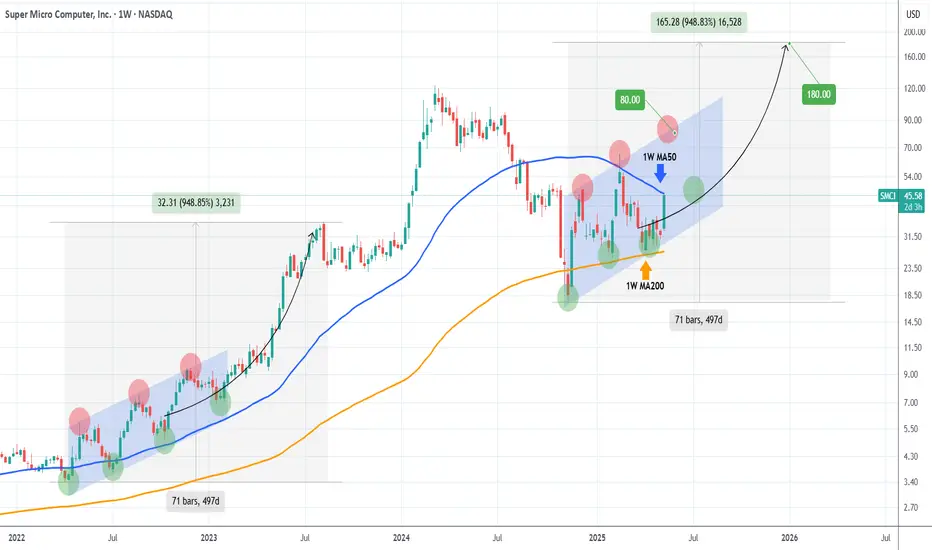
SMCI hit its 1W MA50, eyes a massive break-out.Super Micro Computer Inc (SMCI) has surged more than +15% today after the company announced a multi-year, $20 billion partnership with Saudi data center firm DataVolt.
Technically that brought it on its 1W MA50 (blue trend-line), the first contact with it since the week of February 18 2025, which was the previous Top. The current rally as well as the one that led to the Feb 18 Top, is fueled by the 1W MA200 (orange trend-line) which held as Support on both occasions.
The driving pattern behind those Bullish Legs is a Channel Up (blue) and this is not the first time SMCI comes across such formation. It was in fact a similar Channel Up that took the stock from the 2022 bottom of the Inflation Crisis and guided it to its new Bull Cycle. That rose by +950% before it pulled back on its first consolidation.
As a result, we have a short-term Target at $80.00 and after a pull-back, long-term Target at $180.00 (+950% from the bottom).
-------------------------------------------------------------------------------
** Please LIKE 👍, FOLLOW ✅, SHARE 🙌 and COMMENT ✍ if you enjoy this idea! Also share your ideas and charts in the comments section below! This is best way to keep it relevant, support us, keep the content here free and allow the idea to reach as many people as possible. **
-------------------------------------------------------------------------------
💸💸💸💸💸💸
👇 👇 👇 👇 👇 👇
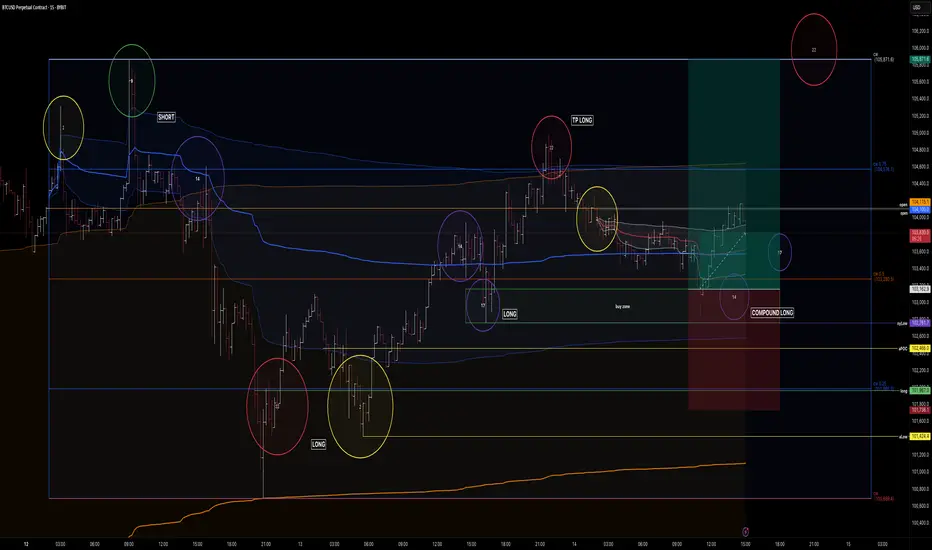
btc . wednesday . may . w3yesterday
. no LONG - only at bigger retracement - didnt come
. no SHORT - as 10pm (UTC+2) has recently been a little unpredictable
today - wednesday - LIQUIDITY + VOLATILITY ?!
. no SHORT - as we are nowhere price opportunity wise + BULLISH outlook
. yes COMPOUND LONG . I had wanted to see the drop towards 2pm (UTC+2) - run yesterdays NewYork low and push up . didnt happen, but as I was waiting for the level, I had limit orders prepared of which 4 triggered during LondonSession
. additional little compound now prepared at 103622 - LPOC + VWAP
- bullish continuation . price is consolidating and momentum of this week is turning to the upside
- bearish continuation . see a rejection here at dOpen + wOpen . have price loose its cwLow . catch everyone of guard (unlikely by the outlook, but neverless)
AAPL | Apple Stock | Three Drives Down PATTERNThe Three Drives / Three Dives Down pattern is usually short term bearish , but near term and long term bullish .
Previously, we saw a -32% correction. This time, it could be a little higher if we consider the previous neckline support:
The only way I see this paying out differently, is if the price captures the current resistance zone, and CLOSES above it:
__________________
NASDAQ:AAPL

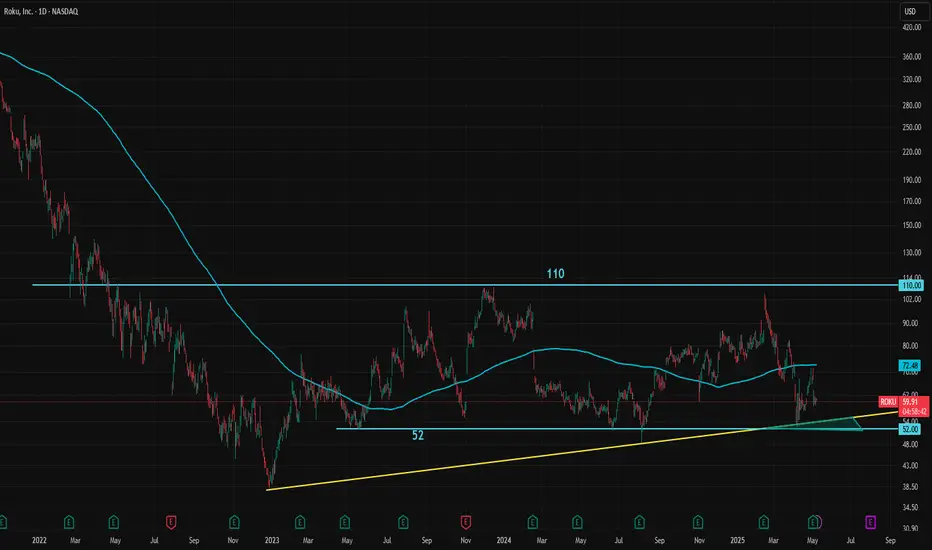
ROKU Close to Key Support After the Selloff Roku fell after its earnings report and updated guidance. Despite reporting EPS that beat expectations by 27.14%, Roku lowered its revenue guidance to $4.55 billion, down from the previous estimate of $4.61 billion. However, the sharp decline in price may present a buying opportunity for a medium-term swing trade.
Roku’s EPS is expected to turn positive in the third quarter, supported by increasing revenue in each quarter. The 12-month analyst consensus price target is $83.76, which is approximately 38% above the current price.
From a technical perspective, an ascending triangle formation appears to be developing at the bottom. While ascending triangles are typically continuation patterns, and rarely form at bottoms, it is still a positive sign for Roku. The lower line of the channel, which is near the 52 level and aligned with key horizontal support, can be viewed as solid support. As long as this support holds, an upward move toward the 200-day SMA and then to the 82.50 level is possible.
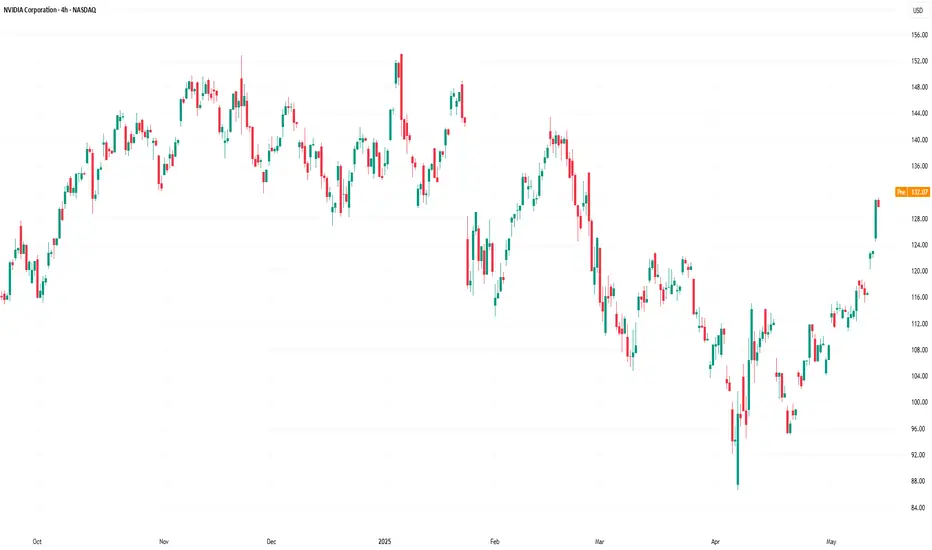
Nvidia (NVDA) Share Price Jumps Over 5%Nvidia (NVDA) Share Price Jumps Over 5%
Nvidia (NVDA) shares surged to the $130 mark yesterday – a level not seen since late February 2025. This strong rise, marked by a wide bullish candlestick, helped Nvidia reclaim its status as a company valued at over $3 trillion.
Why Nvidia (NVDA) Shares Are Rising
The bullish sentiment has been driven by several factors, including:
→ Price increases on products: Nvidia has raised prices on its graphics cards and data centre chips. The GeForce RTX 5090 has risen by more than 10%, while the RTX 50 series is up by 5–10%.
→ News of a major contract: The company will supply chips to an AI start-up backed by Saudi Arabia. In addition, media reports suggest that the US government is considering a deal allowing the UAE to purchase up to 500,000 Nvidia chips annually until 2027.
All of this could positively impact Nvidia’s revenue, encouraging investors to buy NVDA shares.
Technical Analysis of Nvidia (NVDA) Stock Chart
Yesterday’s sharp rally suggests a breakout from the descending channel (marked in red), which had remained in place since late last year.
The breakout occurred near the $123 level, which had previously acted as resistance. It is therefore possible that if there is a pullback in the NVDA stock price, this level could act as support (“breakout retest” pattern), confirming the breakdown of the descending channel and strengthening the outlook for further growth.
This article represents the opinion of the Companies operating under the FXOpen brand only. It is not to be construed as an offer, solicitation, or recommendation with respect to products and services provided by the Companies operating under the FXOpen brand, nor is it to be considered financial advice.
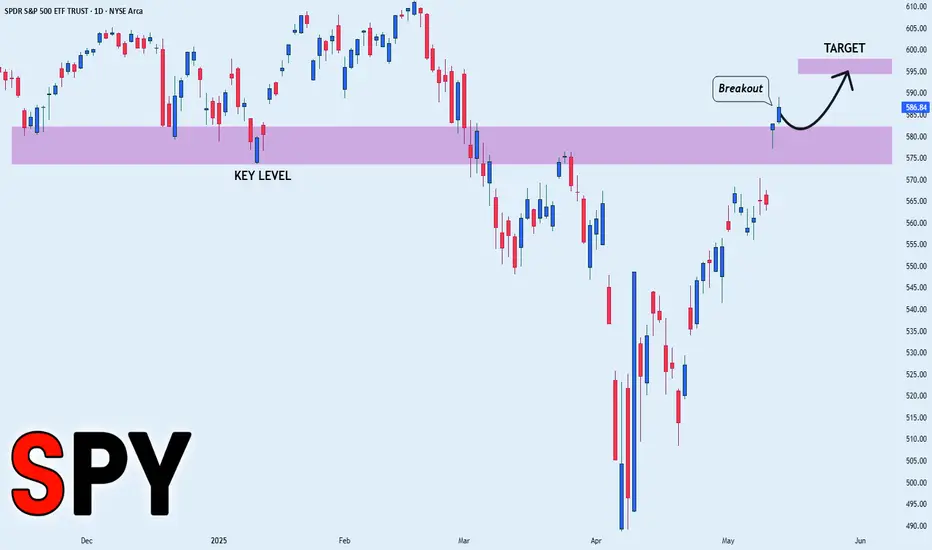
SPY BULLISH BREAKOUT|LONG|
✅SPY is trading in an
Uptrend and the index
Made a bullish breakout
Of the key horizontal level
Of 580.00$ and the breakout
Is confirmed so we will be
Expecting a further move up
LONG🚀
✅Like and subscribe to never miss a new idea!✅
Disclosure: I am part of Trade Nation's Influencer program and receive a monthly fee for using their TradingView charts in my analysis.
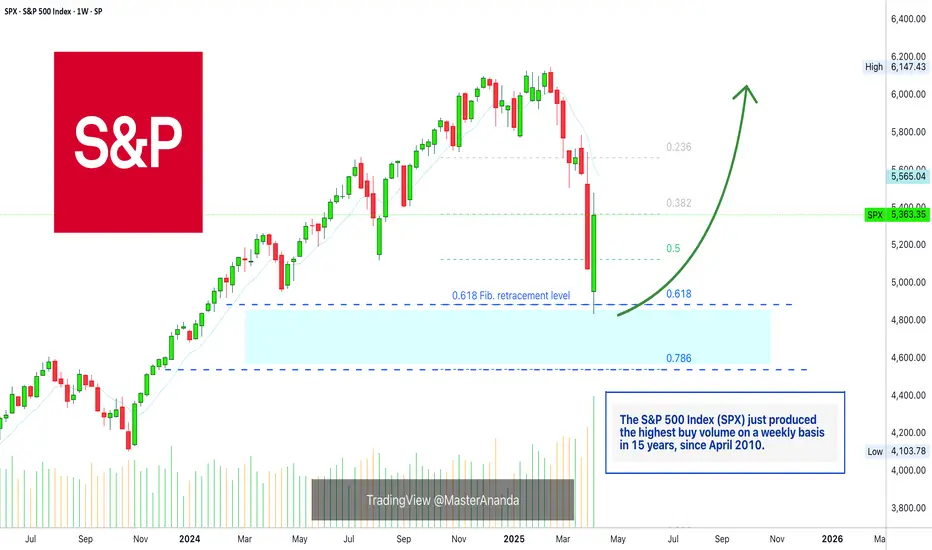
S&P 500 Index Most Bullish Signal In 15 YearsThis is why it is very clear, certain, that the stock market, the S&P 500 Index (SPX) is set to grow in the coming months. Last week produced the highest volume session, on the bullish side, since April/May 2010, that's 15 years. Back then, when this signal showed up, this index went to grow for years non-stop.
The SPX also produced the strongest weekly session in several decades, maybe the strongest week ever, and a bounce happened (support found) exactly at the 0.618 retracement Fib.
This is all we need to know. When the bulls enter the market and do so with force, it is because the market is set to grow. The correction produced decline of 21%. This is pretty standard. The fact that the correction happened really fast, it means that it will also have a fast end.
The low is in. The correction is over. The S&P 500 Index is set to grow.
You can be certain. If you have any doubts, just ask the chart.
Namaste.
Tesla Bullish, Let Me ExplainYesterday's high was the highest price since 4-March 2025, almost two months ago. The fact that TSLA moved out of bottom prices and strong long-term support zone while challenging resistance is a bullish signal.
The prices that were activated in Mach and April as support is the same range that TSLA used back in 2024 to launch the previous bullish wave. The same prices as in October and September 2024. The same levels were activated but as a higher low. Clearly a bullish dynamic.
For this setup to be bearish, the action would have to go lower and print a lower low compared to August 2024, this isn't the case. We have a strong higher low which means that buyers were eager to enter the market and waiting for this long-term support zone to be activated. As soon as it was activated buyers showed up and this is confirmed by current price action. Short-term, Tesla is moving up.
This is short-term because a new bullish wave is just now getting started but the fact is pointing towards additional growth.
Yesterday TSLA closed above EMA55 daily for the first after hitting support since October 2024. Once EMA55 gets challenged and conquered, we are looking at the least 2-3 months of bullish action. Don't get me wrong, there can be swings short-term, shakeouts and such but no new lows. The low has been set 7-April 2025, from this point on, we will see growth.
Once a strong resistance level is challenged, we can look at the chart and see if there will be a major correction or just a retrace before additional growth. The truth is that the stock market is set to go higher, TSLA is just one stock. The SPX, NVDA, Bitcoin and many other instruments will grow. Everything will grow.
Namaste.

Nightly $SPY / $SPX Scenarios for May 14, 2025🔮 Nightly AMEX:SPY / SP:SPX Scenarios for May 14, 2025 🔮
🌍 Market-Moving News 🌍
🇺🇸 U.S.-China Tariff Reductions Implemented Today
The U.S. and China are set to enact significant tariff reductions today, lowering U.S. tariffs on Chinese goods from 145% to 30% and China's tariffs on U.S. goods from 125% to 10%. This 90-day agreement aims to ease trade tensions and has already spurred a market rally, with the S&P 500 gaining 3.3% on Monday.
📉 Inflation Hits Four-Year Low
U.S. inflation eased to 2.3% in April, marking a four-year low. This unexpected decline has alleviated concerns about the impact of recent tariffs and may influence the Federal Reserve's monetary policy decisions.
📈 S&P 500 Turns Positive for 2025
The S&P 500 has erased its year-to-date losses, turning positive for 2025. This shift is attributed to easing inflation and the recent U.S.-China trade agreement, which have bolstered investor confidence.
💼 Nasdaq to List New ETFs
The Nasdaq Stock Market will begin listing three new Russell Investments ETFs today, expanding investment options for market participants.
📊 Key Data Releases 📊
📅 Wednesday, May 14:
5:15 AM ET: Speech by Fed Governor Christopher Waller
10:00 AM ET: Business Formation Statistics for April
⚠️ Disclaimer:
This information is for educational and informational purposes only and should not be construed as financial advice. Always consult a licensed financial advisor before making investment decisions.
📌 #trading #stockmarket #economy #news #trendtao #charting #technicalanalysis

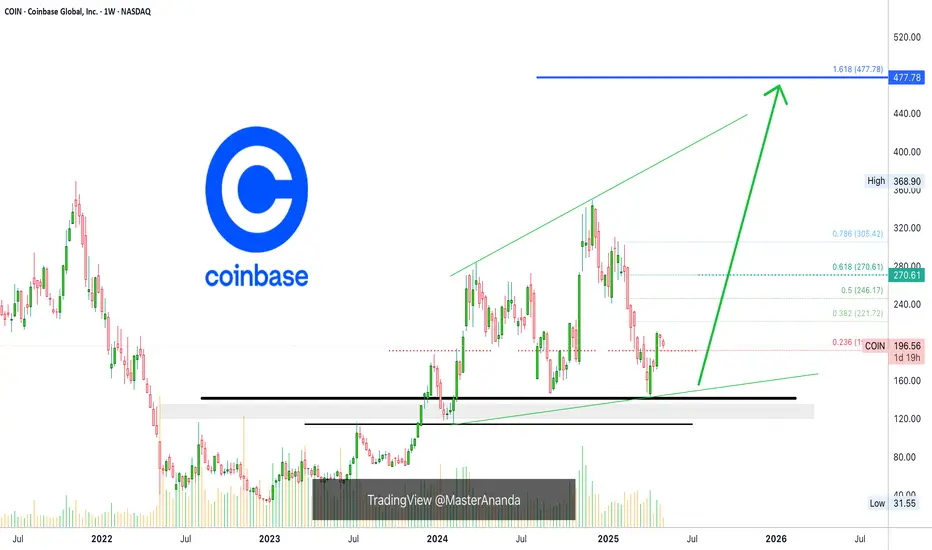
Coinbase New All-Time High Confirmed (477 & 685)Good yes Cryptocurrency Bitcoin trading profits up winning today more. How are you feeling in this wonderful bull market session prices going up strong?
I hope your day is great and that's the same for the chart above. Coinbase, COIN, wow; a new All-Time High coming within months do you have any doubts? I don't think so. Those with doubts are gone, all that is left is us, the buy and hold crew. Successful traders, investors, miners, reporters, hobbyist, holders and curious onlookers, we are winning with Bitcoin and Crypto and this stock... This stock is easy to read.
There are so many bullish signals that I will skip them all and go straight to the bottom point. New All-Time High coming next. It will take months but it will be months of growth, higher heights and higher highs and fast bullish strong momentum building up and growing like nothing you've seen before.
If you are a bear, I am sorry for you but you were warned.
If you are a bull, congratulations my dearest of friends because this is only the start. Everything grows. Everything that is related to Cryptocurrencies of course because Crypto is the future of finance. Bitcoin is the evolution of money. Digital gold.
— Technical analysis
After a strong correction, the COIN stock produced a classic reversal formation as a v shaped bottom at the end of a bearish move. This move is followed by two strong green candles and these candles pushed prices above the 0.236 Fib. extension level, setting the stock into a bullish zone.
After the second big green candle, there is a small retrace in the form of a red week. This is normal and shows consolidation before additional growth. This week is also red but not for long. The fact that COIN remains trading very high compared to the full green candle close means that bears are not present and the bulls are in control.
The chart shows long-term higher highs as well as higher lows.
The chart structure points to a new All-Time High happening very soon, within months. 3-6 months. 3 months for a new All-Time High and 6 months for a major peak. The whole flavor of this market is giving out clues of a cycle that will be big and extended long-term.
Coinbase can grow for longer than what you are prepared for.
The next All-Time High can happen around 477 but this wouldn't be the end of the bullish cycle and wave. I expect even higher targets, the next one being 685. Hold tight, the best is yet to come.
Thank you for reading.
Namaste.
COIN ~ Inverse Head & Shoulders Breakout -- Key Levels- Hello traders! COIN made a massive move today, breaking out of a beautiful Inverse Head & Shoulders pattern. So whats next?
- There are significant resistance levels approaching between $267 and $302 (including the Inverse H&S target level) which could potentially make for a good intraday short trade opportunity.
- Watch for a quick reversal from these levels in the coming days, if you're quick you may be able to catch a short trade.
- Theres no gaurantee that price will bounce from these levels, however this zone will certainly act as significant resistance in the short term.
~ Thanks everyone and best of luck in your trading journey!

RIVIAN Huge 1-year Triangle about to break. Trade the break-out.Rivian Automotive (RIVN) is trading within a 1-year Triangle pattern since the April 15 2024 Low. Right now the price is on the 1W MA100 (green trend-line), almost hitting the top (Lower Highs trend-line) of the pattern.
This is the second time ever that the 1W MA100 is tested, the previous on was on the last Lower High in late December 2024, giving slightly more probabilities for a bullish break-out above it.
If this is materialized, buy the break-out and target the 2.0 Fibonacci extension on the long-term at $26.50.
If it fails to break and instead is rejected back towards the Triangle's bottom, wait for a confirmed break of the Higher Lows trend-line and sell towards the -1.0 Fibonacci extension at $6.50.
-------------------------------------------------------------------------------
** Please LIKE 👍, FOLLOW ✅, SHARE 🙌 and COMMENT ✍ if you enjoy this idea! Also share your ideas and charts in the comments section below! This is best way to keep it relevant, support us, keep the content here free and allow the idea to reach as many people as possible. **
-------------------------------------------------------------------------------
💸💸💸💸💸💸
👇 👇 👇 👇 👇 👇

Gold has recently broke through the call entry!Market Analysis Update: Gold Price Movement
Gold has recently broken through the Call Entry (CE) level of the 1-hour Fair Value Gap (FVG), indicating a possible continuation of upward momentum in the short term. Based on current price action and technical indicators, we are expecting gold to continue moving higher. This move may potentially target the liquidity resting above previous swing highs, as traders' stop losses in those areas are likely to be triggered, fueling the upward trend.
Once this liquidity is cleared, there is a notable resistance zone marked in the 3270–3274 range, commonly referred to as the "black zone." This area is likely to act as a key decision point. If price reaches this zone and exhibits signs of bearish confirmation (such as rejection candles, divergence, or other reversal signals), there may be a potential selling opportunity from that level.
Additionally, it is worth noting that there is a trendline drawn below the current market structure, which may also attract price action. This trendline represents another area where liquidity might be collected before any significant directional move occurs.
Thank you for your attention to this analysis. If there is anything in the explanation that you find unclear or if you have questions about specific terms or concepts, feel free to ask for clarification.

US500 - Let the Bulls Strive!Hello TradingView Family / Fellow Traders. This is Richard, also known as theSignalyst.
📈US500 has been overall bullish trading within the rising channel marked in red.
Moreover, the blue zone is a strong support and structure!
🏹 Thus, the highlighted blue circle is a strong area to look for buy setups as it is the intersection of support and lower red trendline acting as a non-horizontal support.
📚 As per my trading style:
As #US500 approaches the blue circle zone, I will be looking for bullish reversal setups (like a double bottom pattern, trendline break , and so on...)
📚 Always follow your trading plan regarding entry, risk management, and trade management.
Good luck!
All Strategies Are Good; If Managed Properly!
~Rich
Disclosure: I am part of Trade Nation's Influencer program and receive a monthly fee for using their TradingView charts in my analysis.

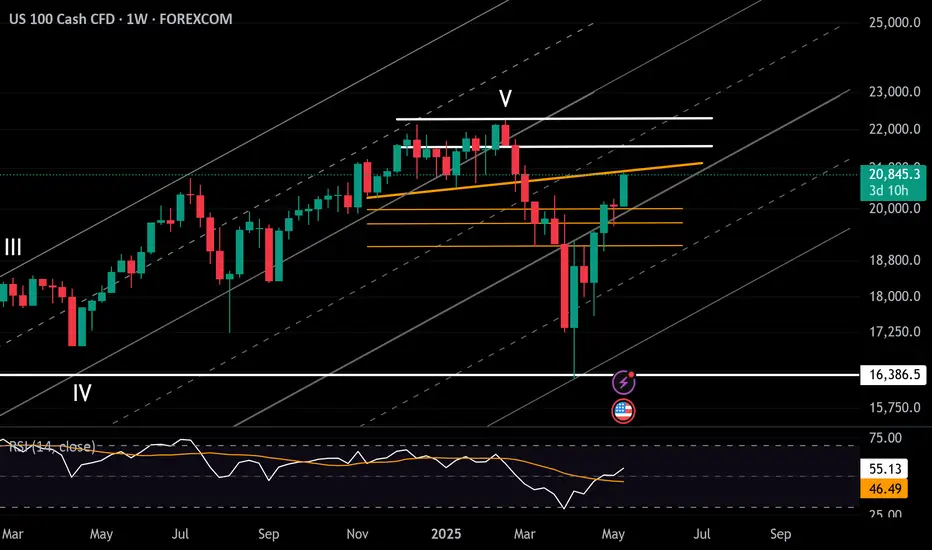
Nasdaq Tests Key 20,900 ResistanceAs shown in chart above, price action is hovering near the neckline of a well-defined double top pattern, formed between December 2024 and February 2025, similarly across the Dow and SPX500 charts.
This reinforces a key resistance zone that could either validate a more sustainable bullish outlook into 2025 — or trigger another correction if rejected.
Nasdaq Upside Scenario: A confirmed hold above 20,900 may extend gains toward 21,500, and 22,200.
Downside Scenario: A pullback below 20900 and 20,500 could find support at 20,200, 19,600, and 19,170, respectively.
Markets are currently holding on trade optimism, yet key economic reports are likely to test the narrative
Written by Razan Hilal, CMT
S&P500 Alert! Entering a medium-term SELL ZONE!The S&P500 index (SPX) has recovered the 0.786 Fibonacci retracement level, limiting the Trade War losses considerably. Trading this week above its 1W MA50 (blue trend-line), the index has confirmed that it resumed its long-term bullish trend.
On he medium-term though attention is needed as we're headed towards a range, which in the past 10 years has historically been an interim Sell Zone. That's the 0.786 - 0.9 Fibonacci range, which since the 2016 correction, it has always rejected the uptrend of a 1W MA200 (orange trend-line) led recovery.
On 3 out of 3 occasions so far (April 2016, June 2020, July 2023), every time the price tested the 0.9 Fib, it got rejected back to its 1W MA50 (blue trend-line). In 2023 the pull-back bottomed in 3 months but in 2020 and 2016 it took considerably less.
As a result, we call for caution near the 0.9 Fib for a potential medium-term pull-back but on the long-term the bullish trend is intact and historically it targets a minimum +27.74% from the All Time High (ATH), which is translated into a 7800 Target.
-------------------------------------------------------------------------------
** Please LIKE 👍, FOLLOW ✅, SHARE 🙌 and COMMENT ✍ if you enjoy this idea! Also share your ideas and charts in the comments section below! This is best way to keep it relevant, support us, keep the content here free and allow the idea to reach as many people as possible. **
-------------------------------------------------------------------------------
💸💸💸💸💸💸
👇 👇 👇 👇 👇 👇

DXY Rebound or Reversal? All Eyes on the Bearish OB Zone! Analysis:
As anticipated, DXY has now swept the major weekly/monthly sell-side liquidity (SSL) at 99.58, tapping deep into a high-probability reversal zone. This aggressive liquidity raid was followed by a sharp bullish reaction—marking the first signs of potential re-accumulation or a relief rally.
Currently, price is pushing back toward a bearish order block (OB) that aligns with a dense cluster of confluences:
A weekly FVG (Fair Value Gap)
A monthly FVG that’s been previously respected
Major supply resistance from previous highs around 108.40–109.39
This confluence zone is critical.
📍 Two Likely Scenarios:
Rejection from OB Zone: If price respects the OB, expect continuation to the downside—possibly targeting a deeper structural shift and breaking below the recent SSL.
Breakthrough & Reclaim: If price breaks and closes strongly above the OB zone, it opens the door for a move toward 114.60, the next major daily buy-side liquidity.
🧠 Either outcome offers a significant macro play, especially for risk-sensitive pairs (i.e., AUD, NZD, Gold, or equities inversely correlated to USD strength). Keep in mind, DXY's movement is heavily influenced by macroeconomic events, so dollar strength or weakness can cascade across global markets.
Key Levels to Watch:
Support: 100.215 / 99.58
Resistance: 108.40 → 109.39 OB zone
Upper Target if invalidated: 114.60
⚠️ DYOR. Let price confirm before bias is committed.

btc . tue . may . w3looking bullish. missed the SHORT on monday, was merely looking for a nice LONG entry to trade the 1 leg extension and new ATH's.
LONG
entry . 101967
tp1 . 104576
tp2 . 108462
( tp3 . 110800 - let the trade run )

Amazon (AMZN) shares jump more than 7%Amazon (AMZN) shares jump more than 7%
As shown in the Amazon (AMZN) share chart, the price surged by over 7% yesterday, breaking above the key psychological level of $200 and closing at its highest point since early March.
The sharp rise in demand was driven by reports of a trade truce between the US and China following talks in Geneva. According to Reuters, the US has decided to lower the “de minimis” threshold on goods from China. This move could help de-escalate a potentially damaging trade war between the world’s two largest economies. For AMZN stock, this is a bullish signal, as Amazon sells a wide range of low-cost Chinese goods.
Technical analysis of Amazon (AMZN) shares
From a bearish perspective, the AMZN price has recovered to the 0.618 Fibonacci retracement level after falling from an all-time high to the early April low. In this context, selling pressure may re-emerge with the intention of resuming the downtrend—especially as most oscillators on the chart are signalling strong overbought conditions.
From a bullish perspective:
→ The pattern of higher highs and higher lows in late April and early May may have outlined the median of an ascending channel;
→ Yesterday’s price surge in AMZN shares may point to the channel’s upper boundary.
Given these conditions, it is reasonable to expect a minor pullback before the Amazon’s stock price resumes its upward trajectory within the blue channel.
This article represents the opinion of the Companies operating under the FXOpen brand only. It is not to be construed as an offer, solicitation, or recommendation with respect to products and services provided by the Companies operating under the FXOpen brand, nor is it to be considered financial advice.

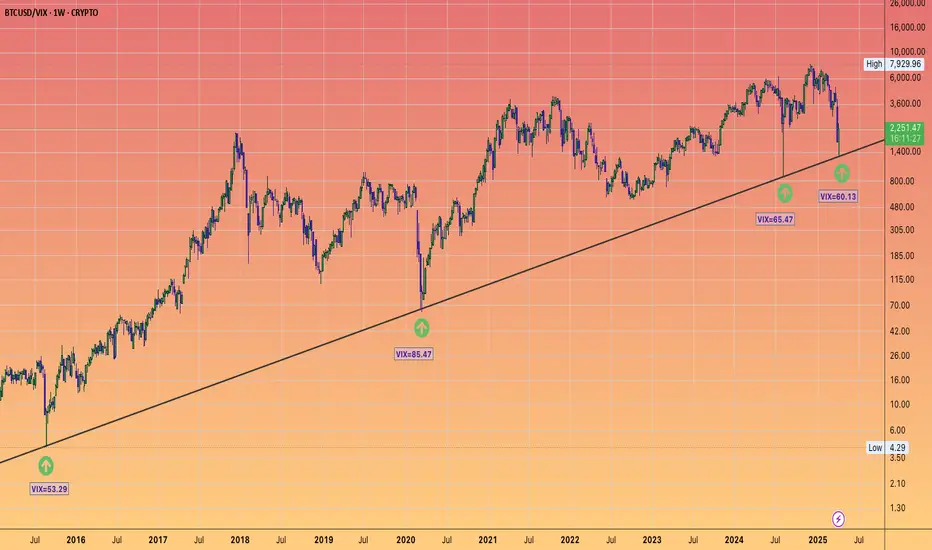
The last 4 previous Stockmarket Fear spikes were great buys...for Bitcoin, allowing investors to enhance their long-term holdings.
Purchasing risk assets when the #VIX exceeds 50 and over 20% of stocks fall below their 200-day moving average has consistently yielded positive returns, with a success rate of one hundred percent when evaluated one week, one month, and three months later.
This particular scenario has only happened 11 times in the history of the S&P 500, and the reading from Monday, April 7th, marked one of those rare instances.
#BTFD
UPS United Parcel Service Stock. Top stock to buy in 2025UPS United Parcel Service Stock. Top stock to buy in 2025 after reaching the strong monthly demand level. It took 50 months to reach it and now it's trying to play out as expected. Long-term longs for this American stock.
