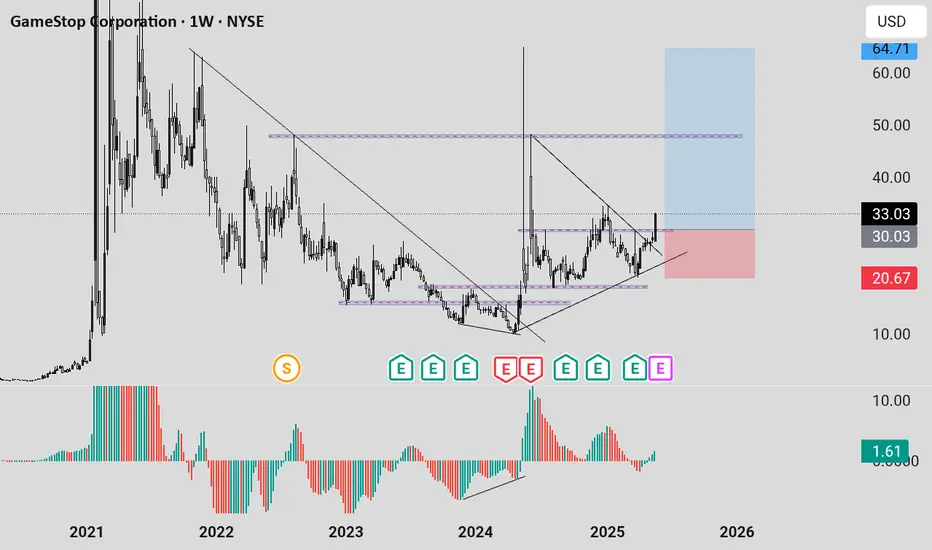
GME LONG IDEA GME has been in a downtrend for a while. The first signal for long was in April 2024 when price was in an oversold region and there was a divergence on the awesome oscillator. This was followed by a breakout of downtrend. From around 16, price went up to 64.
The current price action shows that price is about to rally up again. A weekly bullish candle closing above 30 is a good signal for a long. Price has broken out of a downtrend and support level, closing above these key levels is a good signal to target the high. An aggressive trader or investor may buy at a current price. While a conservative trader may wait for price to close and buy the following week or wait for price to retrace to the support level before placing the buy. To spread risk, one can buy at the current price, add more positions when price retraces to the key level. This will save from missing out and also balance the risk.
Entry could be at current price or 30 while the target can be 48 or 65.
The confluences for the buy are as follows:
1. Downtrend breakout with a weekly bullish candle closing above it.
2. Price respecting uptrend
3. Awesome oscillator resuming bullish momentum
4. Price breaking out of support level.
Disclaimer: this is not a financial advice. The outcome maybe different from the projection. If you can't accept the risk, don't take the signal.
Stocks
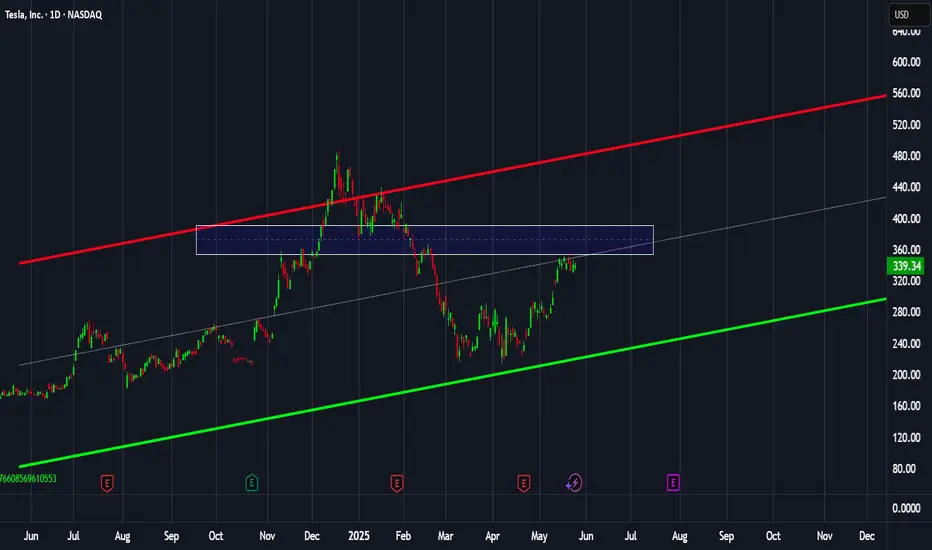
TSLA: Not recommended by me!Hello Traders,
TSLA Tesla fundamental score is not really good for me! My score is based on EPS data and EPS forecasts. there might be better stocks out there!
Regarding the technical aspects, White it reacted to the bottom of the channel median of the channel might be a small struggle. There is a strong possible resistance on the way up. I prefer to give a better/safer score after breaking this zone. Also, if we just consider technical analysis, any long options should have a SL, the possible rational SL is so far from the current price. in case of correction or breaking the zone, the possible SL could be very tighter.
Fundamental: Not recommended.
Technical: So-So.
Overall: I don't buy
Nasdaq and Indexes Week 22 BiasWhile the Indexes maitain a Bullish perspective on Weekly right now, I would not dare to anticipate next week "Flavour" but rather wait for The New Week Opening and if necessary till FOMC Minutes on Wednesday.
I would like to see immediate rejection from where price it's right now (allowing it to reach the IFVG starting at 20,690.00) to maintain a bullish bias rather then a deeper retrace, otherwise Bias may change on a Daily basis and pause that Weekly View for a later time .
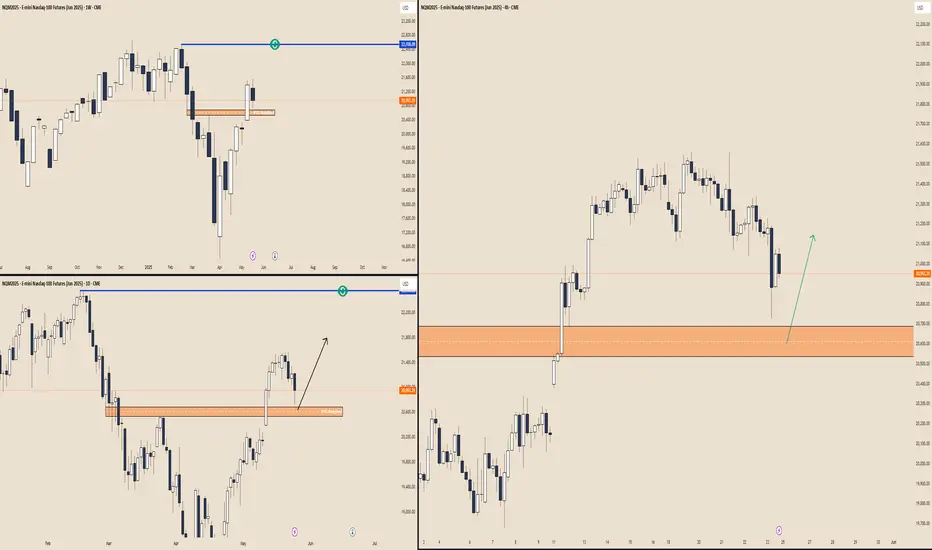
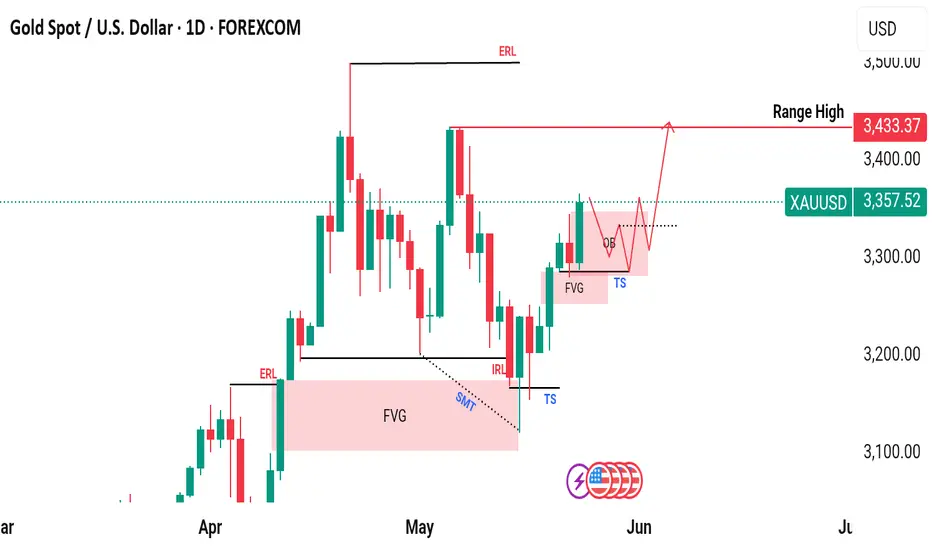
We've observed the formation of an Order Block(OB)Gold Market Daily Timeframe Analysis
The gold market, on the daily timeframe, is currently exhibiting price action consistent with an IRL (Internal Range Liquidity) to ERL (External Range Liquidity) model. Price has swept the IRL and then moved upward by tapping into a Fair Value Gap (FVG). This price action suggests a smart money liquidity grab followed by a reaction to an imbalance.
Subsequently, the market formed another FVG and executed a tap once more after taking out the initial target structure (TS), continuing its bullish move. Recently, we’ve observed the formation of an Order Block (OB), indicating a potential area where institutional orders may reside.
It’s expected that price might return to this OB, and if a Market Structure Shift (MSS) is confirmed on lower timeframes, there could be a strong bullish continuation. In such a case, we may witness the market reaching towards the $3430 level in the coming days.
It’s essential to monitor how the market reacts to these key zones especially the OB and the surrounding liquidity structures. Such movements could provide confirmation or invalidation of the projected move.
As always, this is a personal market perspective based on price action and liquidity concepts. Please conduct your own research (DYOR). This is not financial advice.
And by the way what are your thoughts on this analysis? Does it align with your outlook?
Heikin Ashi VS Regular candlesticks - EducationalNASDAQ:AMZN
Everything is explained in the video.
I hope you will find it very educational and test it. Those who trade stocks will probably switch to Heikin Ashi :)
Thank you!

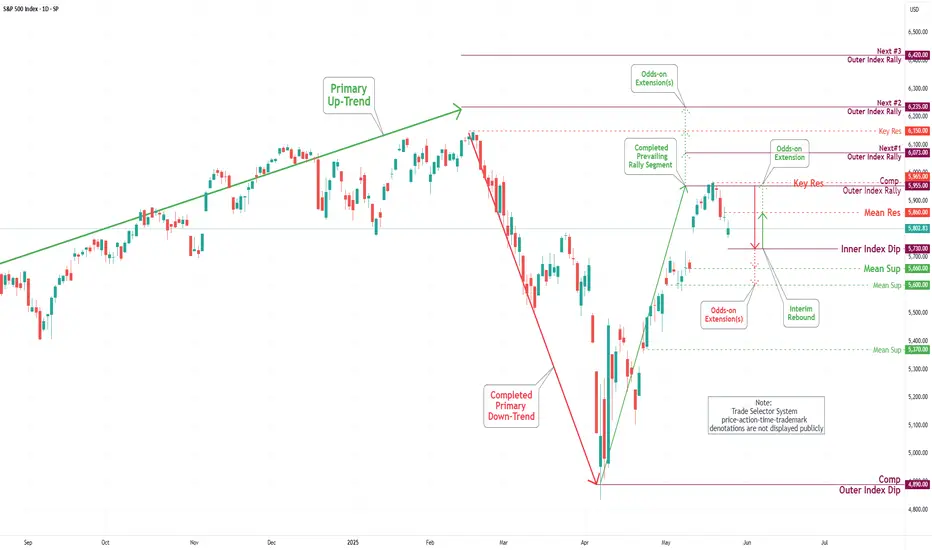
S&P 500 Daily Chart Analysis For Week of May 23, 2025Technical Analysis and Outlook:
The S&P 500 Index demonstrated a consistent downward trend during this week's trading session, reaching a significant target at the Mean Support level 5828. The index is currently trending lower, targeting the Inner Index Dip at 5730, with additional marks identified at the Mean Support levels of 5660 and 5600. Conversely, the index has the potential to rebound from its present position, advancing toward the Mean Resistance level of 5860 and retesting the previously completed Outer Index Rally at 5955.
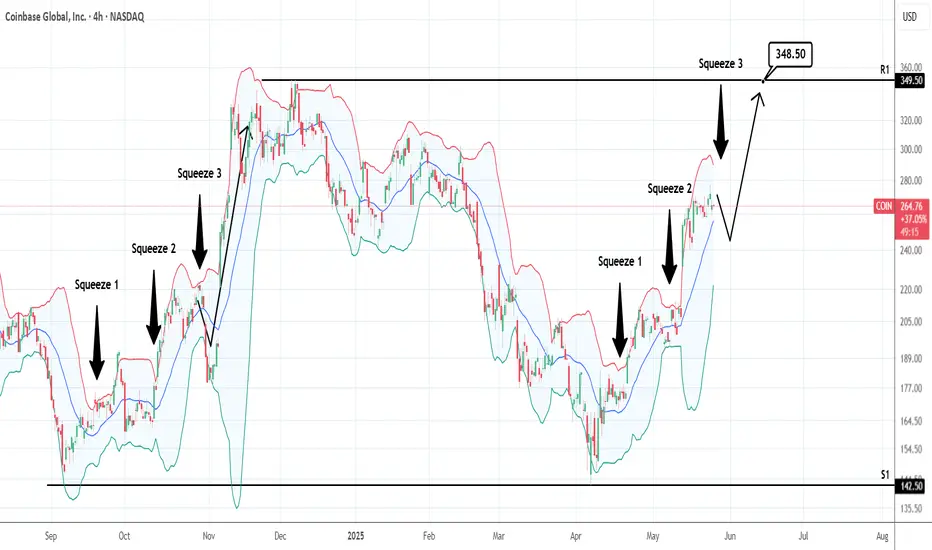
COINBASE: 3rd Bollinger Squeeze is a pullback buy signalCoinbase is bullish on its 1D technical outlook (RSI = 65.834, MACD = 21.140, ADX = 19.909) as it is extending the bullish wave following the S1 rebound. The Bollindger Bands are now expriencing a squeeze, which is the 3rd since the bottom. The 2024 bullish wave also had three Bollinger Squeezes with the 3rd being the last that made the 349.50 High but not before a pullback to the Bollinger bottom. If that takes place, it will be a signal to go even stronger on the bullish side and target the R1 level (TP = 348.50).
## If you like our free content follow our profile to get more daily ideas. ##
## Comments and likes are greatly appreciated. ##
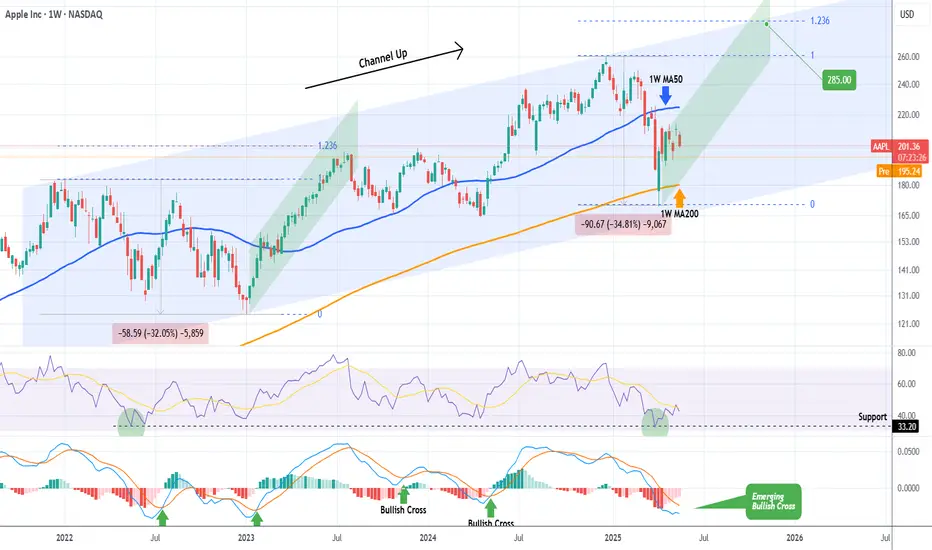
APPLE Down -4% premarket on Trump's 25% Tariff. Buy opportunity?Apple Inc. (AAPL) is down -4% on pre-market trading following a warning by U.S. President Donald Trump that the company would have to pay a 25% tariff if phones sold in the U.S. were not made within its borders.
Along with a proposed 50% Tariff on goods from the European Union starting on June 01, these news have inflicted fear again in the markets following 6 weeks of a relief rebound on trade deal talks.
So are these announcements a dip buy opportunity for Apple or round 2 of correction?
Based on the stock's long-term pattern, which is a Channel Up, the recent rebound on the 1W MA200 (orange trend-line) is technically the start of its 2nd Bullish Leg. With the Bearish Legs having similar declines (-35% and -32% respectively), we can expect the Bullish Legs to have a proportional rise as well.
On top of that, the 1W RSI rebounded on its multi-year Support, while the 1W MACD is about to form a Bullish Cross.
As a result, since the 2023 Bullish Leg that was complete on July 17 2023 almost touched the 1.236 Fibonacci extension, we expect the price to disregard the news and continue rising up to the new 1.236 Fib and target $285.00.
-------------------------------------------------------------------------------
** Please LIKE 👍, FOLLOW ✅, SHARE 🙌 and COMMENT ✍ if you enjoy this idea! Also share your ideas and charts in the comments section below! This is best way to keep it relevant, support us, keep the content here free and allow the idea to reach as many people as possible. **
-------------------------------------------------------------------------------
💸💸💸💸💸💸
👇 👇 👇 👇 👇 👇
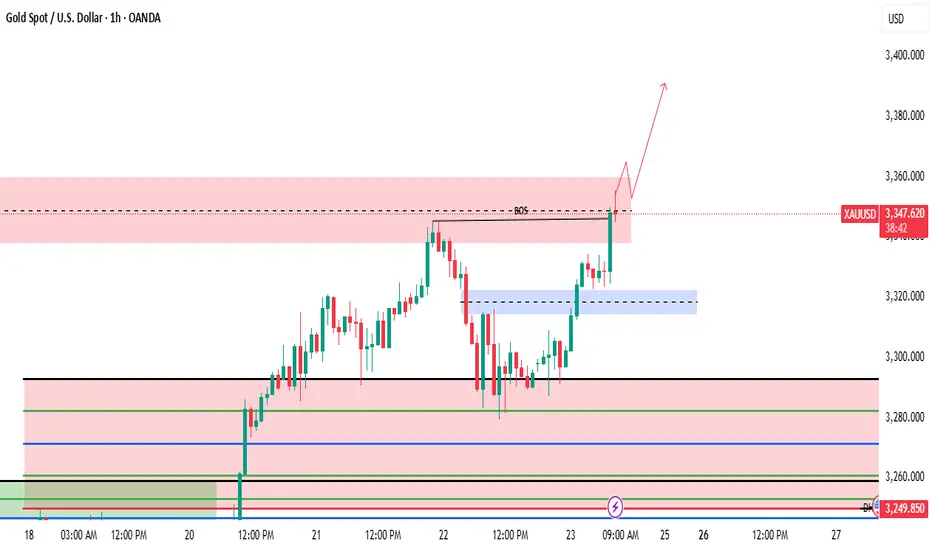
$3350 would indicate short-term strengthGold Price Analysis – Technical Outlook
Gold is currently approaching a critical resistance level around 3350. If the price manages to break and close above this level on the 15-minute chart, it could signal the continuation of the bullish trend. A confirmed 15-minute candle close above 3350 would indicate short-term strength and increased buying pressure.
To strengthen this bullish bias, we are also watching for a Break of Structure (BOS) on the 1-hour timeframe. A BOS would suggest a shift in market structure, potentially transitioning from a consolidation or retracement phase into a new impulsive leg to the upside.
If both conditions – the 15M candle close above 3350 and a 1H BOS – are met, the next immediate target would be 3370. Depending on how the price action unfolds beyond that point, and supported by additional confirmations such as volume, momentum indicators, or price patterns, there could be further upside potential.
As always, ensure you apply risk management and conduct your own thorough analysis before making any trading decisions.
Disclaimer: This is not financial advice. Please do your own research (DYOR).
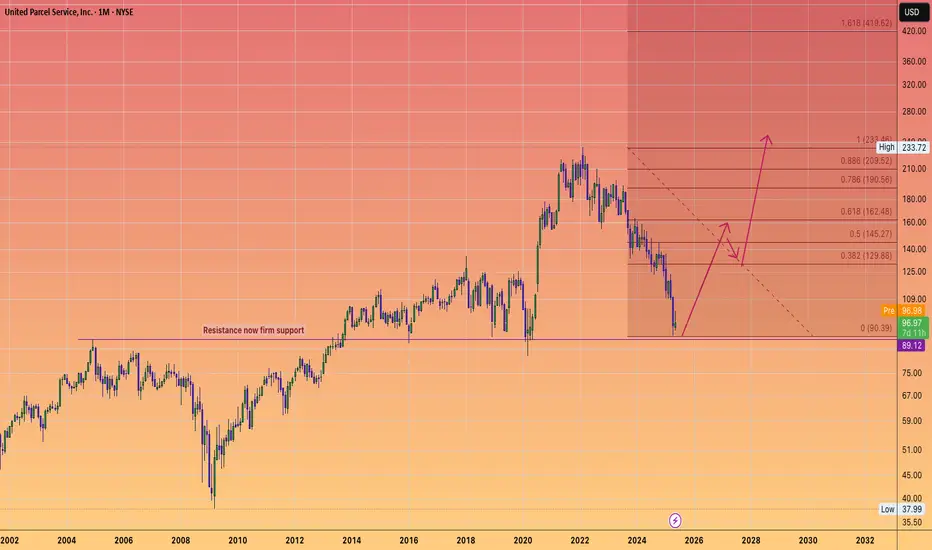
Things are looking UPSUnited Parcel Service served as one of our canaries in the coal mine, signalling that the real economy was much weaker than what the Biden administration was reporting. The figures presented were positively skewed, masking the harsh reality that we were all facing difficult times.
We recognized the head and shoulders topping pattern and warned that an economic disaster was approaching us. This ultimately led to the Trump tariff panic that caused the collapse of equities.
The thesis indicated a lack of confirmation regarding rising index prices; however, consumers were feeling the pressure, which manifested in reduced consumption and, consequently, fewer deliveries.
A modern Dow Theory if you will.
As we near new peaks in the stock market, I am convinced that our economy is on a much more solid foundation, poised to benefit Main Street instead of just a handful of monopolistic tech giants. Since equities are forward-looking, stocks are anticipating an exhilarating 2026!
I believe UPS will confirm this economic recovery as we head towards my long anticipated and forecast DOW JONES price of 64,000 likely by 2030.
Eli Lilly Stock Down 10.9% Over Past YearTop or Consolidation? Here's My Take...
It's not crystal clear — I can see the case for both. But after years of chart-watching, this doesn't quite look like a top to me:
• Lacks symmetry
• Had chances to break down, but no real follow-through
🧭 Where are we headed?
I think pressure remains, and we could dip toward the 50% retracement of the 2023 move — that’s around 646.
🔁 If we bounce from there, I’ll shift my bias to a recovery and resumption of the long-term uptrend.
Disclaimer:
The information posted on Trading View is for informative purposes and is not intended to constitute advice in any form, including but not limited to investment, accounting, tax, legal or regulatory advice. The information therefore has no regard to the specific investment objectives, financial situation or particular needs of any specific recipient. Opinions expressed are our current opinions as of the date appearing on Trading View only. All illustrations, forecasts or hypothetical data are for illustrative purposes only. The Society of Technical Analysts Ltd does not make representation that the information provided is appropriate for use in all jurisdictions or by all Investors or other potential Investors. Parties are therefore responsible for compliance with applicable local laws and regulations. The Society of Technical Analysts will not be held liable for any loss or damage resulting directly or indirectly from the use of any information on this site.

Palantir Technologies (PLTR) Shares Pull Back from Another HighPalantir Technologies (PLTR) Shares Pull Back from Another High
Shares in Palantir Technologies (PLTR), a company specialising in big data analytics software, have seen phenomenal growth in 2024, surging by approximately 340%, making it the top performer in the S&P 500 (US SPX 500 mini on FXOpen). This exceptional performance was driven by booming demand for artificial intelligence (AI) and machine learning technologies, which underpin Palantir’s products. The company has demonstrated steady growth in revenue and profitability, attracting major new clients across both the commercial and government sectors.
In 2025, PLTR remains among the market leaders, with its share price up roughly 60% year-to-date. In mid-May, it hit a fresh record high on the back of a strong fundamental backdrop. That backdrop was bolstered yesterday by news that the Pentagon had increased funding for its Maven Smart System programme — which involves deploying AI on the battlefield — to $1.3 billion through to 2029.
However, this news did not result in a new high. In fact, this week, PLTR stock have underperformed the broader stock market — and this may be explained by technical analysis.
Technical Analysis of the PLTR Chart
The interplay of supply and demand in 2025 has formed a broad ascending channel, characterised by:
→ The price breaking above the upper boundary in February following a strong earnings report, and dipping below the lower boundary in response to Donald Trump’s announcement of new international trade tariffs.
→ In mid-May (as shown by the arrow), the median line acted as support. However, after reaching the upper boundary, bullish momentum faded. As a result, the PLTR price has failed to hold recent highs and has fallen back below $130 — with market participants seemingly viewing the stock as overvalued, evidenced by false breakouts above previous peaks.
Given the above, it is reasonable to assume that PLTR may undergo a deeper pullback — potentially towards the median of the channel or even its lower boundary.
This article represents the opinion of the Companies operating under the FXOpen brand only. It is not to be construed as an offer, solicitation, or recommendation with respect to products and services provided by the Companies operating under the FXOpen brand, nor is it to be considered financial advice.

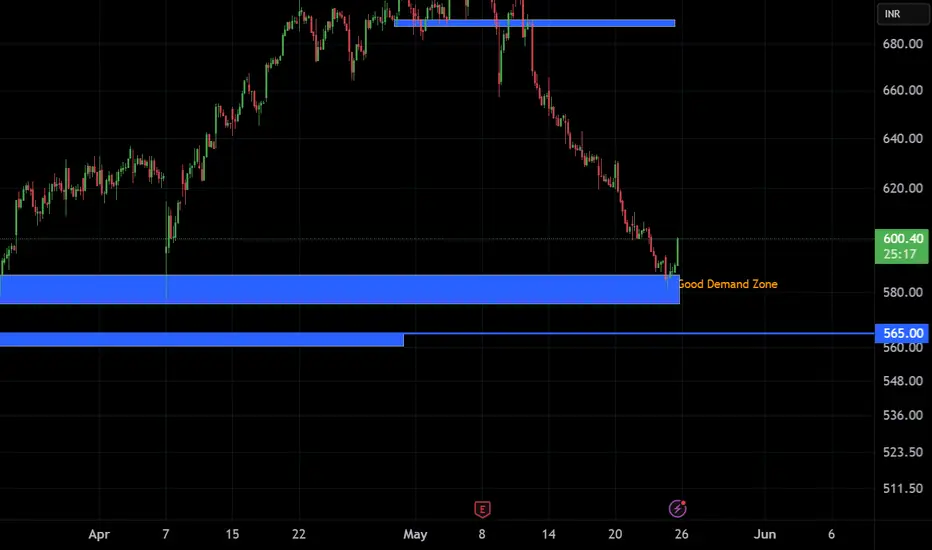
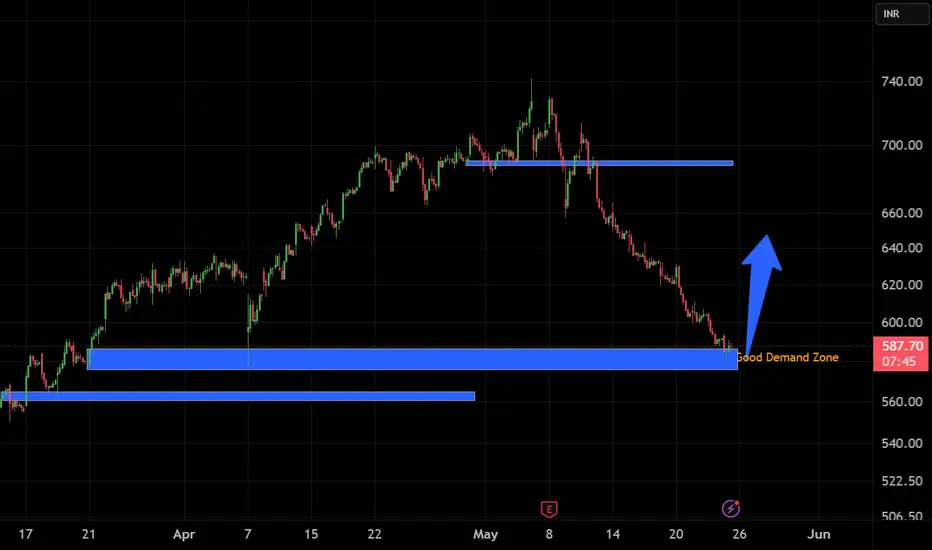
CHAMBLEFERT IDEAChamblfert looks like at a good demand zone. Expecting good one time bounce from this area and one green candle after long rail of back to back red candles.
Core Scientific (CORZ) – Mining Bitcoin to Powering AICompany Snapshot:
Core Scientific NASDAQ:CORZ is evolving from a crypto miner into a high-density colocation provider, strategically pivoting into the explosive AI infrastructure space.
Key Catalysts:
Strategic Shift to AI Infrastructure 🧠📡
$1.2B agreement with CoreWeave expands AI compute colocation footprint
Signals institutional validation of CORZ’s infrastructure capabilities
Massive Power Footprint ⚡
1,300 MW capacity across North America
Ideal for power-hungry AI training and inference workloads
AI & HPC Market Tailwinds 🚀
AI infrastructure demand is surging; CORZ is positioned as a first-mover
Colocation demand outpacing supply = pricing power & revenue upside
Transformation Narrative 📈
Transitioning from volatile crypto dependence to stable, high-margin AI hosting
Increased diversification and enterprise appeal
Investment Outlook:
✅ Bullish Above: $8.75–$9.00
🚀 Upside Target: $15.00–$16.00
📈 Growth Drivers: Strategic AI pivot, large-scale power assets, and long-term demand for compute
💡 Core Scientific – No longer just mining blocks, now powering breakthroughs. #CORZ #AIInfrastructure #DigitalTransformation

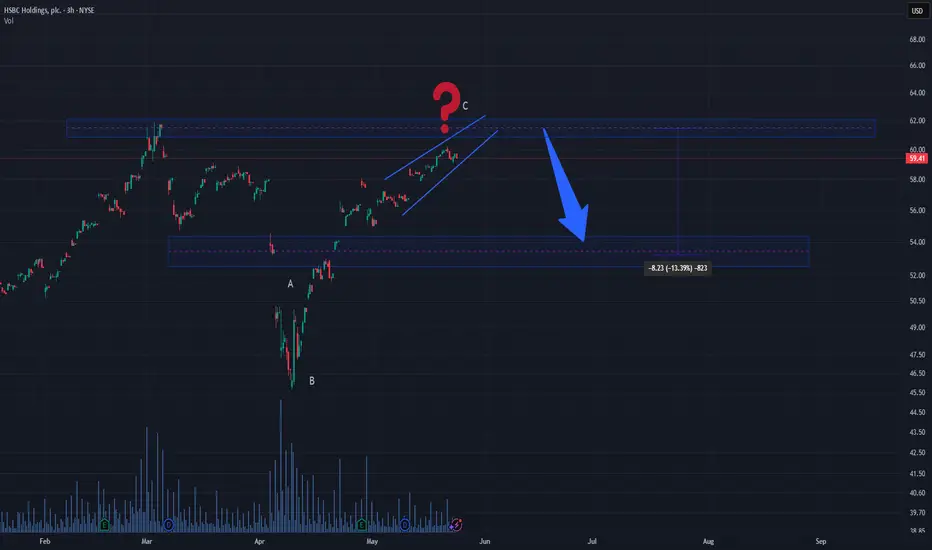
HSBC (HSBC) – $54 Risk Zone if ABC Correction Is Triggered HSBCHSBC is currently trading within a rising wedge, but a potential short-term drop of approximately 5% could trigger a full ABC correction pattern. This scenario is not confirmed yet, as the chart remains structurally bullish.
However, should the price reverse and break below the rising channel, it would likely mark the start of wave C, completing an A-B-C corrective sequence. This development could lead the price toward the $54 support zone, which aligns with a previous demand area.
While there is no immediate breakdown or weakness, traders should remain alert. A simple -5% drop might be all it takes to activate the next phase of correction.
Pattern: Potential ABC correction
Trigger: 5% decline from current levels
Target: $54
Bias: Neutral – watch for reaction if price softens
Nightly $SPY / $SPX Scenarios for May 23, 2025 🔮 Nightly AMEX:SPY / SP:SPX Scenarios for May 23, 2025 🔮
🌍 Market-Moving News 🌍
🇬🇧 Global Bond Yields Signal Rising Term Premium
Long-dated government bond yields in the U.S., U.K., and Japan surged, with the U.S. 30-year Treasury yield touching 5.09%, as investors demand higher compensation for locking in funds amid mounting debt and inflation risks
🏗️ Komatsu Sees Tariff Relief
Komatsu’s CEO says a recent U.S.–China trade truce may cut the company’s tariff hit by $140 million, easing cost pressures on its U.S. operations and brightening machinery sector outlook
📉 U.S. Stocks End Flat as Yields Ease
Wall Street closed little changed, with the S&P 500 and Dow finishing flat and the Nasdaq up 0.3%, after Treasury yields retreated slightly following recent spikes
📊 Key Data Releases 📊
📅 Friday, May 23:
🏠 New Home Sales (10:00 AM ET)
Reports the number of newly signed contracts for single-family homes, a direct gauge of housing demand and consumer confidence.
⚠️ Disclaimer:
This information is for educational and informational purposes only and should not be construed as financial advice. Always consult a licensed financial advisor before making investment decisions.
📌 #trading #stockmarket #economy #news #trendtao #charting #technicalanalysis

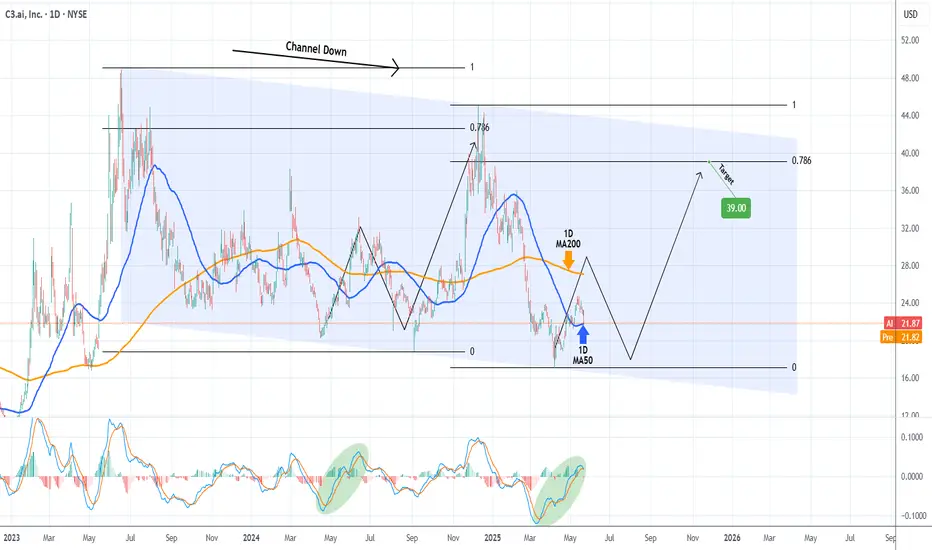
C3.AI has bottomed and is targeting $39.00C3.ai (AI) has been trading within a Channel Down pattern since the June 16 2023 High and right now is testing its 1D MA50 (blue trend-line) as Support, following a bottom (Lower Lows) rebound on April 08 2025.
This is technically the start of its new Bullish Leg, even though based on May - August 2024, it may be delayed. On the long-term though, our Target will be the 0.786 Fibonacci retracement level at $39.00.
-------------------------------------------------------------------------------
** Please LIKE 👍, FOLLOW ✅, SHARE 🙌 and COMMENT ✍ if you enjoy this idea! Also share your ideas and charts in the comments section below! This is best way to keep it relevant, support us, keep the content here free and allow the idea to reach as many people as possible. **
-------------------------------------------------------------------------------
💸💸💸💸💸💸
👇 👇 👇 👇 👇 👇
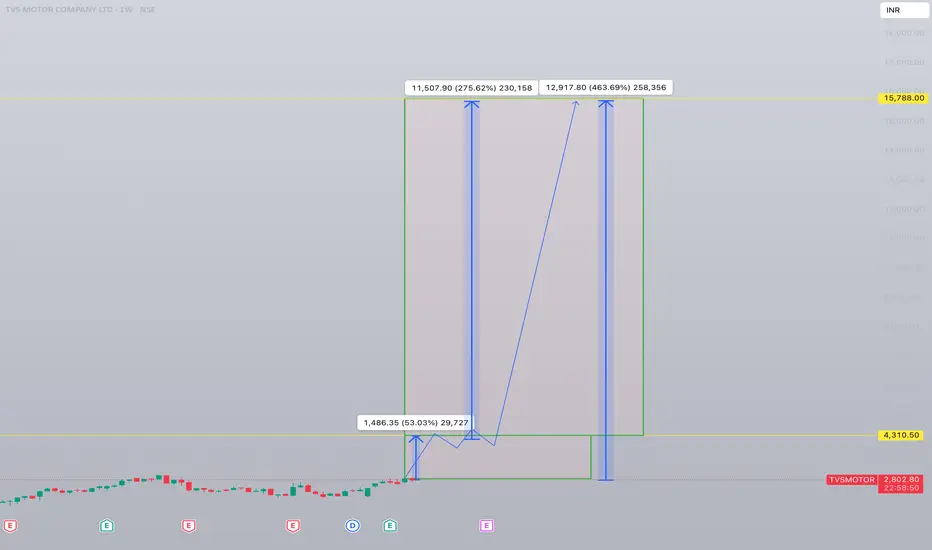
+460% potential profit with TVS MotorThis is my pick for buy&hold in 2025 in NSE India. A part of Nifty Auto Index which will drive its growth and lead the sector.
Strong chart from all angles. This is published as demo of what is available on my social media. You can find more through links in my profile.
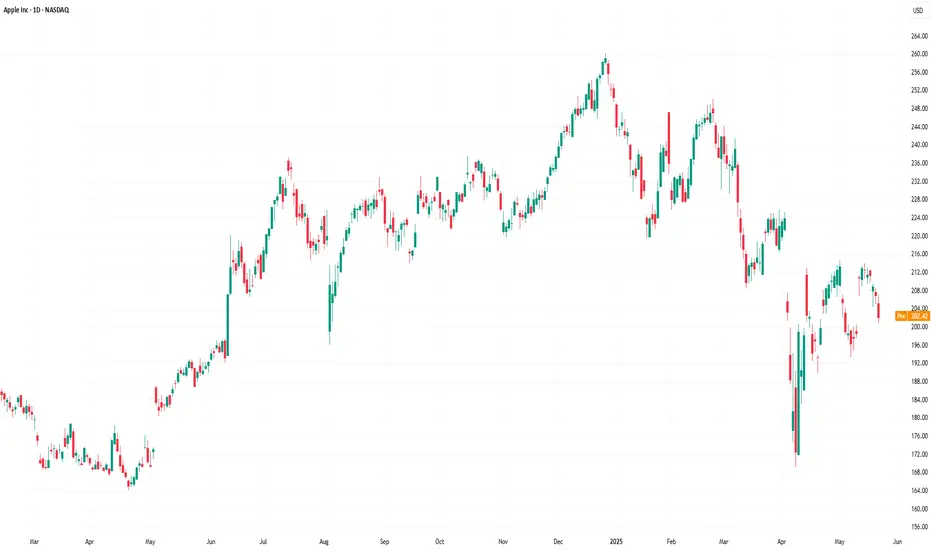
Apple (AAPL) share price slips towards psychological $200 levelApple (AAPL) share price slips towards psychological $200 level
Yesterday, Apple shares (AAPL) fell by 2.5%, edging closer to the key psychological threshold of $200. Moreover, the stock is underperforming the broader market, which reached new highs earlier this week — a move AAPL has yet to replicate.
Why is AAPL’s stock price declining?
According to media reports, investors may have grown concerned after OpenAI acquired a startup founded by Jony Ive, Apple’s former chief designer, for $6.5 billion.
The move is being interpreted as OpenAI’s first step toward launching a physical AI-powered device — one that could, eventually, pose a challenge to Apple’s hardware, even if not in the near term.
Technical analysis of the AAPL chart
Bulls may be hoping the AAPL price finds support at the confluence of two key levels:
→ the psychological $200 mark;
→ support from the second half of May (the lower blue trendline).
However, the broader technical context raises some bearish concerns:
→ the $215–222 zone, which previously acted as support, is now capping price advances (as highlighted by the arrows);
→ the red descending channel appears to define the current trend trajectory — and its relevance may be reinforced if the price drops and consolidates near its median line, signalling a balance between buying and selling pressure.
This article represents the opinion of the Companies operating under the FXOpen brand only. It is not to be construed as an offer, solicitation, or recommendation with respect to products and services provided by the Companies operating under the FXOpen brand, nor is it to be considered financial advice.
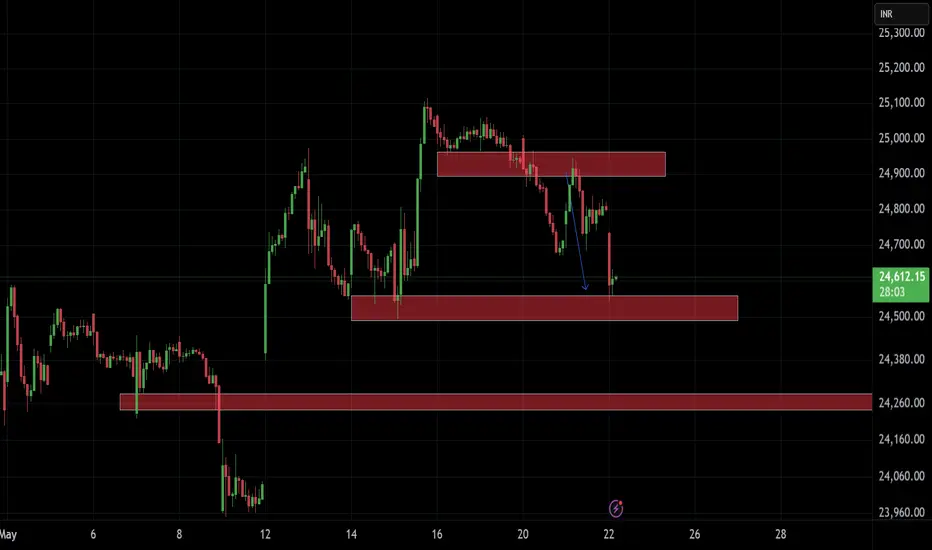
NIFTYI see these levels on Nifty. Forgot to paste the good shorting trade opportunity yesterday, however shared 2 charts with analysis of gift nifty which hinted short for market from past 2 days. Don't go into patterns and take early trades trade only when levels break or sustain.
Nightly $SPY / $SPX Scenarios for May 22, 2025 🔮 Nightly AMEX:SPY / SP:SPX Scenarios for May 22, 2025 🔮
🌍 Market-Moving News 🌍
📈 Treasury Yields Surge Amid Weak Bond Auction
U.S. Treasury yields continued their upward trajectory, with the 10-year yield nearing 4.6% and the 30-year yield surpassing 5%, marking the highest levels since early 2023. This increase followed a weak $16 billion auction of 20-year bonds, which attracted less investor demand and sold at higher-than-expected yields. Factors contributing to the rise include fading recession fears, persistent inflation concerns, and growing fiscal worries related to potential tax cut extensions.
📉 Stock Market Declines as Tech Stocks Retreat
The stock market experienced significant losses, with the Dow Jones Industrial Average dropping 1.9%, falling below its 200-day moving average. The S&P 500 and Nasdaq fell 1.6% and 1.4%, respectively.
💼 Snowflake ( NYSE:SNOW ) Reports Strong Earnings
Snowflake Inc. reported record quarterly revenue of $1.04 billion, surpassing expectations. Product revenue increased 26% year-over-year to $996.8 million. The company raised its full-year forecast to $4.325 billion, reflecting a 25% year-over-year increase. Despite a GAAP net loss of $430 million, Snowflake posted an adjusted profit of 24 cents per share, exceeding the 21-cent estimate.
📊 Morgan Stanley Turns Bullish on U.S. Stocks
Morgan Stanley has shifted to a bullish stance on U.S. stocks and bonds, raising its outlook due to signs of market stabilization and improving growth conditions. The bank maintains a base target of 6,500 for the S&P 500 by mid-2026, with a bullish scenario projecting 7,200.
📊 Key Data Releases 📊
📅 Thursday, May 22:
8:30 AM ET: Initial Jobless Claims
9:45 AM ET: S&P Global Flash U.S. Services PMI for May
10:00 AM ET: Advance Services Report (First Quarter 2025)
⚠️ Disclaimer:
This information is for educational and informational purposes only and should not be construed as financial advice. Always consult a licensed financial advisor before making investment decisions.
📌 #trading #stockmarket #economy #news #trendtao #charting #technicalanalysis

TESLA: Can it worth $4,000 a share buy end of 2026?Tesla is bullish on its 1D technical outlook (RSI = 65.527, MACD = 22.160, ADX = 43.922, being on a bullish wave to recover the ATH. Since the 2019 low the prevailing long term pattern is a Channel Up and the recent Feb-March correction resembles COVID's in March 2020. If that's the case then the stock is on a powerful long term bullish wave that can reach the 4.5 Fibonacci extension before the 5.0 time Fib. This implies that TSLA price per share can be $4,000 by the end of 2026. Do you think that's realistic?
See how our prior idea has worked out:
## If you like our free content follow our profile to get more daily ideas. ##
## Comments and likes are greatly appreciated. ##
