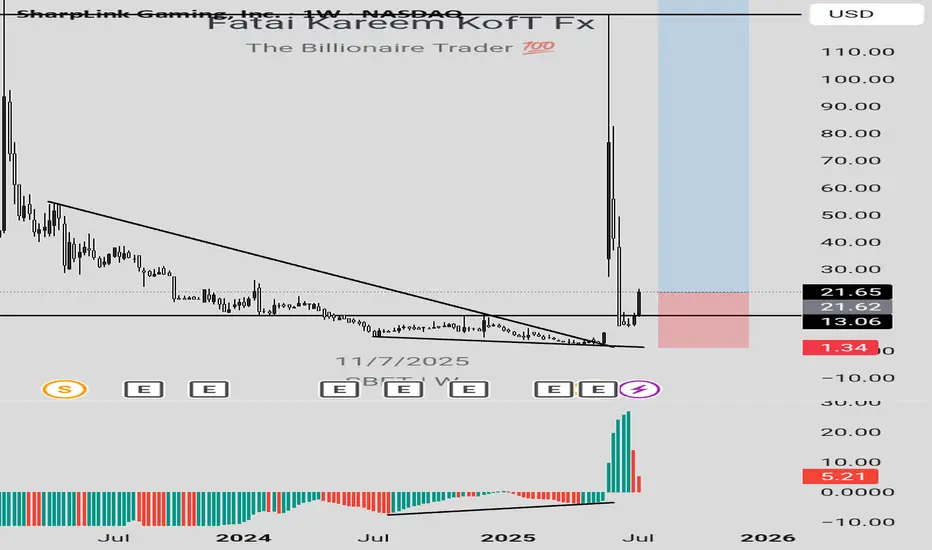
A life-changing SBET long ideaSBET stock presents an amazing long opportunity that has a potential to do over 100x. After the break out of a down trend line, price retraced to the support, with price closing above this support level.
To advantage of this long opportunity, you can buy from the current market price while the exit can be at $1.34 and the targets can be at $123.70, $178.48, $541.22, $1041.90 and the final target at $2155.20.
Confluences for the long opportunity are as follows:
1. Break out of down trendline
2. Retest of the down trendline and support level.
3. Bullish divergence signal from awesome oscillator.
Disclaimer: This is not a financial advice. The outcome maybe different from the projection. Don't take the signal if you're not willing to accept the risk.
Stocks
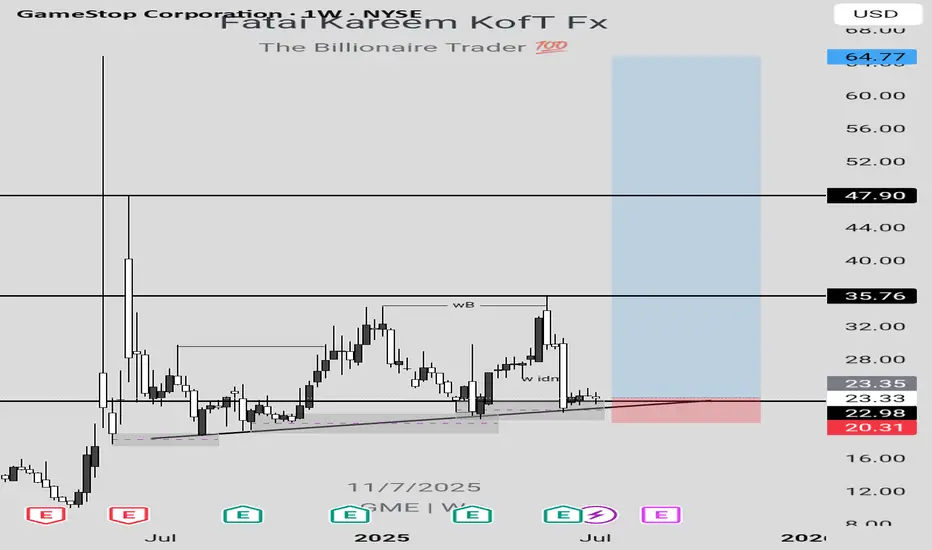
GME LONG IDEA UPDATEDIn my previous post regarding the long opportunity on GME stock, I called a long signal after a break out of a downtrend line. However, price had dropped down to the demand zone, giving another long opportunity.
To take advantage of this long opportunity, you can buy at the current market price, while the exit will be at $20.30 and the targets can be at $35.70, $47.90 and the final target at $64.70.
Confluences for the long idea are as follows:
1. Weekly break of structure
2. Valid Inducement
3. Orderflow
4. Price within the discount
5. Price respecting bullish trendline
6. Hammer candlestick confirmation
7. Price at a support level
Disclaimer: This is not a financial advice. The outcome maybe different from the projection. Don't take the signal if you're not willing to accept the risk.
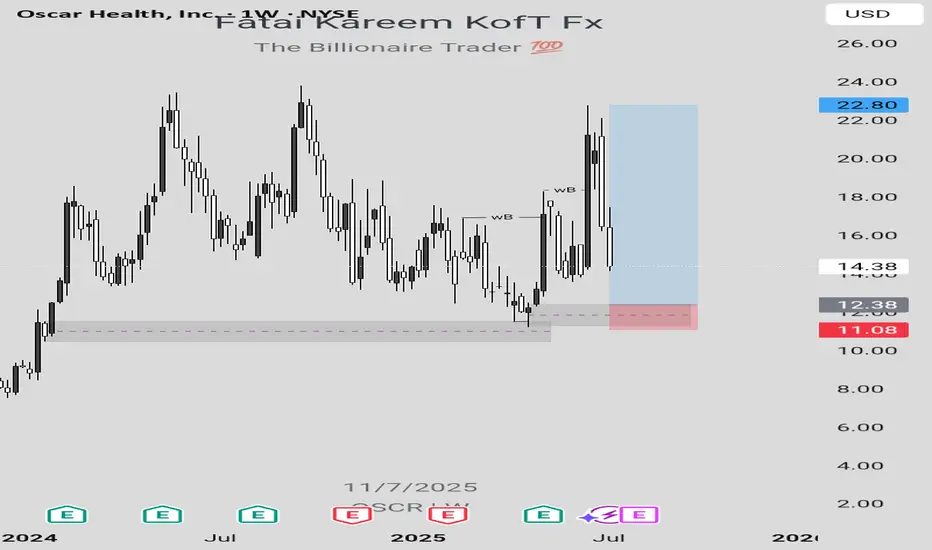
OSCR LONG IDEALooking at the weekly chart of OSCR stock, there's a long opportunity which can be taken advantage of to make some money provided that market follows the projection.
In order to take advantage of this long opportunity, a buy order limit can be placed at $12.38 while the exit can be at $11.09 and the final target can be at $22.80.
Confluences for this long idea are as follows:
1. Weekly break of structure
2. Valid Inducement (structural liquidity)
3. Orderflow
4. Sweep
5. Valid demand zone in the discount level
6. Imbalance
7. Pattern confirmation formed after mitigation of a demand zone indicating that there's a bullish change of trend.
Disclaimer: This is not a financial advice. The outcome maybe different from the projection. Don't take the signal if you're not willing to accept the risk.
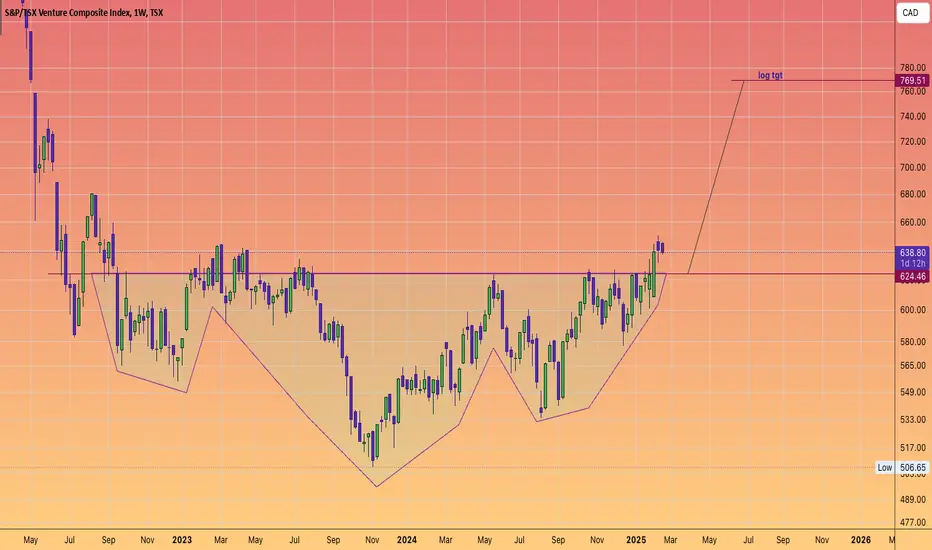
Canadian Venture index --- Inverse head & shouldersGold has reached unprecedented heights, approaching the $3000 mark—a prediction we made with precision. Now is the moment to turn our attention to silver and the mining sector.
To start, let's examine the Canadian venture index, which is displaying a promising inverse head and shoulders pattern. I am confident that the logarithmic projection will be achieved without much difficulty.
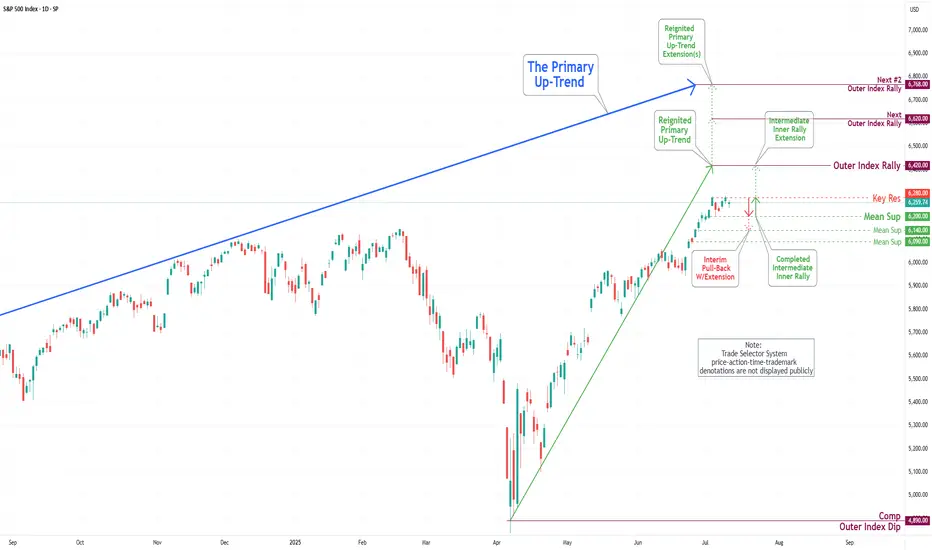
S&P 500 Daily Chart Analysis For Week of July 11, 2025Technical Analysis and Outlook:
During this trading week, the S&P 500 Index has shown a predominantly downward/upward course of action and created a new Key Resistance at 6280. Currently, the index exhibits a bullish bias, with the Outer Index Rally objective set at 6420. However, it is crucial to note that the current price action may cause prices to see in a new light from their current fluctuation to push toward the Mean Support at 6200 before resuming their upward movement.
MicroStrategy ($MSTR) – Bitcoin Proxy Setting Up AgainMicroStrategy Incorporated NASDAQ:MSTR remains the definitive institutional proxy for Bitcoin exposure, uniquely combining its enterprise software operations with a high-conviction, leveraged Bitcoin accumulation strategy. Its $1.42B BTC purchase in April 2025 further cements this thesis, making MSTR a prime vehicle for traders seeking amplified BTC exposure via equities.
Since our May 5th analysis, MSTR has rallied ~14.61%. We’re now eyeing a re-entry opportunity on a pullback to the $394–$387 zone, aligning with technical support and previous consolidation.
🎯 Bullish targets remain unchanged: $490.00–$500.00, backed by Bitcoin strength and MicroStrategy’s unwavering strategy.
🔁 Re-entry: $394–$387
🟩 Targets: $490–$500
#MSTR #Bitcoin #CryptoStocks #BTC #StockMarket #TechnicalAnalysis #MicroStrategy #HighBeta #CryptoExposure #TradingSetup

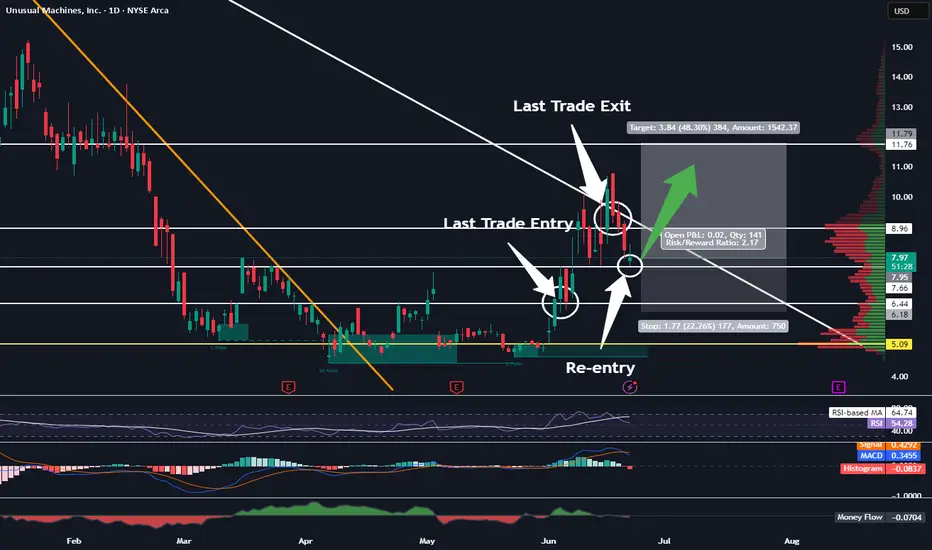
After 45% Profit On Last Trade, I Am Re-entering UMACTrading Family,
On our stock trades, using my new liquidity indicator, we have been solidly beating the market with a cool 15% profit since our first trade with it. If you had held the SPY from the same time, your profit would have been a more meager 6.5%. Our indicator is proving beneficial, to say the least. And the last time it gave me a buy signal on UMAC, we banked 45% in profit on my last exit. I then determined that if it did not give me a sell signal (it hasn't), I would look to re-enter at that 7.66 level. We have reached that level, and I have dipped my toes back in at 7.94. I would look to double up my position if we drop even further to that 6.44 level, but I don't know that we will. My target of 11.76 will give us another 48% profit on this trade, and I have a SL set at 6.18 for a nice 2.17 rrr.
Let's go!
Stew
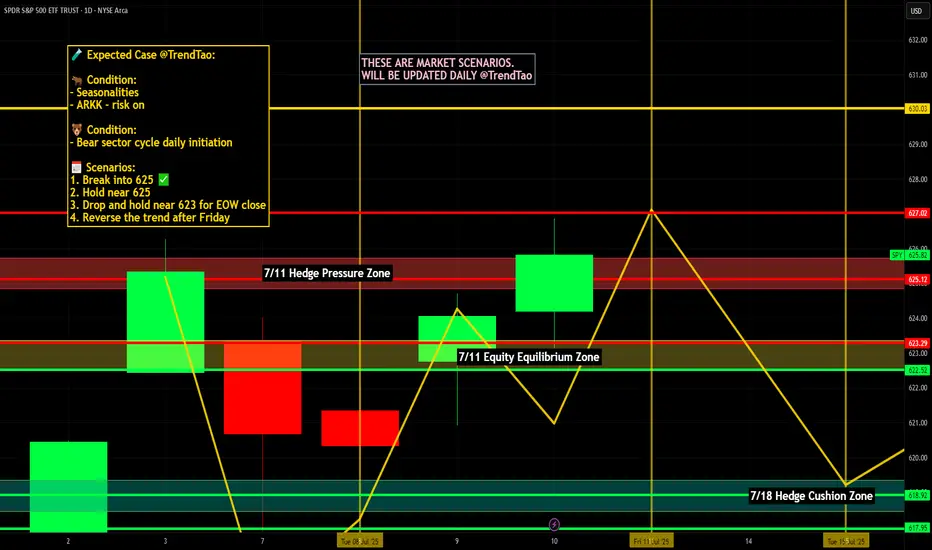
Nightly $SPY / $SPX Scenarios for July 11, 2025🔮 Nightly AMEX:SPY / SP:SPX Scenarios for July 11, 2025 🔮
🌍 Market-Moving News 🌍
🏦 Strong Bank Earnings Amid Tariff Churn
Next week’s Q2 forecasts point to robust earnings from U.S. banks—JPMorgan, Citi, Bank of America, Goldman Sachs, Morgan Stanley, and Wells Fargo—as trading and investment-banking revenue recover, offsetting uncertainties from ongoing tariffs
💬 Dimon Flags Fed Risk Pricing
JPMorgan’s Jamie Dimon cautioned that markets may be underestimating upside in interest rates. He sees a 40–50% probability of higher U.S. rates, driven by inflation from tariffs, migration, and fiscal deficits
⚖️ Tariff “Scattergun” Sparks Sector Disconnect
Trump’s plans to levy up to 200% tariffs on pharma and 50% on copper triggered uneven market reactions—copper prices rose 30% in six months, while European drugmakers remain flat, highlighting divergent sector sensitivities
📉 Tech & Macro Still Bullish
Despite policy turbulence, Nvidia climbed back above a $4 trillion valuation, and JPMorgan projects a $500 billion inflow into equities in H2—supporting gains even as broader macro pressures linger
📊 Key Data & Events
📅 Friday, July 11:
(No major U.S. economic data scheduled)
Markets will focus on bank earnings previews, tariff headlines, and the hold of the tech rally into a thin summer trading week.
⚠️ Disclaimer:
This information is for educational and informational purposes only and should not be construed as financial advice. Always consult a licensed financial advisor before making investment decisions.
📌 #trading #stockmarket #economy #tariffs #banks #tech #Fed #investing
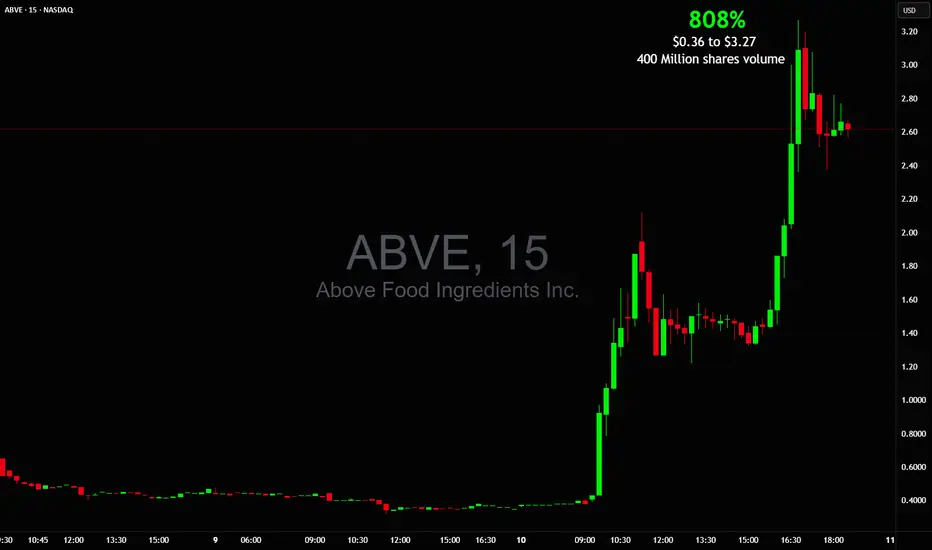
WOW! 808% in 1 day $0.36 to $3.27 on BIG 400M+ shares tradedMentioned it in chat several times with breakout prices
It traded more shares than NASDAQ:NVDA NASDAQ:TSLA NASDAQ:AAPL and NASDAQ:AMZN combined!
NASDAQ:ABVE picture perfect after hours squeeze
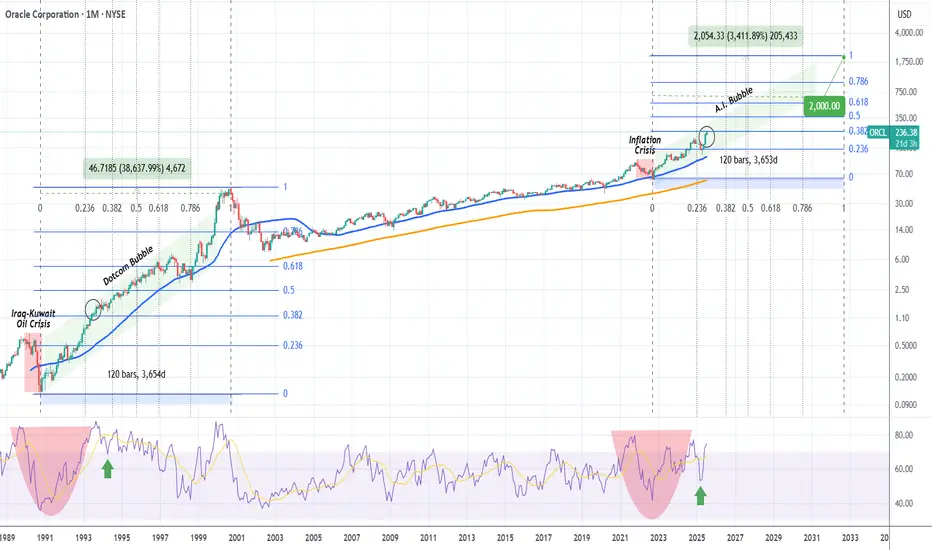
ORACLE Can you foresee it at $2000??Oracle (ORCL) is having perhaps the most dominant recovery from Trump's Tariff lows out of the high cap stocks, trading comfortable on new All Time Highs.
This is no surprise to us, as like we've mentioned countless times on our channel, we are currently at the start of the A.I. Bubble and heavy tech giants are expected to see massive gains until 2032, where we've calculated the end of this Bull Cycle and the start of a strong Bear.
As mentioned, this situation is extremely similar to the Dotcom Bubble of the 1990s. Of course Oracle is nearly impossible to repeat the +38637% gains of that Golden Decade after the 1990 Oil Crisis but in Fibonacci price and time terms, it can technically complete a +3411% rise and hit $2000 in the next 7 years.
If you have a long-term investor mindset like us, this is a must stock to buy and hold.
-------------------------------------------------------------------------------
** Please LIKE 👍, FOLLOW ✅, SHARE 🙌 and COMMENT ✍ if you enjoy this idea! Also share your ideas and charts in the comments section below! This is best way to keep it relevant, support us, keep the content here free and allow the idea to reach as many people as possible. **
-------------------------------------------------------------------------------
💸💸💸💸💸💸
👇 👇 👇 👇 👇 👇
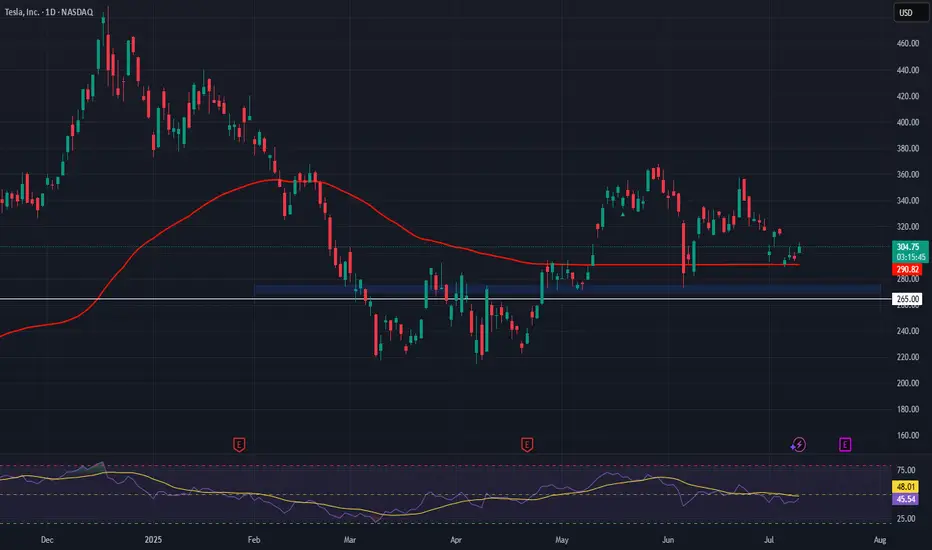
Tesla (TSLA) Market UpdateTesla NASDAQ:TSLA shares dropped nearly 7% after Elon Musk dismissed analyst Dan Ives' suggestion to scale back his political activities. Musk also proposed a new pay package, raising concerns among investors about potential distractions from Tesla’s core business.
📊 Upcoming Catalyst:
Tesla is set to report its Q2 earnings on July 23, with investors eagerly awaiting updates on the company’s financial performance and the newly launched robo-taxi service in Austin, Texas.
⚠️ Sentiment:
Recent bearish headlines include:
Concerns over potential Robotaxi issues
The ongoing Trump/Elon Musk political drama
📈 Trading Opportunity (Long Setup):
Despite the negative sentiment, this dip could offer a solid long entry opportunity:
Entry Zone: $275–$270
Take Profit Targets:
TP1: $315
TP2: $335
Stop Loss: Close below $265
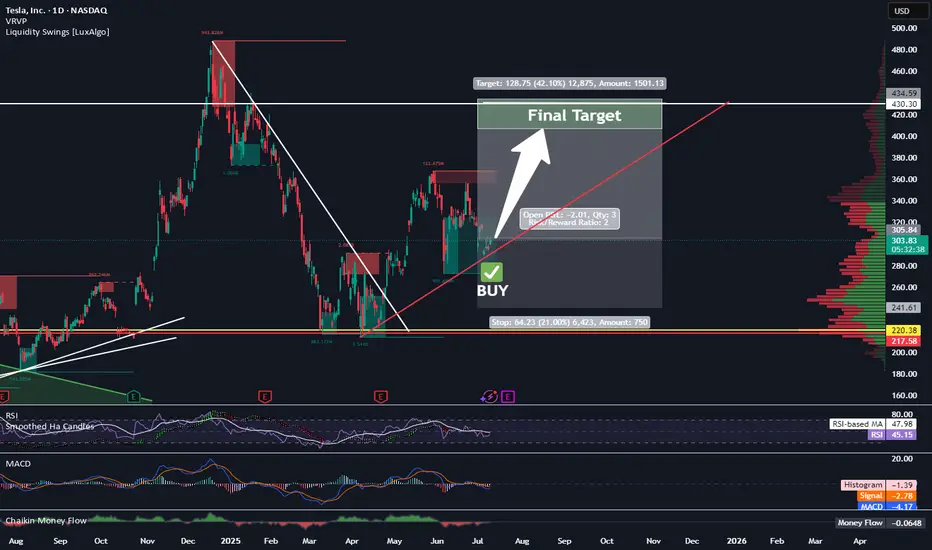
Long TESLATrading Fam,
Today my indicator has signaled a BUY on $TSLA. The technicals align. M pattern looks to have completed at strong support (RED TL) and is bouncing upwards inside of a solid liquidity block. Buyers are stepping in. I'm in at $315 and will shoot for $430 (probably taking some profit along the way). My SL is currently $241 but will trail as we enter profit.
Best,
Stew
A bit of profit taking on NVDA and then up again?NASDAQ:NVDA is the most talked about and everyone is capitalizing on that. Let's take a look.
NASDAQ:NVDA
Let us know what you think in the comments below.
Thank you.
75.2% of retail investor accounts lose money when trading CFDs with this provider. You should consider whether you understand how CFDs work and whether you can afford to take the high risk of losing your money. Past performance is not necessarily indicative of future results. The value of investments may fall as well as rise and the investor may not get back the amount initially invested. This content is not intended for nor applicable to residents of the UK. Cryptocurrency CFDs and spread bets are restricted in the UK for all retail clients.

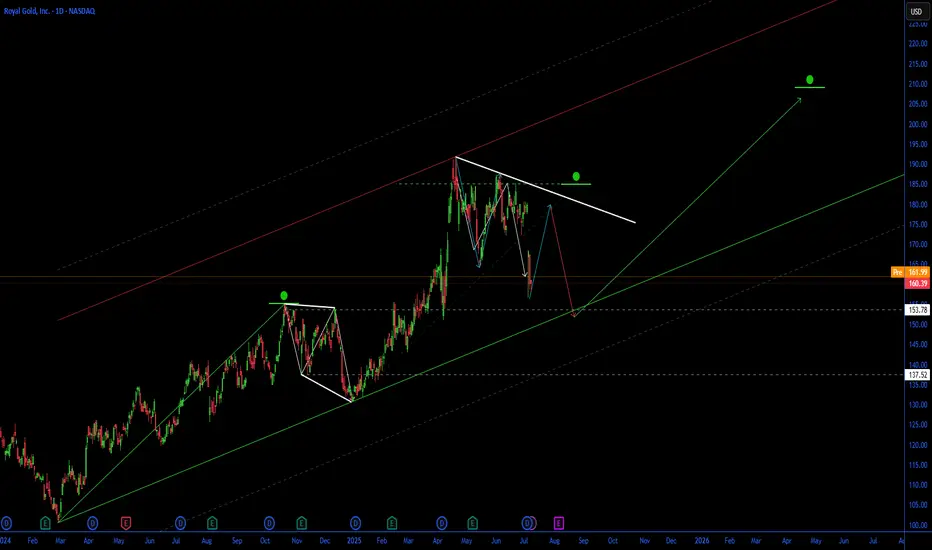
Royal Gold (RGLD) Poised for Growth with $3.5B Sandstorm Acq.🚀 **Royal Gold (RGLD) Poised for Growth with $3.5B Sandstorm Acquisition!** 🥇
Royal Gold ( NASDAQ:RGLD ) is making waves with its $3.5B all-stock acquisition of Sandstorm Gold ( NYSE:SAND ) and a $196M cash buyout of Horizon Copper, announced July 7, 2025. Here’s why this could be a game-changer for investors! 📈
**🔥 Financial Highlights:**
- **Q2 2025 Performance**: Sold 40,600 GEOs at $3,248/oz gold, $32.91/oz silver, with an impressive 87% gross margin. $11.1B market cap reflects strength. 💰
- **Acquisition Impact**: Sandstorm deal adds 40 producing assets, boosting 2025 GEO production by 26%. Expect revenue & earnings growth post-Q4 2025 close. 🚀
- **Dividend Confidence**: Declared $0.45/share Q3 dividend, signaling robust cash flows. 💸
**📊 Sector Edge & Valuation**:
- **Undervalued?** Compared to Wheaton ($56B) & Franco-Nevada ($44B), Royal Gold’s lower valuation (per RBC Capital) could signal a bargain. Post-deal scale (75% gold revenue) may close the gap. 📉
- **Performance**: Sandstorm’s record Q1 2025 results + Royal Gold’s aggressive expansion outpace peers in growth potential. 🚀
**⚠️ Risks to Watch**:
- 6%–8.5% stock dip post-announcement reflects dilution fears (~19M new shares). 📉
- Commodity price volatility & regulatory approvals (due Q4 2025) pose risks. ⚖️
**🎯 SWOT Snapshot**:
- **Strengths**: Enhanced portfolio, 87% margins, leading North American royalty player.
- **Opportunities**: Analyst optimism (BMO $197 target) & copper exposure via Horizon.
- **Weaknesses**: Short-term dilution concerns.
- **Threats**: Commodity price swings, peer competition.
**💡 Why Buy Now?**
Royal Gold’s stock dip could be a buying opportunity, with analysts like BMO ($197 target) and unusual options activity signaling confidence. If precious metals stay hot ($3,342.80/oz gold futures), RGLD’s diversified portfolio could shine! 🌟
📅 **Deal Close**: Q4 2025, pending approvals.
🔎 **Dive Deeper**: Check Royal Gold’s IR page or Yahoo Finance for details.
What’s your take on NASDAQ:RGLD ’s big move? Bullish or cautious? 🐂🐻 #StockMarket #Gold #Investing
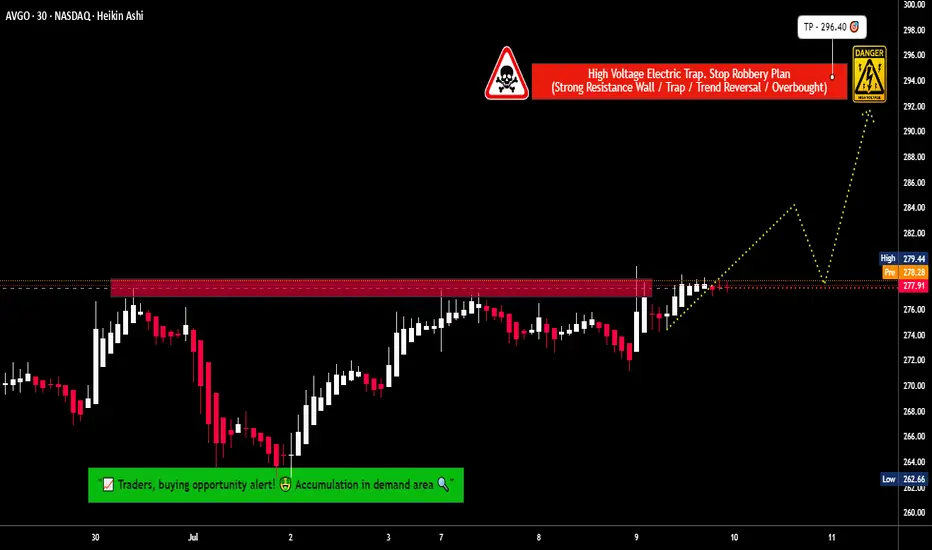
Steal the Breakout: Broadcom Bulls Are In!💎🔓 "Broadcom Break-In: Bullish Vault Raid in Progress!" 🔓💎
🌟Hi! Hola! Ola! Bonjour! Hallo! Marhaba!🌟
Dear Money Makers & Market Robbers 🤑💰✈️,
It’s time for a high-stakes raid on BROADCOM, INC (AVGO) — all based on our secret Thief Trading Strategy™, combining sharp technicals & a sniff of fundamentals.
🕵️♂️ Mission Brief:
Our target is the Bullish Vault – a swing/day trade play with upside momentum. The chart reveals a possible trap at overbought zones where unsuspecting bears get lured in... and we walk out rich! 😏💸
🎯 The Heist Blueprint:
📥 Entry (Buy-In Point):
🚪 “The vault’s open – grab the bullish bags!”
Swipe any bullish setup on the 15m/30m timeframe
Ideal: Buy Limit near recent swing low (support levels)
📳 Set alerts to stay ready – we rob smart, not fast
🛑 Stop-Loss (Escape Plan):
Place SL below recent 30m swing low — approx. 269.00
Adjust by your lot size & number of trades
Don't risk the whole bag – we ain't greedy thieves 😈
📈 Target (Take-Profit Point):
🎯 First Exit Zone: 296.00
💨 Or vanish before the cops (market reversal) arrive
🧲 Scalpers’ Secret:
Only scalp long – don’t fight the bullish flow
Got big capital? Enter early. Small bag? Join the swing crew
Use Trailing SL to guard your stolen gains 🏦🔐
💡 Behind the Heist:
AVGO is showing bullishness thanks to:
📰 Macro Drivers • COT Reports • Institutional Bias
📊 Sentiment Analysis • Index Correlations
💥 Geopolitical Developments – Always stay updated
🔎 Want more intel? Dive into the news, fundamentals, & positioning data that power this trade idea 💣
⚠️ Trade Smart, Thieves:
📛 News events cause chaos – avoid fresh entries during releases
📉 Use trailing stops to secure your loot & dodge slippage
💖 Like the Heist Plan? Hit Boost!
Let’s build the most notorious money-making crew on TradingView! 🚀
Daily gains using the Thief Style™ – not for the faint-hearted.
🔒 Stay sharp, trade like a phantom, and keep stacking that digital cash!
💬 Drop a comment if you’re in the gang – another plan’s coming soon! 🤑🐱👤
📌 Note: This is a general market analysis. Do your own due diligence before risking real capital.
📌 Stay updated — the market changes fast. Adapt or get trapped.
$CLSK Resistance Ready to break?NASDAQ:CLSK is attempting to push above the resistance at $12.4 continuing the path from the recent analysis.
A breakthrough could push it rapidly to the High Volume Node resistance at $18.
Safe trading

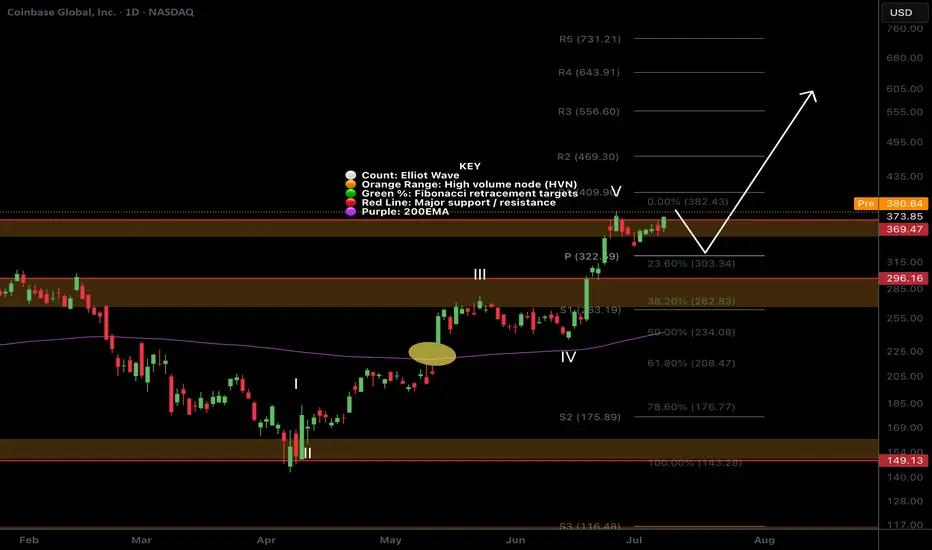
$COIN Price discovery?I was looking for a deeper pullback on NASDAQ:COIN but it appears to be heading into price discovery!
The pivot at $322 was my target but sentiment must be bullish if investors are impatient! Still... i wouldn't count out another sell off as a bear trap on a poke above the swing high.
Safe trading
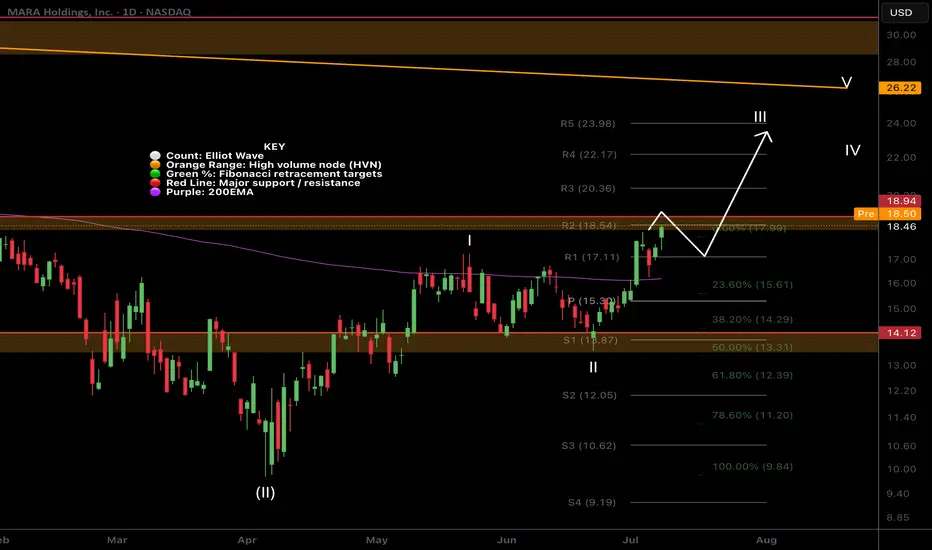
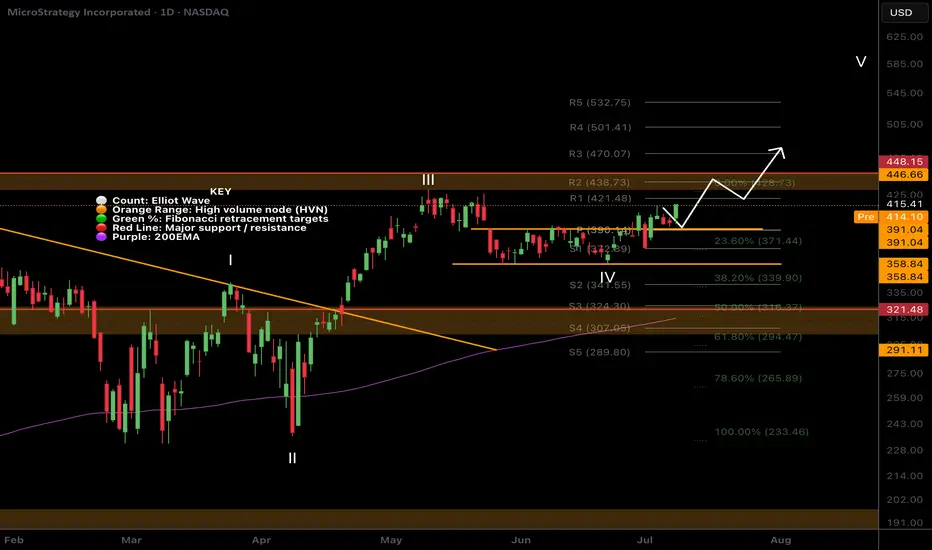
$MARA at Resistance!NASDAQ:MARA continues its rally and has come into the High Volume Node resistance target and R2 daily pivot.
Daily 200EMA was tested as support after price smashed through. I expect continuation to the upside $24 target at the R5 daily pivot after some consolidation at this resistance.
Analysis is invalidated way below wave 2 at $13
Safe trading
$MSTR Continues on last weeks path!NASDAQ:MSTR continues to breakout above the channel after a retest as support.
High Volume Node at $440 may proof tough but if price breaks through we could see a strong FOMO induced breakout into price discovery.
Analysis is invalidated below the channel at $358.
Safe Trading
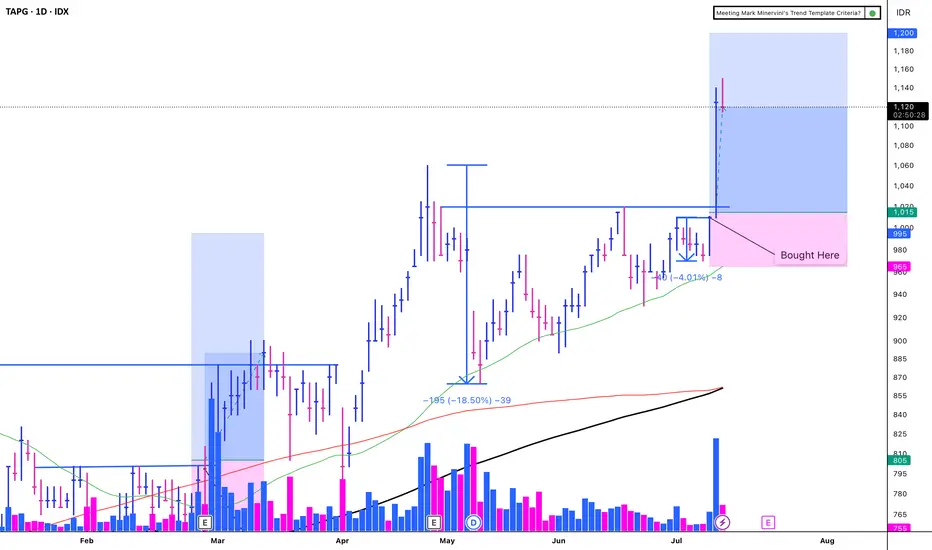
TAPG - VCP (11W 18/4 3T)IDX:TAPG - VCP
(+):
1. Low risk entry point on a pivot level.
2. Volume dries up.
3. Price has been above the MA 50 for over 10 weeks, with values exceeding 150, 200, and 300.
4. Price is within 25% of its 52-week high.
5. Price is over 30% of its 52-week low.
6. The 200-day MA has been trending upwards for over a month.
7. The RS Rating is above 70 (86).
8. There has been a significant breakout with substantial volume
**EPS Growth:**
a. Quarterly QoQ: -46.42%.
b. Quarterly YoY: +117.27%.
c. TTM YoY: +111.05%.
d. Annual YoY: +94.02%.
(-)
1. Trump Implements a 32% Increase in Tariffs on Indonesia
2. The market is volatile due to the ongoing war
SMCI - Bull Flag Breakout SetupSMCI formed a strong bullish impulse followed by a bull flag pattern.
A breakout above the flag structure may signal continuation if confirmed with strong price action.
Trade Plan:
• Entry: On breakout or retest
• Stop Loss: Below flag support
• TP1: Recent high
• TP2: Measured flagpole extension
This setup is worth monitoring for potential bullish continuation.
Disclaimer: This is not financial advice. For educational purposes only.

Nightly $SPY / $SPX Scenarios for July 10, 2025🔮 Nightly AMEX:SPY / SP:SPX Scenarios for July 10, 2025 🔮
🌍 Market-Moving News 🌍
🏦 Global Banks Profit from Tariff Volatility
Major banks like JPMorgan, BofA, and Citigroup are expected to see ~10% growth in trading revenue in Q2, fueled by volatility from President Trump’s tariff policy shifts. Treasury trading volumes hit record highs as markets priced in policy swings
📈 S&P 500 Nears Lull Amid Bull Market Strains
Despite record highs in 2025, investors are warning that the rally may be reaching its limit. Bullish sentiment is strong, but analysts caution that sluggish consumer spending, rising inflation from tariffs, and few rate-cut signals from the Fed could cap downside momentum
🐻 Bear Case Gains Ground
Stifel’s Barry Bannister projected a potential ~12% correction in the second half of 2025. Key risks include slowing consumer spending, weak capital investment under tariff uncertainty, and persistent core inflation above 3%, negatively impacting earnings and growth outlooks
⚖️ “One Big Beautiful Bill” Could Add Trillions in Debt
The new fiscal package signed July 4 will add $3–4 trillion to national debt over the next decade while extending tax cuts and revising EV incentives. Bond market and Fed policy implications may become more pronounced if growth fails to keep pace
📊 Stocks vs Bonds: Diverging Signals
While equities climb and megacaps extend gains, Treasury yields have risen five days straight—signaling growing caution over real growth prospects. The yield curve steepening hints at mixed signals: growth optimism in stocks, but bond market signaling economic risk ahead
📊 Key Data & Events
📅 Thursday, July 10:
No major scheduled economic releases. Markets remain driven by tariff headlines, bank earnings reactions, and evolving Fed signals.
⚠️ Disclaimer:
This is for informational and educational purposes only—not financial advice. Consult a licensed advisor before making investment decisions.
📌 #trading #marketvolatility #tariffs #banks #Fed #debt #technicalanalysis
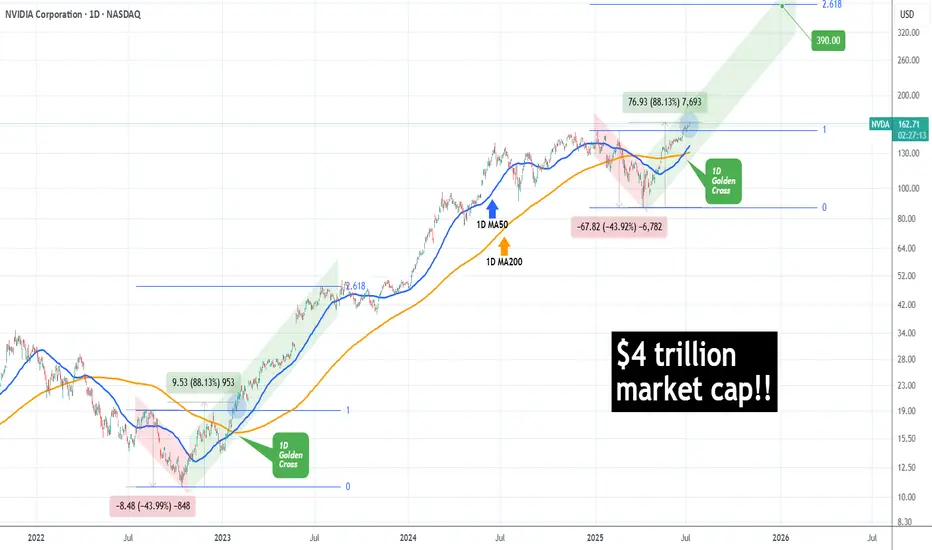
NVIDIA made history! First company with $4 trillion market cap!NVIDIA Corporation (NVDA) became today the first company in history to surpass a $4 trillion market value, as A.I. bulls extended the recent rally and pushed the price past the approximate $163.93 level needed to reach this market capitalization threshold.
The long-term trend on the 1D time-frame couldn't look more bullish. Coming off a 1D Golden Cross less than 2 weeks ago, the price has turned the 1D MA50 (blue trend-line) into Support and sits at +88.13% from the April 07 2025 Low.
This is the exact set-up that the market had when it was coming off the 2022 Inflation Crisis bottom (October 13 2022). As you can see, both fractals started with a -44% decline, bottomed and when they recovered by +88.13%, there were just past a 1D Golden Cross. In fact that Golden Cross (January 24 2023) was the last one before the current.
NVIDIA entered a Channel Up (green) on its recovery and for as long as the 1D MA50 was supporting, it peaked on the 2.618 Fibonacci extension before it pulled back below it.
If history repeats this pattern, we are looking at a potential peak around $390, which may indeed seem incredibly high at the moment, but as we pointed out on previous analyses, the market is in the early stages of the A.I. Bubble, similar to the Internet Bubble of the 1990s.
-------------------------------------------------------------------------------
** Please LIKE 👍, FOLLOW ✅, SHARE 🙌 and COMMENT ✍ if you enjoy this idea! Also share your ideas and charts in the comments section below! This is best way to keep it relevant, support us, keep the content here free and allow the idea to reach as many people as possible. **
-------------------------------------------------------------------------------
💸💸💸💸💸💸
👇 👇 👇 👇 👇 👇